
1 引言
2 研究区概况及土地利用类型变化
表1 车尔臣河流域2001年和2021年土地利用类型面积及变化量Table 1 Land use area and changes in the Cherchen River Basin in 2001 and 2021 |
| 类型 | 2001年面积/km² | 2021年面积/km² | 变化面积/km² | 变化幅度 |
|---|---|---|---|---|
| 林地 | 34.25 | 18.75 | 减少15.5 | 减少45.2% |
| 草地 | 2034.5 | 4461 | 增加2427 | 增加119% |
| 耕地 | 5.57 | 12 | 增加6.75 | 增加120% |
| 水域 | 374.5 | 2279.5 | 增加1905 | 增加510% |
| 裸地 | 164399 | 160077 | 减少4322 | 减少2.63% |
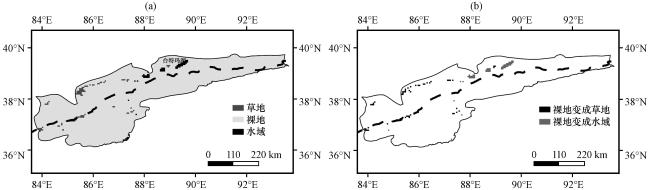
图1 车尔臣河流域2001年土地利用类型分布(a)及自2001 -2021年土地利用类型变化分布(b)水域增加区域为台特玛湖(图中黑色虚线为2000 m等高线, 以下图4~6中相同) Fig.1 Distribution of land use types in the Cherchen River Basin in 2001 (a) and Distribution of land use types change from 2001 to 2021 in the Cherchen River Basin (b).The area of water increase is Lake Taitema.The black dotted line in the figure is the 2000 m contour line, the same as in Fig.4~6 below |
3 实验设置及验证
3.1 实验设置
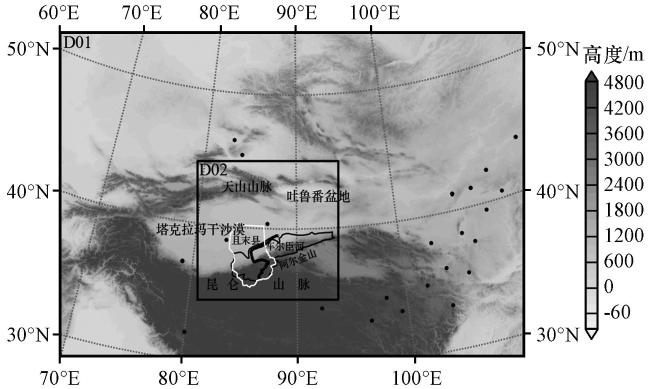
图2 WRF双层模拟区域内地形高度及地面气象站分布黑点表示模拟范围内的地面气象站, 黑色粗线条为车尔臣河, 白色线条包围区域为且末县, 黑色细线条包围区域为车尔臣河流域 Fig.2 The terrain height of the WRF double-layer simulated area and the distribution map of surface weather stations in China.The black dots in the figure represent the Chinese surface weather stations within the simulated range, with the black thick line being the Cherchen River, the white line surrounding the area being Jimo County, and the black thin line surrounding the area being the Cherchen River Basin |
3.2 模拟结果验证
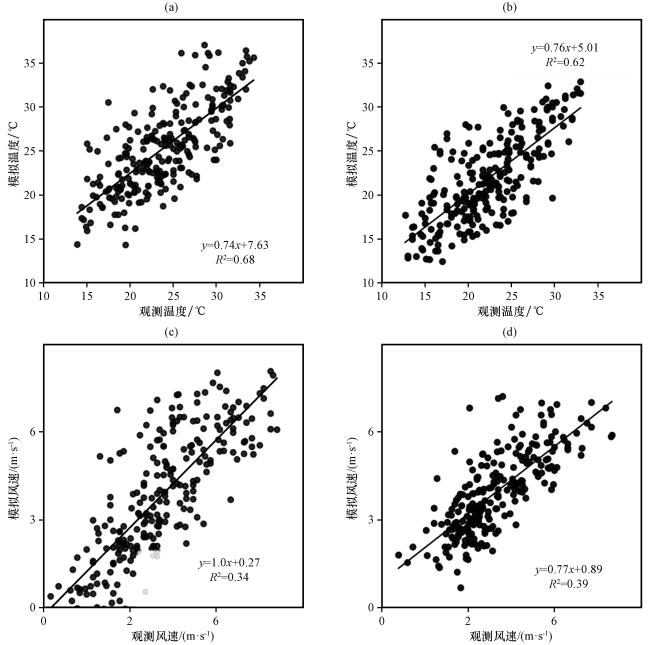
表2 D01和D02模拟的温度、 降水的统计量检验Table 2 Statistical tests of temperature and precipitation simulated by D01 and D02 |
| 模拟域变量 | R | MSE | MAE | RMSE |
|---|---|---|---|---|
| DO1温度 | 0.78 | 9.98 ℃ | 2.03 ℃ | 3.16 ℃ |
| DO1降水 | 0.50 | 16.81 mm | 2.75 mm | 4.1 mm |
| DO2温度 | 0.81 | 8.18 ℃ | 1.95 ℃ | 2.86 ℃ |
| DO2降水 | 0.61 | 12 mm | 2.2 mm | 3.4 mm |
| DO2风速 | 0.60 | 15.2 m·s-1 | 2.51 m·s-1 | 3.9 m·s-1 |
4 车尔臣河流域土地利用类型变化对区域气候的影响
4.1 车尔臣河流域湿度和降水
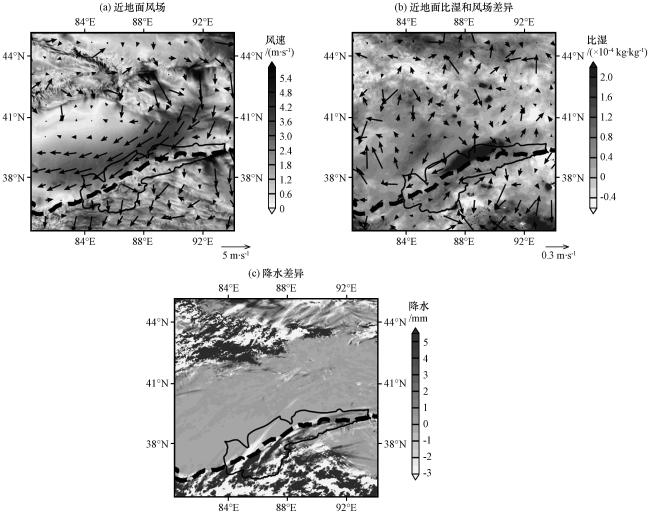
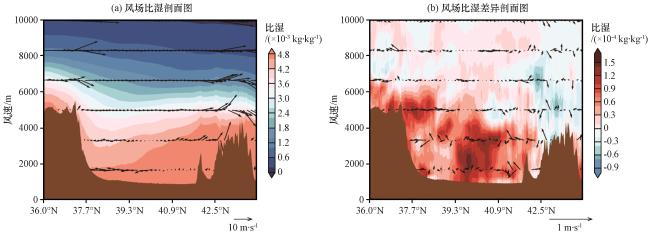
图4 D02模拟范围内近地面风场分布(a)、 实验21和实验01近地面比湿和风场差异(b)及地面夏季降水差异(c)Fig.4 Distribution of near-surface wind field in the simulated range of D02 (a), Differences in near-surface specific humidity and wind field (b) and Differences in surface summer precipitation (c) in Experiment 21 and Experiment 01 |
4.2 车尔臣河流域地面温度
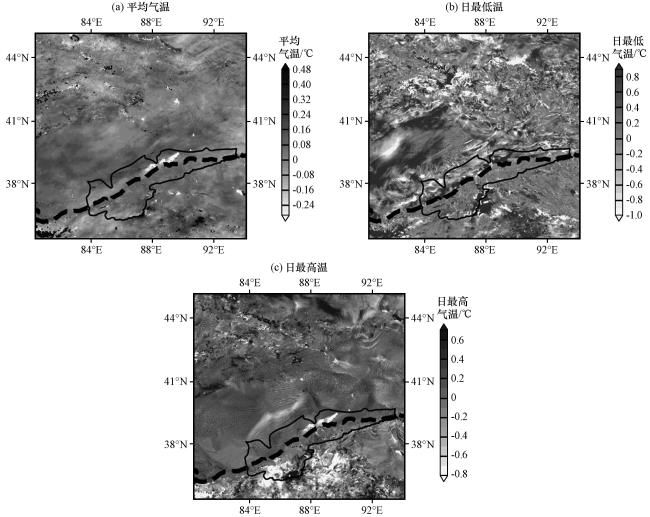
图5 实验21和实验01模拟的车尔臣河流域2021年7月地面2 m气温差异(a)平均气温, (b)日最低温, (c)日最高温 Fig.5 Experiment 21 and Experiment 01 simulated the difference of 2 m ground temperature in July 2021 in the Cherchen River Basin.(a) mean temperature, (b) daily minimum temperature, (c) daily maximum temperature |
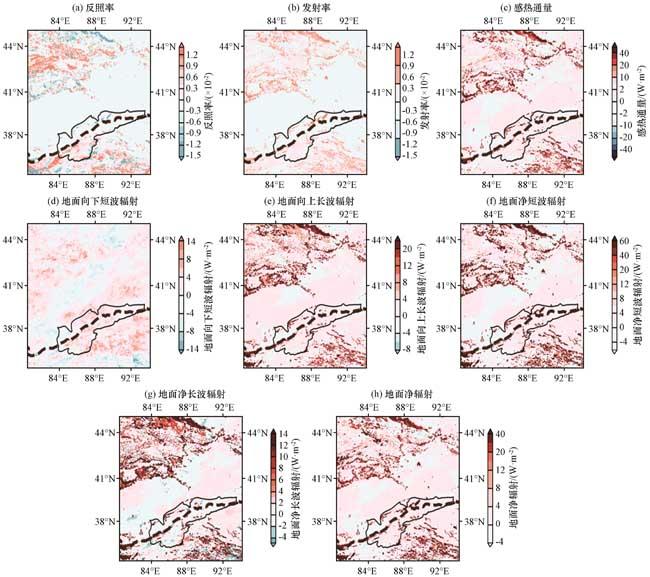
图6 实验21和实验01模拟结果差异(a)反照率, (b)发射率, (c)感热通量(单位: W·m-2), (d)地面向下短波辐射(单位: W·m-2), (e)地面向上长波辐射(单位: W·m-2), (f)地面净短波辐射(单位: W·m-2), (g)地面净长波辐射(向上长波–向下长波)(单位: W·m-2), (h)地面净辐射(单位: W·m-2) Fig.6 Differences between the simulation results of Experiment 21 and Experiment 01.(a) albedo, (b) emissivity, (c) Sensible heat flux (unit: W·m-2), (d) Ground downward shortwave radiation (unit: W·m-2), (e) Ground upward longwave radiation (unit: W·m-2), (f) Ground net shortwave radiation (unit: W·m-2), (g) Ground net longwave radiation (upward longwave-downward longwave) (unit: W·m-2), (h) Ground net radiation (unit: W·m-2) |