
1 引言
2 资料来源和方法介绍
2.1 资料来源
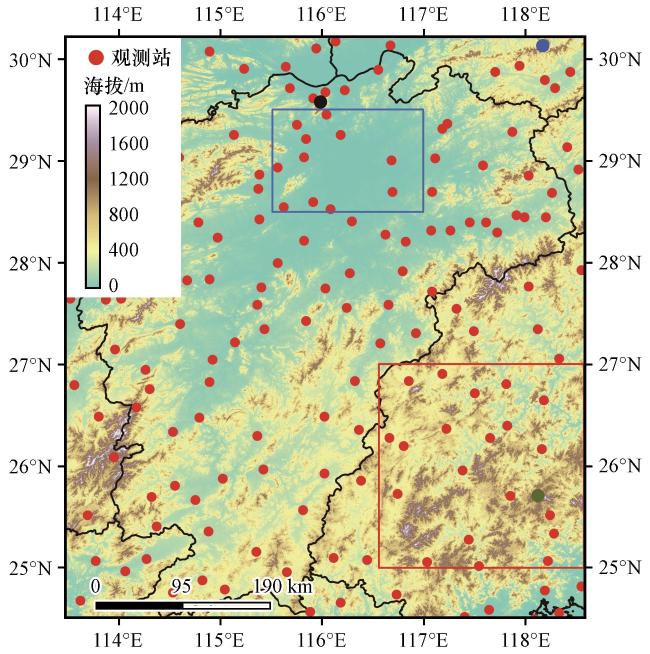
图1 江西智能网格预报区域观测站和海拔分布 蓝色方框标注鄱阳湖平原中部, 红色方框标注浙闽丘陵南部, 蓝色点标注黄山, 黑色点标注庐山, 绿色点标注九仙山Fig.1 The distribution of the observation station and the elevation in Jiangxi intelligent grid forecast domain.The blue box on the map indicate the the middle part of Poyang Lake Plain, the red box indicate the south Zhejiang-Fujian hilly region, the blue dot indicate Huangshan, the black dot indicate Lushan, the green dot indicate Jiuxianshan |
2.2 方法介绍
2.2.1 地形高度偏差导致的气温误差订正方法
2.2.2 数理订正方法
2.2.3 再订正实验方案
2.2.4 误差分析方法
3 地形偏差导致的气温误差订正结果分析
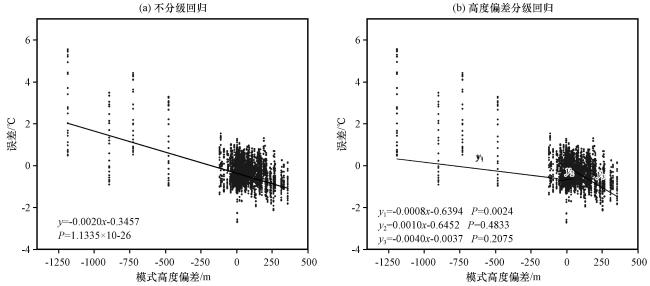
图2 2021年模式气温误差与地形高度偏差的分布及不分级回归分析(a)、 高度偏差分级回归分析(b)Fig.2 Distribution and ungraded regression analysis (a), graded regression analysis of height error (b) of 2021 model temperature error and terrain height error |
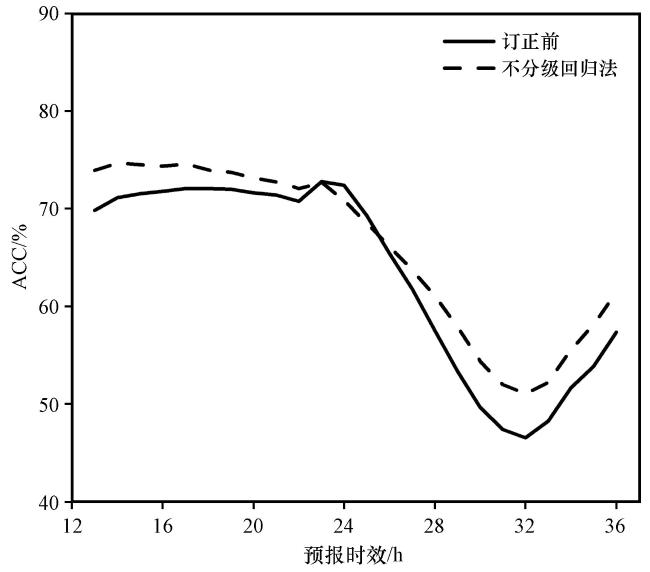
表1 2022年订正前和不分级回归法订正后平均MAE及ACCTable 1 Average MAE and ACC before and after the Correction of ungraded regression method in 2022 |
| 时段 | 订正前 | 不分级回归法 | ||
|---|---|---|---|---|
| MAE/℃ | ACC/% | MAE/℃ | ACC/% | |
| 白天 | 2.14 | 55.2 | 2.00 | 58.5 |
| 夜间 | 1.50 | 71.6 | 1.45 | 73.5 |
4 再订正结果分析
4.1 确定最优周期
表2 2022年不同周期的一维卡尔曼滤波法再订正后平均MAE及ACCTable 2 Average MAE and ACC after re-correction by one-dimensional Kalman filtering method with different periods in 2022 |
| 误差参数 | 不同周期的一维卡尔曼滤波法再订正后参数平均值 | ||||||||
|---|---|---|---|---|---|---|---|---|---|
| 5 d | 7 d | 10 d | 15 d | 20 d | 25 d | 30 d | 40 d | 50 d | |
| MAE/℃ | 1.57 | 1.56 | 1.55 | 1.55 | 1.56 | 1.57 | 1.58 | 1.59 | 1.61 |
| ACC/% | 71.50 | 71.90 | 71.90 | 72.20 | 72.00 | 71.40 | 71.10 | 70.60 | 70.00 |
表3 2022年不同周期的中位数法、 平均值法再订正后平均MAE及ACCTable 3 Average MAE and ACC after re-correction by median method, mean method with different periods in 2022 |
| 误差参数 | 不同周期的中位数法、 平均值法再订正后参数平均值 | ||||||||
|---|---|---|---|---|---|---|---|---|---|
| 5 d | 10 d | 15 d | 20 d | 25 d | 30 d | 40 d | 50 d | ||
| 中位数法 | MAE/℃ | 1.55 | 1.53 | 1.51 | 1.50 | 1.50 | 1.50 | 1.52 | 1.55 |
| ACC/% | 72.10 | 72.70 | 73.20 | 73.60 | 73.60 | 73.40 | 72.80 | 72.00 | |
| 平均值法 | MAE/℃ | 1.54 | 1.53 | 1.51 | 1.49 | 1.50 | 1.51 | 1.52 | 1.55 |
| ACC/% | 72.50 | 72.90 | 73.40 | 73.70 | 73.60 | 73.30 | 72.70 | 71.90 | |
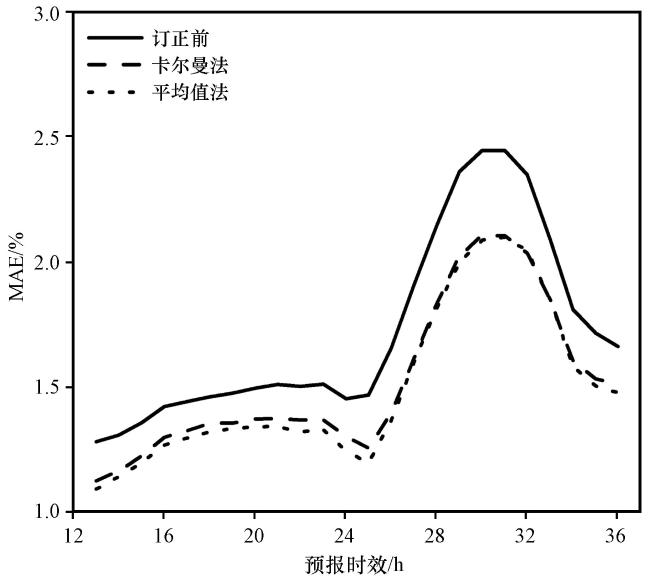
4.2 订正结果逐时效分布分析
表4 卡尔曼法、 平均值法订正再后平均MAE及ACCTable 4 Average MAE and ACC after re-correction by Kalman method and mean method |
| 时段 | 卡尔曼法 | 平均值法 | ||
|---|---|---|---|---|
| MAE/℃ | ACC/% | MAE/℃ | ACC/% | |
| 白天 | 1.77 | 66.0 | 1.73 | 67.5 |
| 夜间 | 1.33 | 77.8 | 1.27 | 79.5 |
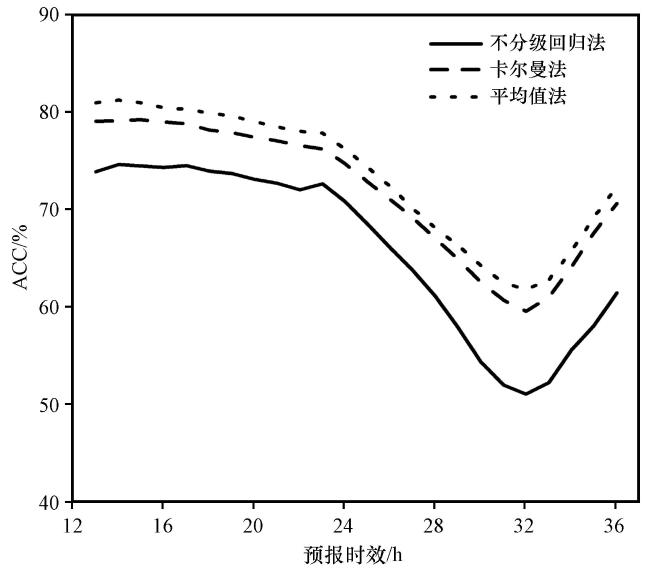
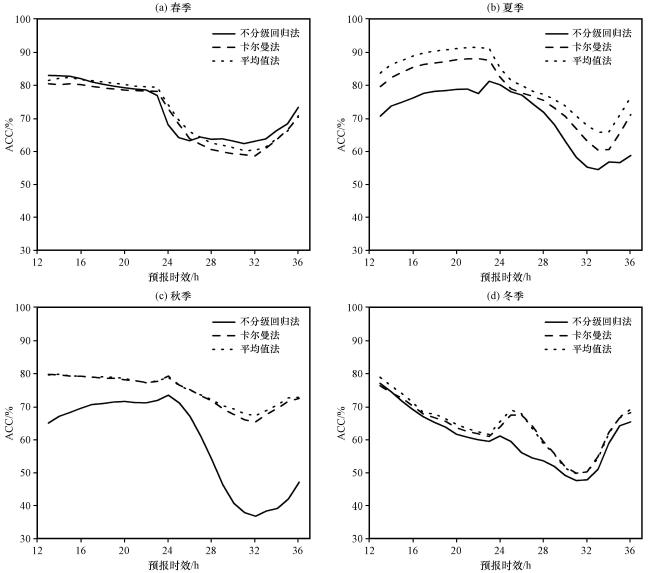
图5 卡尔曼法、 平均值法再订正后不同季节的ACC逐时效分布(以不分级回归法订正结果为参照)(a) 春季, (b) 夏季, (c) 秋季, (d)冬季Fig.5 Hourly ACC distribution after re-correction by Kalman method and mean method in different seasons (Reference to the result after correction by ungraded regression).(a) Spring, (b) Summer, (c) Autumn, (d) Winter |
4.3 订正后空间分布特征
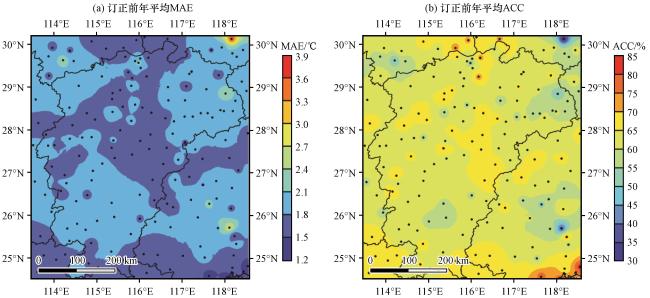
图6 订正前的年平均MAE(a)和ACC(b)空间分布Fig.6 Spatial distribution of annual average MAE (a) and ACC (b) before correction |

图7 不分级回归法订正后(左)和卡尔曼法(中)、 平均值法(右)再订正后年平均MAE(a~c)和ACC(d~f)相对于订正前的差值的空间分布Fig.7 Spatial distribution of the difference between after correction and before correction about the annual average MAE (a~c) and ACC (d~f) by the ungraded regression method (left), re-correction by Kalman method (medium) and mean method (right) |
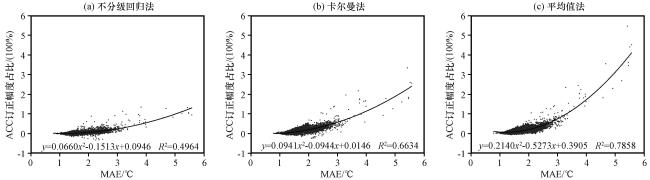
图8 所有国家站预报时效的订正前MAE和平均值法订正后ACC订正幅度占比(单位: 100×%)拟合图(a) 不分级回归法, (b) 卡尔曼法, (c) 平均值法Fig.8 Fitting diagram of MAE before correction and the proportion of ACC correction margin after the correction by mean methods for all forecast hours of national stations.(a) Ungraded regression method, (b) Kalman method, (c) Mean method |
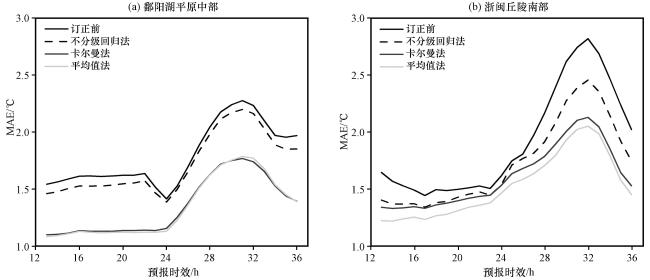
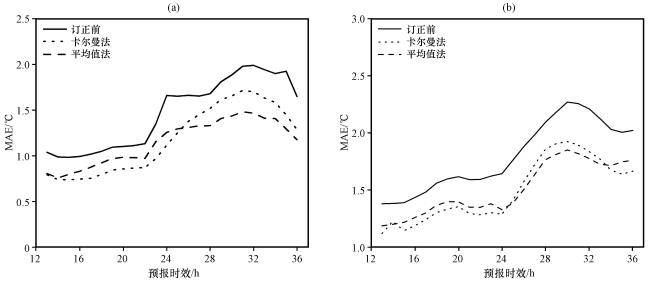
4.4 鄱阳湖平原中部和浙闽丘陵南部地区的误差订正效果检验
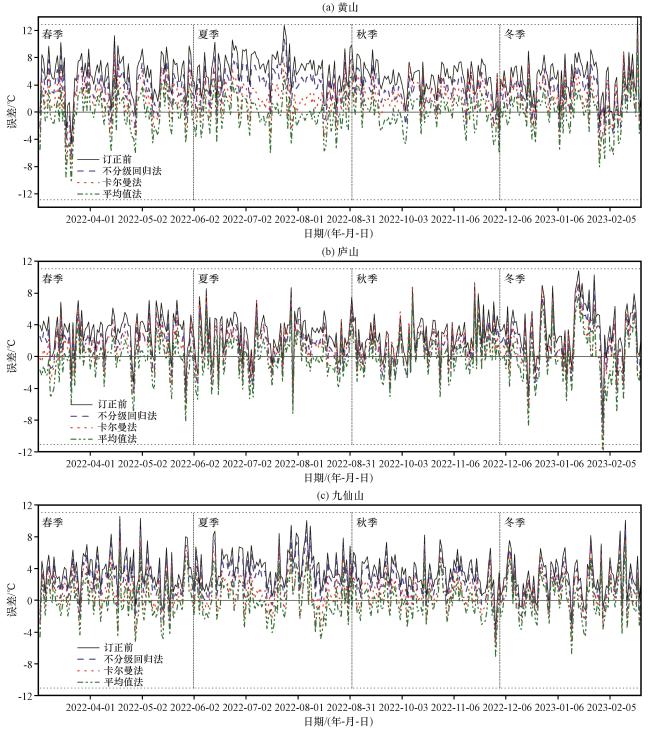
4.5 高海拔山区逐日订正效果检验
4.6 转折性天气订正效果检验
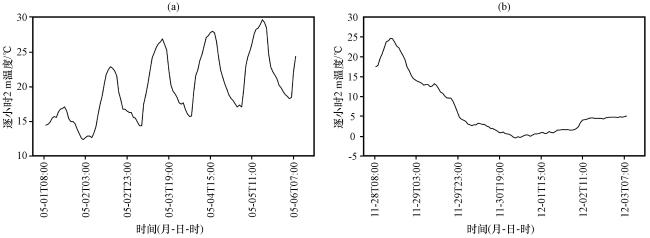
图12 2022年5月1日08:00至6日08:00(a)和2022年11月28日08:00至12月3日08:00(b)的南昌逐时气温分布Fig.12 Hourly distribution of temperature for Nanchang from 08:00 on 1 to 08:00 on 6 May 2022(a) and from 08:00 28 November to 08:00 3 December 2022(b) |