
1 引言
2 研究区概况与数据来源
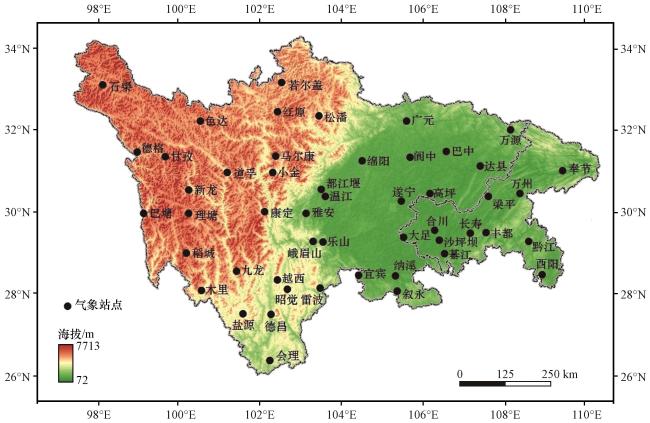
2.1 研究区概况
2.2 数据资料
表1 CMIP6的5个模式简介Table 1 An introduction to the five models of CMIP6 |
| 序号 | 模式 | 机构 | 国家 | 格点数 |
|---|---|---|---|---|
| 1 | BCC-CSM2-MR | BCC | 中国 | 320×160 |
| 2 | CMCC-ESM2 | CMCC | 意大利 | 288×192 |
| 3 | EC-Earth3 | EC-Earth | 欧洲 | 512×256 |
| 4 | GFDL-ESM4 | GFDL | 美国 | 288×180 |
| 5 | INM-CM4-8 | INM | 俄罗斯 | 180×120 |
2.3 研究方法
2.3.1 泰勒图和定量化指标 S
2.3.2 标准化距平变量
2.3.3 极端降水指数
表2 所选5个极端降水指数及定义Table 2 The selected five extreme precipitation indices and their definitions |
| 序号 | 指数名称/单位 | 缩写 | 定义 |
|---|---|---|---|
| 1 | 暴雨日数/d | R50mm | 日降水量≥50 mm的日数 |
| 2 | 强降水量/mm | R95p | 日降水量>第95个百分位数的降水总量 |
| 3 | 最大单日降水量/mm | RX1day | 一年中单日最大降水量 |
| 4 | 五日最大降水量/mm | RX5day | 一年中连续5日最大降水量 |
| 5 | 降水强度指数/(mm·d-1) | SDII | 日降水量≥1 mm的总量与总日数的比值 |
2.3.4 暴雨洪涝灾害风险评估模型
3 结果与讨论
3.1 CMIP6模式性能评估
表3 5个CMIP6单模式与5个极端降水指数的泰勒图评估结果Table 3 Taylor diagram evaluation results of 5 CMIP6 single models and 5 extreme precipitation indices |
| 模式 | 评价指标 | 极端降水指数 | ||||
|---|---|---|---|---|---|---|
| R50mm | R95p | RX1day | RX5day | SDII | ||
| BCC-CSM2-MR | SD | 0.54 | 82.82 | 11.80 | 20.10 | 0.88 |
| CC | 0.16 | 0.02 | 0.56 | 0.39 | 0.25 | |
| RMSD | 1.75 | 140.10 | 31.12 | 45.61 | 2.26 | |
| CMCC-ESM2 | SD | 3.67 | 233.26 | 23.38 | 55.58 | 2.19 |
| CC | 0.14 | 0.18 | 0.45 | 0.21 | 0.17 | |
| RMSD | 3.87 | 240.12 | 33.15 | 65.96 | 2.91 | |
| EC-Earth3 | SD | 0.61 | 109.17 | 13.92 | 27.34 | 0.83 |
| CC | 0.31 | 0.78 | 0.90 | 0.77 | 0.31 | |
| RMSD | 1.67 | 72.82 | 24.26 | 33.26 | 2.21 | |
| GFDL-ESM4 | SD | 0.55 | 92.18 | 11.33 | 20.56 | 0.83 |
| CC | 0.40 | 0.49 | 0.80 | 0.45 | 0.35 | |
| RMSD | 1.62 | 105.80 | 27.94 | 44.27 | 2.17 | |
| INM-CM4-8 | SD | 0.47 | 72.06 | 6.12 | 26.00 | 0.91 |
| CC | -0.29 | -0.52 | -0.49 | -0.55 | 0.01 | |
| RMSD | 1.95 | 163.72 | 39.50 | 67.38 | 2.48 | |
表4 5个CMIP6单模式的定量化指标 S 值排名Table 4 Ranking of the quantitative indicator S values for five CMIP6 single models |
| 模式 | R50mm | R95p | RX1day | RX5day | SDII | 综合排名 |
|---|---|---|---|---|---|---|
| BCC-CSM2-MR | 3 | 4 | 3 | 3 | 3 | 3 |
| CMCC-ESM2 | 4 | 3 | 4 | 4 | 4 | 4 |
| EC-Earth3 | 2 | 1 | 1 | 1 | 2 | 1 |
| GFDL-ESM4 | 1 | 2 | 2 | 2 | 1 | 2 |
| INM-CM4-8 | 5 | 5 | 5 | 5 | 5 | 5 |
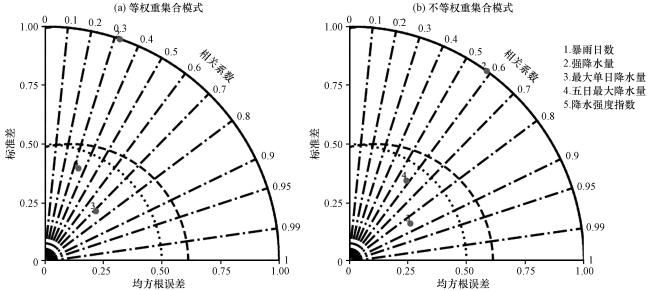
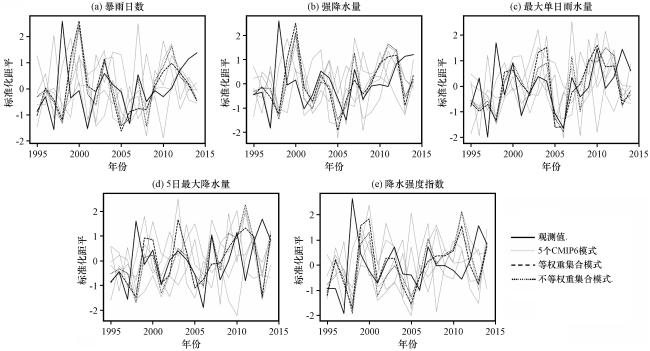
图3 川渝地区基准期暴雨日数(a, 单位: d)、 强降水量(b, 单位: mm)、 最大单日降水量(c, 单位: mm)、 5日最大降水量(d, 单位: mm)和降水强度指数(e, 单位: mm·d-1)的标准化距平序列Fig.3 The standardized anomaly series of the number of rainy days (a, unit: d), heavy precipitation (b, unit: mm), maximum daily precipitation (c, unit: mm), five-day maximum precipitation (d, unit: mm), and precipitation intensity index (e, unit: mm·d⁻¹) in the Sichuan-Chongqing region during the baseline period |
3.2 基准期5个极端降水指数的时空特征
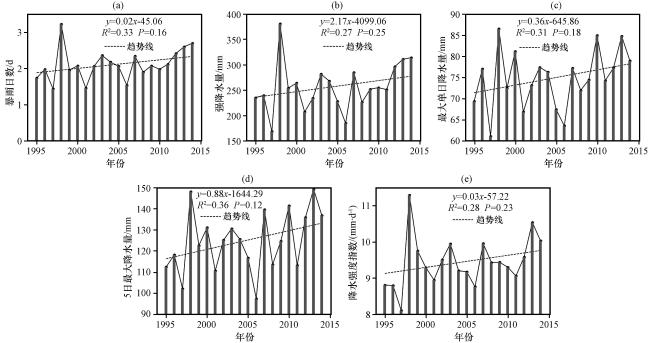
图4 1995-2014年川渝地区暴雨日数(a)、 强降水量(b)、 最大单日降水量(c)、 5日最大降水量(d)和降水强度指数(e)的时间序列Fig.4 The time series plots of the number of rainy days (a), heavy precipitation (b), maximum daily precipitation (c), five-day maximum precipitation (d), and precipitation intensity index (e) in the Sichuan-Chongqing region from 1995 to 2014 |
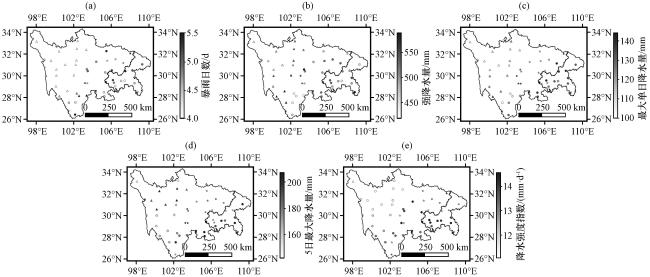
图5 1995 -2014年川渝地区暴雨日数(a, 单位: d)、 强降水量(b, 单位: mm)、 最大单日降水量(c, 单位: mm)、 5日最大降水量(d, 单位: mm)和降水强度指数(e, 单位: mm·d-1)的空间分布Fig.5 Spatial distribution maps of the number of rainy days (a, unit: d), heavy precipitation (b, unit: mm), maximum daily precipitation (c, unit: mm), five-day maximum precipitation (d, unit: mm), and precipitation intensity index (e, unit: mm·d⁻¹) in the Sichuan-Chongqing region from 1995 to 2014 |
3.3 未来两个时期5个极端降水指数的空间分布特征
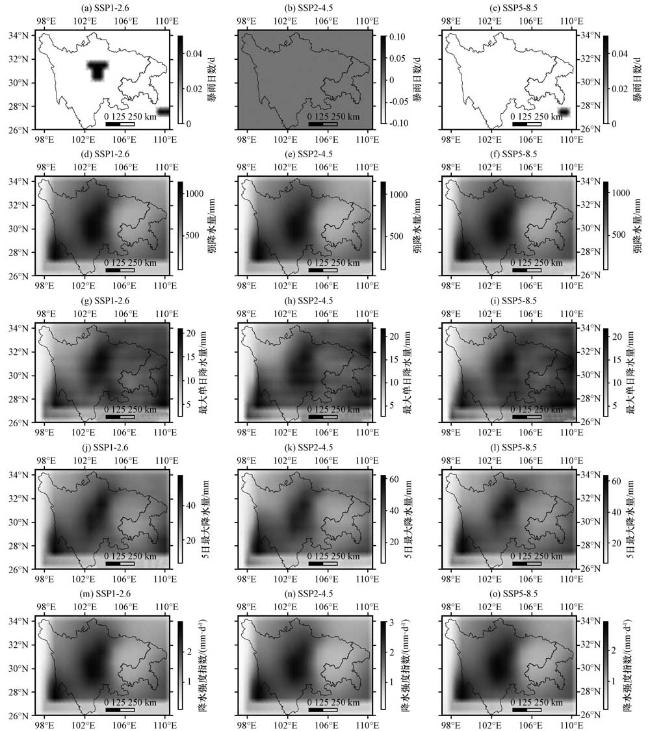
图6 未来近期川渝地区暴雨日数(a~c, 单位: d)、 强降水量(d~f, 单位: mm)、 最大单日降水量(g~i, 单位: mm)、 五日最大降水量(j~l, 单位: mm)和降水强度指数(m~o, 单位: mm·d-1)在三种不同气候变化情景下(SSP1-2.6, SSP2-4.5和SSP5-8.5)的空间分布Fig.6 The spatial distribution maps of the future near-term number of rainy days (a~c, unit: d), heavy precipitation (d~f, unit: mm), maximum daily precipitation (g~i, unit: mm), five-day maximum precipitation (j~l, unit: mm), and precipitation intensity index (m~o, unit: mm·d⁻¹) under three different climate change scenarios (SSP1-2.6, SSP2-4.5, and SSP5-8.5) in the Sichuan-Chongqing region |
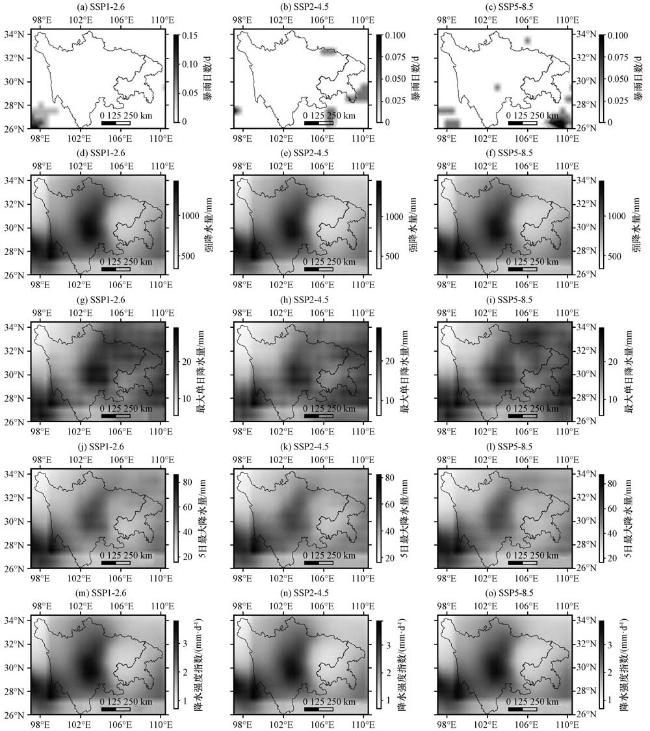
图7 未来远期川渝地区暴雨日数(a~c, 单位: d)、 强降水量(d~f, 单位: mm)、 最大单日降水量(g~i, 单位: mm)、 五日最大降水量(j~l, 单位: mm)和降水强度指数(m~o, 单位: mm·d-1)在三种不同气候变化情景下(SSP1-2.6, SSP2-4.5和SSP5-8.5)的空间分布Fig.7 The spatial distribution maps of the future long-term number of rainy days (a~c, unit: d), heavy precipitation (d~f, unit: mm), maximum daily precipitation (g~i, unit: mm), five-day maximum precipitation (j~l, unit: mm), and precipitation intensity index (m~o, unit: mm·d⁻¹) under three different climate change scenarios (SSP1-2.6, SSP2-4.5, and SSP5-8.5) in the Sichuan-Chongqing region |
3.4 暴雨洪涝灾害风险未来预估
3.4.1 致灾危险性风险预估
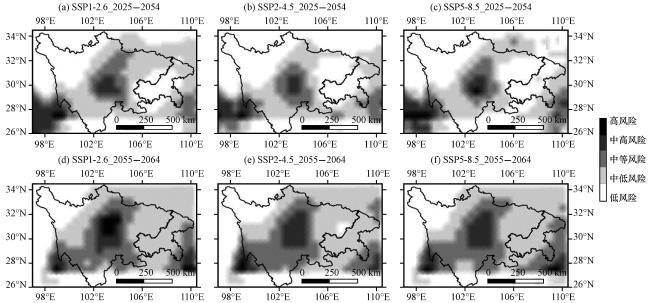
图8 川渝地区未来两个时期三种不同气候变化情景下暴雨洪涝致灾危险性空间分布(a) SSP1-2.6_2025-2054, (b) SSP2-4.5_2025-2054, (c) SSP5-8.5_2025-2054, (d) SSP1-2.6_2055-2064, (e)SSP2-4.5_2055-2064, (f)SSP5-8.5_2055-2064 Fig.8 The spatial distribution map of disaster risk caused by rainstorm and flood under three different climate change scenarios for the future two periods in the Sichuan-Chongqing region.(a) SSP1-2.6_2025-2054, (b) SSP2-4.5_2025-2054, (c) SSP5-8.5_2025-2054, (d) SSP1-2.6_2055-2064, (e) SSP2-4.5_2055-2064, (f) SSP5-8.5_2055-2064 |
3.4.2 承灾体易损度风险预估
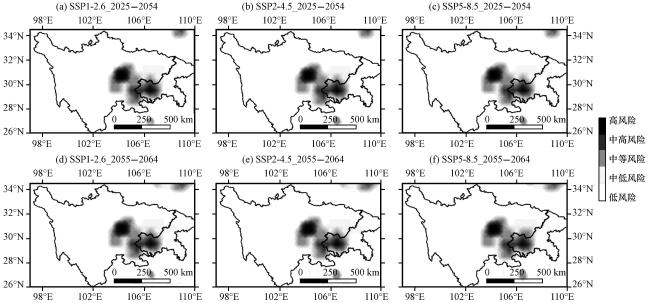
图9 川渝地区未来两个时期三种不同气候变化情景下承灾体易损度空间分布(a)SSP1-2.6_2025-2054, (b)SSP2-4.5_2025-2054, (c)SSP5-8.5_2025-2054, (d)SSP1-2.6_2055-2064, (e)SSP2-4.5_2055-2064, (f)SSP5-8.5_2055-2064 Fig.9 The spatial distribution map of vulnerability of disaster-bearing bodies under three different climate change scenarios for the future two periods in the Sichuan-Chongqing region.(a) SSP1-2.6_2025-2054, (b) SSP2-4.5_2025-2054, (c) SSP5-8.5_2025-2054, (d) SSP1-2.6_2055-2064, (e) SSP2-4.5_2055-2064, (f) SSP5-8.5_2055-2064 |
3.4.3 综合风险预估
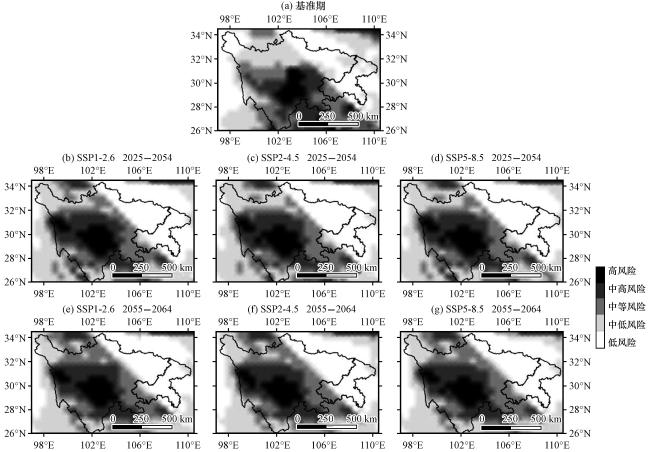
图10 川渝地区基准期(a)及未来两个时期三种不同气候变化情景下(b~g)暴雨洪涝灾害综合风险区划(a)基准期, (b)SSP1-2.6_2025-2054, (c)SSP2-4.5_2025-2054, (d)SSP5-8.5_2025-2054, (e)SSP1-2.6_2055-2064, (f)SSP2-4.5_2055-2064, (g)SSP5-8.5_2055-2064 Fig.10 The comprehensive risk zoning map of rainstorm and flood disasters under the baseline period (a) and three different climate change scenarios for the future two periods (b~g) in the Sichuan-Chongqing region.(a) baseline period, (b) SSP1-2.6_2025-2054, (c) SSP2-4.5_2025-2054, (d) SSP5-8.5_2025-2054, (e) SSP1-2.6_2055-2064, (f) SSP2-4.5_2055-2064, (g) SSP5-8.5_2055-2064 |