
1 引 言
2 材料来源与方法介绍
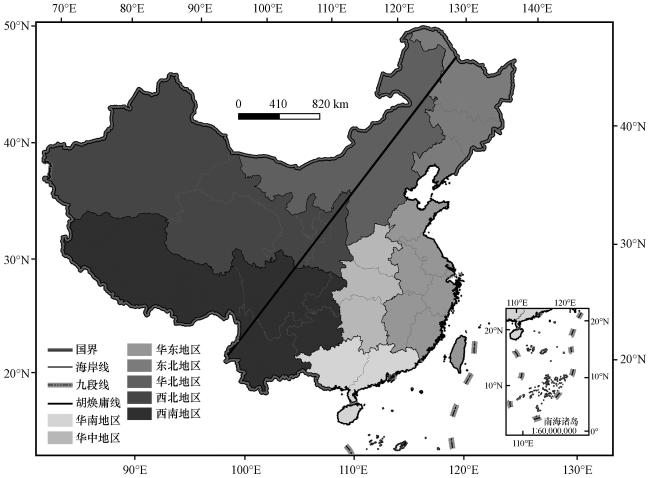
2.1 研究区与数据资料
2.2 降水-风速复合极端事件判定
2.3 方法说明
2.3.1 趋势分析
2.3.2 空间自相关分析
2.3.3 合成分析
3 结果
3.1 PWEs时空分布特征
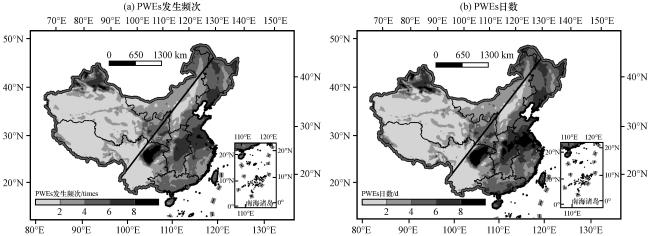
表1 不同分区PWEs发生频次和PWEs日数的区域均值及不同值域面积占比Table 1 The regional average value and the area proportions of different intervals of frequency and days of PWEs in different regions |
| 物理量 | 区域 | ||||||||
|---|---|---|---|---|---|---|---|---|---|
| 西北 | 华北 | 东北 | 华东 | 华南 | 华中 | 西南 | |||
| PWEs发生频次 | 多年平均值/次 | 2.6 | 3.2 | 5.4 | 5.5 | 4.6 | 5.2 | 2.1 | |
| 面积占比/% | <2 | 52.7 | 20.0 | 0.0 | 0.0 | 1.9 | 0.8 | 66.0 | |
| 2~4 | 25.2 | 53.0 | 13.1 | 17.3 | 30.2 | 24.5 | 19.7 | ||
| 4~6 | 14.6 | 25.5 | 57.5 | 44.8 | 58.2 | 42.6 | 6.8 | ||
| 6~8 | 6.3 | 1.5 | 27.3 | 34.1 | 8.1 | 31.8 | 3.1 | ||
| >8 | 1.2 | 0.0 | 2.1 | 3.8 | 1.6 | 0.3 | 4.4 | ||
| PWEs日数 | 多年平均值/d | 2.7 | 3.4 | 5.7 | 6.2 | 5.3 | 5.7 | 2.3 | |
| 面积占比/% | <2 | 51.5 | 18.7 | 0.0 | 0.0 | 1.1 | 0.7 | 64.1 | |
| 2~4 | 25.1 | 50.0 | 8.1 | 9.5 | 24.6 | 21.6 | 19.8 | ||
| 4~6 | 14.7 | 24.1 | 52.5 | 41.2 | 47.2 | 33.8 | 7.6 | ||
| 6~8 | 6.9 | 7.2 | 35.6 | 30.3 | 20.0 | 33.5 | 3.2 | ||
| >8 | 1.8 | 0.0 | 3.8 | 19.0 | 7.1 | 10.4 | 5.3 | ||
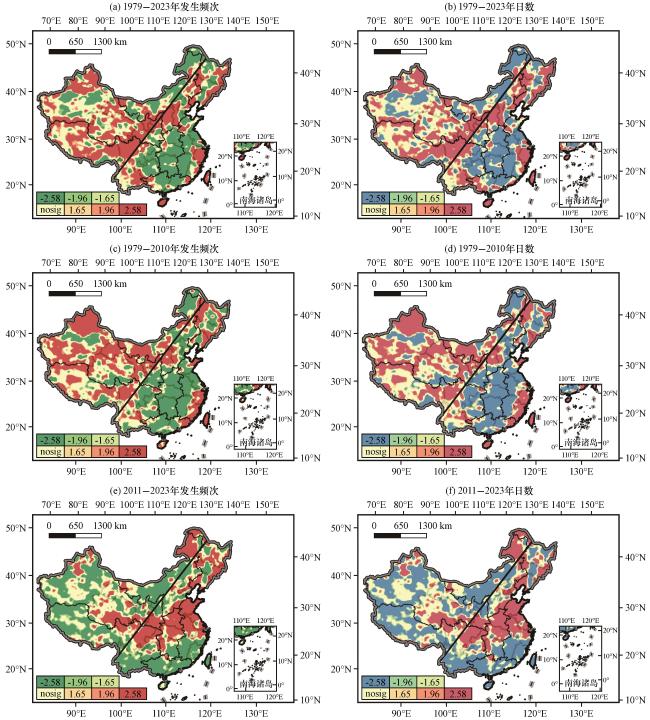
3.2 PWEs空间变化聚类格局
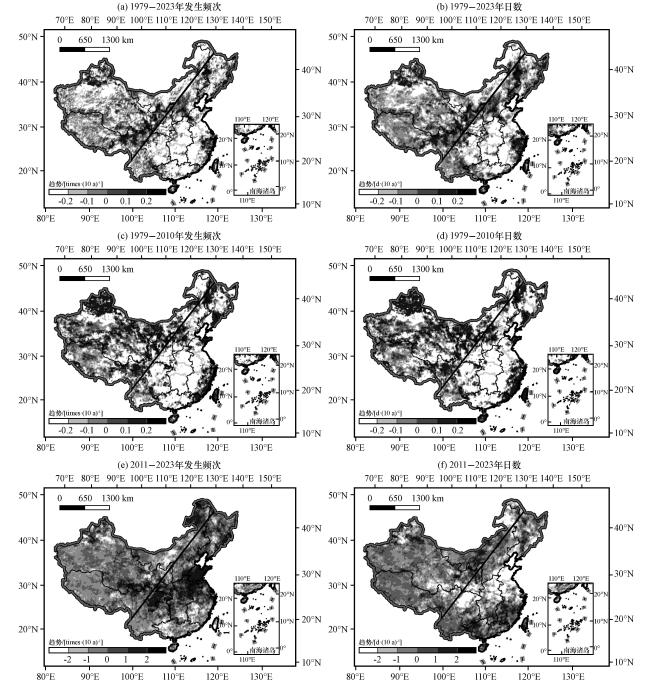
表2 不同分区不同阶段PWEs发生频次及PWEs日数的趋势变化及上升趋势面积占比Table 2 The trends and the area proportion with upward trends of PWEs frequency and days in different regions during different periods |
| 物理量 | 时间段 | 区域 | ||||||
|---|---|---|---|---|---|---|---|---|
| 西北 | 华北 | 东北 | 华东 | 华南 | 华中 | 西南 | ||
| PWEs发生频次趋势 /[times·(10a)-1] | 1979 -2023年 | -0.05 | -0.12 | -0.06 | -0.18 | -0.15 | -0.30* | -0.05* |
| 1979 -2010年 | 0.01 | -0.08 | -0.05 | -0.23 | -0.25 | -0.60* | -0.11* | |
| 2011 -2023年 | 0.14 | 0.18 | 0.70 | 0.96 | -0.81 | 1.01 | 0.15 | |
| PWEs日数 /[d·(10a)-1] | 1979 -2023年 | -0.05 | -0.12 | -0.03 | -0.15 | -0.10 | -0.32* | -0.05* |
| 1979 -2010年 | 0.01 | -0.10 | -0.09 | -0.16 | -0.24 | -0.63* | -0.11* | |
| 2011 -2023年 | 0.14 | 0.33 | 0.67 | 1.12 | -0.77 | 1.15 | 0.19 | |
| PWEs发生频次 上升趋势/% | 1979 -2023年 | 34.74 | 26.93 | 36.36 | 24.23 | 24.40 | 6.63 | 35.88 |
| 1979 -2010年 | 50.90 | 39.65 | 42.27 | 32.59 | 23.04 | 3.07 | 35.91 | |
| 2011 -2023年 | 54.62 | 54.60 | 73.48 | 61.77 | 20.50 | 78.04 | 44.12 | |
| PWEs日数 上升趋势/% | 1979 -2023年 | 35.11 | 29.33 | 44.40 | 29.88 | 34.16 | 6.68 | 36.88 |
| 1979 -2010年 | 50.90 | 38.83 | 38.51 | 36.53 | 26.87 | 3.03 | 37.33 | |
| 2011 -2023年 | 54.44 | 57.75 | 68.26 | 60.95 | 27.98 | 78.48 | 44.51 | |
*代表趋势达到0.1的显著性水平(* indicate the trends passing the 0.1 significance level) |
表3 PWEs发生频次及PWEs日数的全局自相关特征Table 3 Global Moran's I results of frequency and days of PWEs |
| 物理量 | 时间段 | 全局自相关参数 | ||
|---|---|---|---|---|
| Moran's Index | z-score | p-value | ||
| PWEs发生频次趋势 | 1979-2023年 | 0.834551 | 1248.912197 | 0.000000 |
| 1979-2010年 | 0.836913 | 1252.450239 | 0.000000 | |
| 2011-2023年 | 0.86.355 | 1287.525781 | 0.000000 | |
| PWEs日数趋势 | 1979-2023年 | 0.845062 | 1264.647273 | 0.000000 |
| 1979-2010年 | 0.832924 | 1246.492749 | 0.000000 | |
| 2011-2023年 | 0.867989 | 1298.952064 | 0.000000 | |
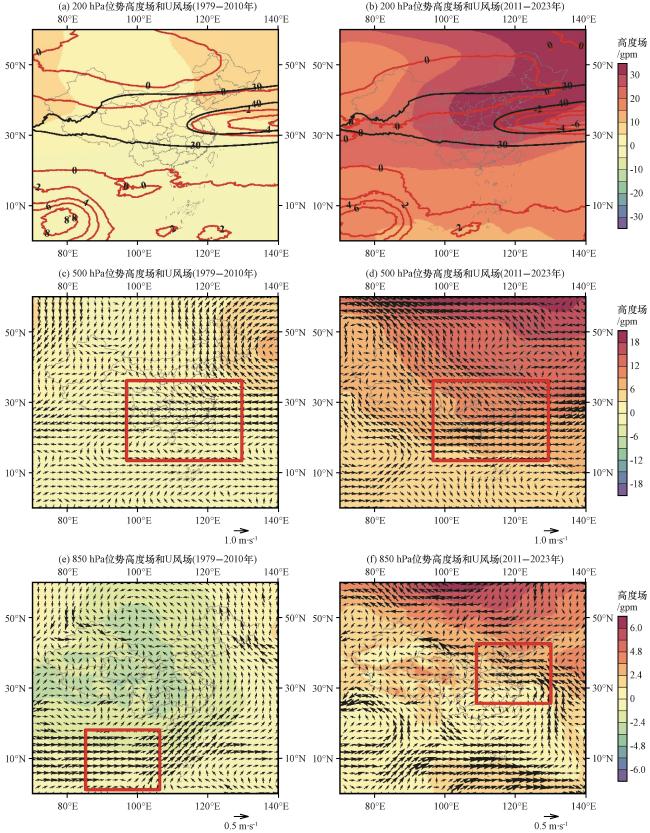
3.3 PWEs大尺度环流特征
图6 1979 -2010年(a)、 2011 -2023年(b)200 hPa高度场(色阶, 单位: gpm)和U风场(红色等值线, 单位: m·s-1), 1979 -2010年(c, e)、 2011 -2023年(d, f)500 hPa(c, d)和850 hPa(e, f)高度场(色阶, 单位: gpm)和风场(矢量, 单位: m·s-1)图中所绘均通过95%置信水平, (a)和(b)中的黑色等值线为200 hPa U风场的气候态(U风≥30 m·s-1) Fig.6 Geopotential height (color scale, unit: gpm) and horizonal wind (red contour, unit: m·s-1) at 200 hPa between 1979 -2010 (a) and 2011 -2023 (b), respectively.Geopotential height (color scale, unit: gpm) and wind field (vector, unit: m·s-1) at 500 hPa (c, d)and 850 hPa(e, f) between 1979 -2010 (c, e) and 2011 -2023 (d, f), respectively.All depicted in the figure have passed the 95% confidence level, the black line in (a) and (b) is the climate state of zonal wind at 200 hPa (U wind ≥30 m·s-1) |