
1 引言
2 资料来源和方法介绍
2.1 数据与质控
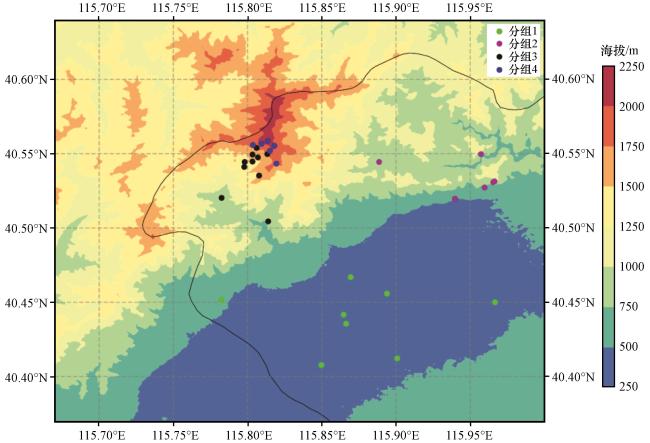
图1 研究区域海拔(彩色区, 单位: m)、 自动气象站分布(圆点)以及K-Means聚类分组结果绿色、 紫色、 黑色和蓝色点分别表示延庆低海拔远郊(分组1)、 东北山麓过渡(分组2)、 西南过渡(分组3)和高海拔山顶(分组4) Fig.1 The distribution of elevation (color shaded, unit: m), automatic weather stations (dots), and the K-means clustering results in the study area.The green, purple, black, and blue dots correspond to low-elevation Yanqing suburb area (Group 1), northeastern foothills transition area (Group 2), southwestern transition area (Group 3), and high-elevation mountain top area (Group 4), respectively |
2.2 站点聚类划分
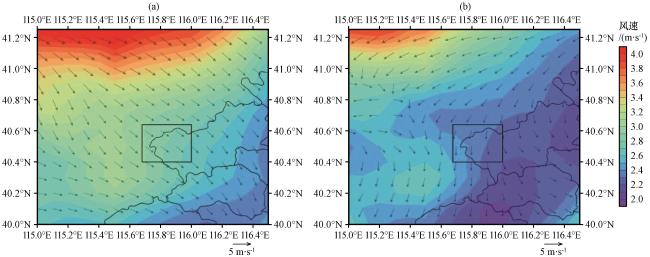
图2 冬季(a)和早春(b)地面10 m风场平均态填色和矢量表示平均风速(单位: m·s-1)和风向, 黑框区域为本文研究区域(即图1区域), 采用数据为REA5-Land再分析资料 Fig.2 Winter (a) and early spring (b) surface 10 m averaged wind field.The colored shades and vectors represent the wind speed (unit: m·s-1) and direction.The area in the black box is the research area in this paper (i.e., the scope of Fig.1), and the data used is the REA5-Land reanalysis data |
2.3 频率计算方法
表1 本研究采用的风力等级划分表Table 1 Wind grade table used in this study |
| 划分等级 | 风速/(m·s-1) | 描述 |
|---|---|---|
| 1 | [0, 1.5) | 软风 |
| 2 | [1.5, 3.3) | 轻风 |
| 3 | [3.3, 5.4) | 微风 |
| 4 | [5.4, 7.9) | 和风 |
| 5 | [7.9, 10.7) | 清劲风 |
| 6 | [10.7, 13.8) | 强风 |
| 7 | >=13.8 | 疾风 |
表2 风向符号与中心度数对照表Table 2 Comparison between wind direction symbols and central angles |
| 风向 | 北 | 北东北 | 东北 | 东东北 | 东 | 东东南 | 东南 | 南东南 | 南 | 南西南 | 西南 | 西西南 | 西 | 西西北 | 西北 | 北西北 |
|---|---|---|---|---|---|---|---|---|---|---|---|---|---|---|---|---|
| 符号 | N | NNE | NE | ENE | E | ESE | SE | SSE | S | SSW | SW | WSW | W | WNW | NW | NNW |
| 中心度数/(°) | 0 | 22.5 | 45 | 67.5 | 90 | 112.5 | 135 | 157.5 | 180 | 202.5 | 225 | 247.5 | 270 | 292.5 | 315 | 337.5 |
3 风场精细化特征对比结果
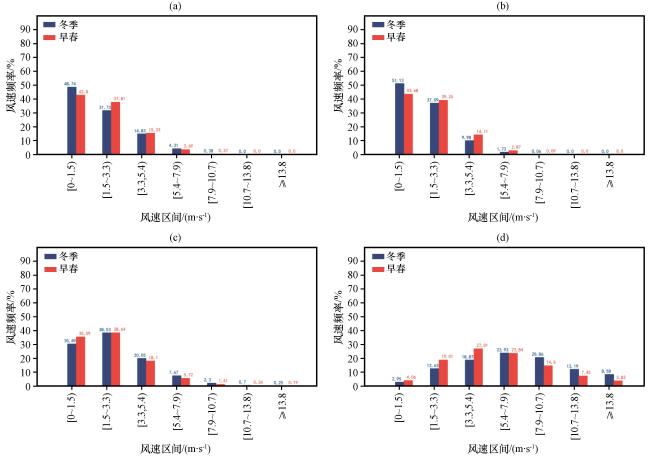
3.1 冬季和早春风速等级频率特征
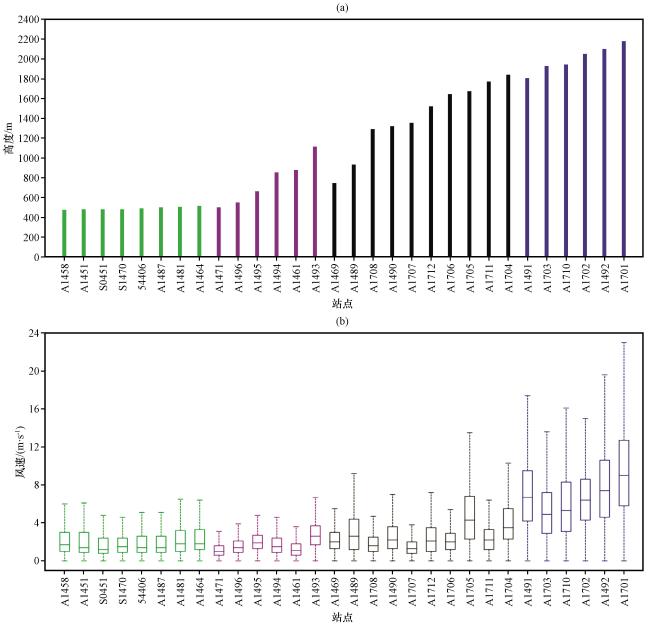
图3 基于聚类算法的各个分组站点海拔(a)和风速盒须图(b)横坐标为站点号, (b)中上须和下须分别表示风速最大值和最小值, 方框的上、 下边界和中线分别代表风速从小到大排列的上、 下四分位数和中位数 Fig.3 Station altitude (a) and wind speed box plot (b) for each group based on cluster grouping.In (b), the upper and lower whiskers represent the maximum and minimum wind speeds, and the upper boundary, lower boundary and the median line of the box represent the upper quantiles, lower quantiles and the median of the wind speeds |
3.2 冬季和早春风向频率特征
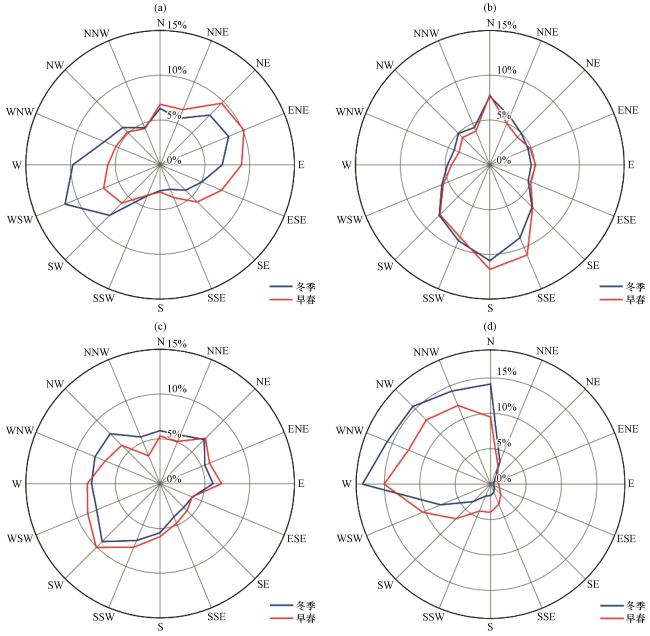
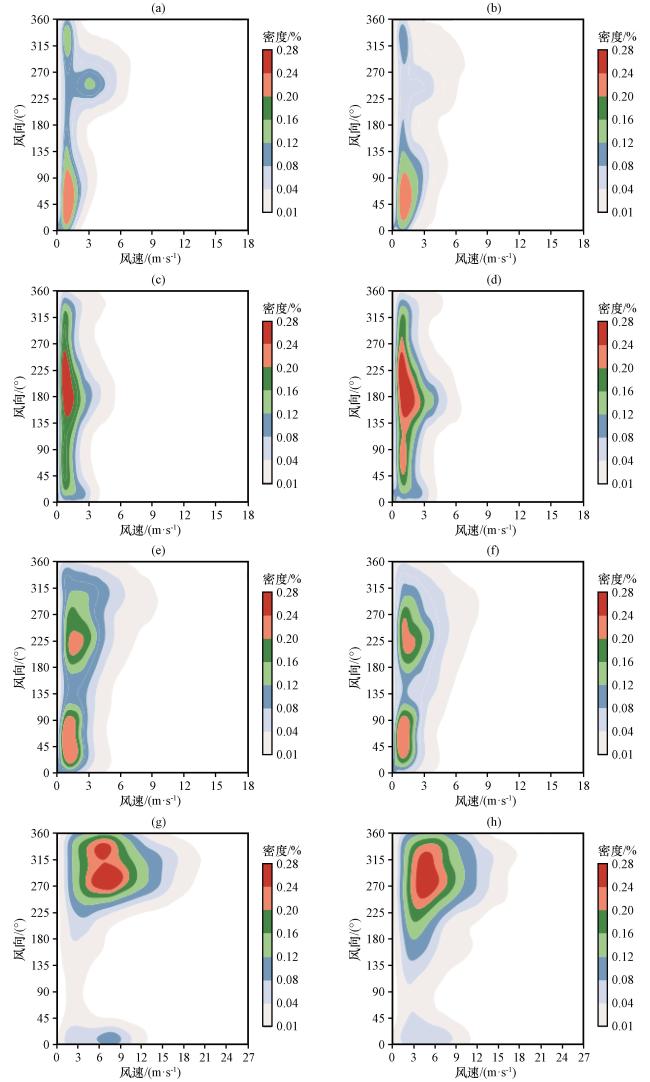
图6 各个分组冬季(左)和早春(右)风速风向二维核密度图(单位: %)(a~b)、 (c~d)、 (e~f)、 (g~h)表示分组1~4 Fig.6 Two-dimensional kernel density (unit: %)plots of wind speed and wind direction for each group in winter (right column) and early spring (left column).(a~b)、 (c~d)、 (e~f)、 (g~h) present Group 1~4, respectively |
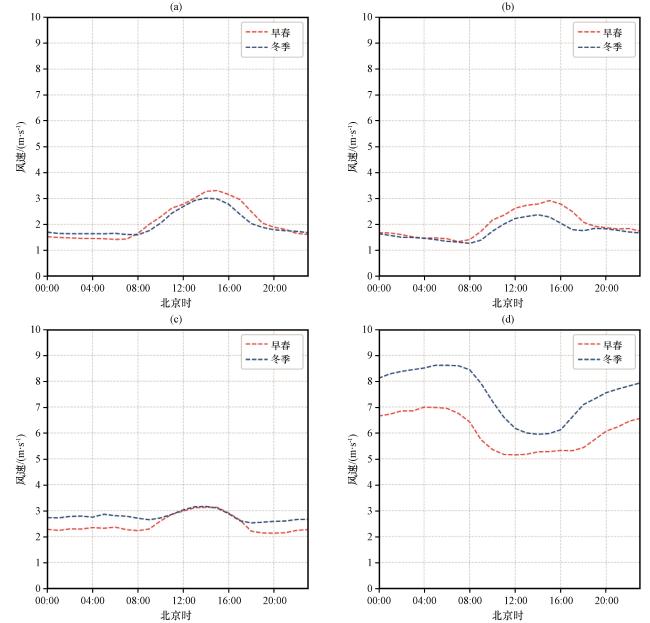
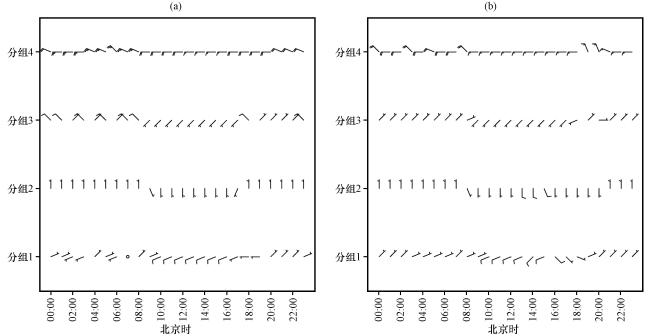
3.3 风场日变化特征对比分析
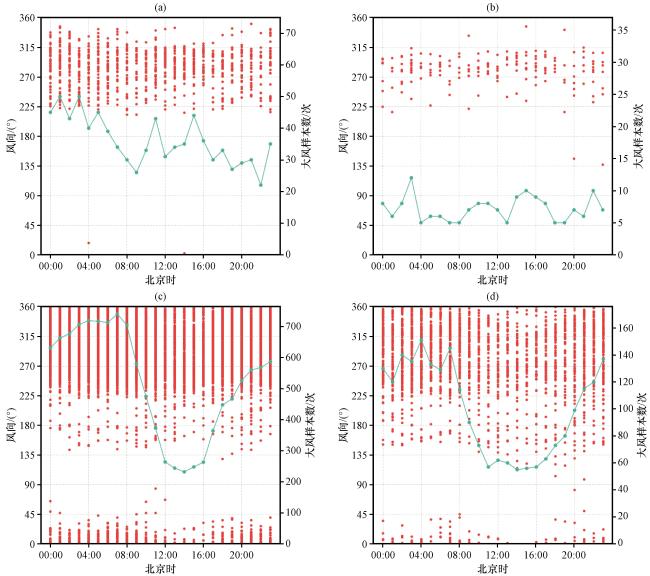
图9 组3(a, b)和组4(c, d)冬季(左)和早春(右)大风日变化散点分布红点为风向[单位: (°)], 绿线为大风样本数(单位: 次) Fig.9 Scatter plots of diurnal variation in strong winds for Groups 3 (a, b) and Group 4 (c, d) in winter (right column) and early spring (left column).The red dots represent the wind directions [unit: (°)], and the green lines represent the number of strong wind samples (unit: number of occurrences) |