
1 引言
2 资料来源与方法介绍
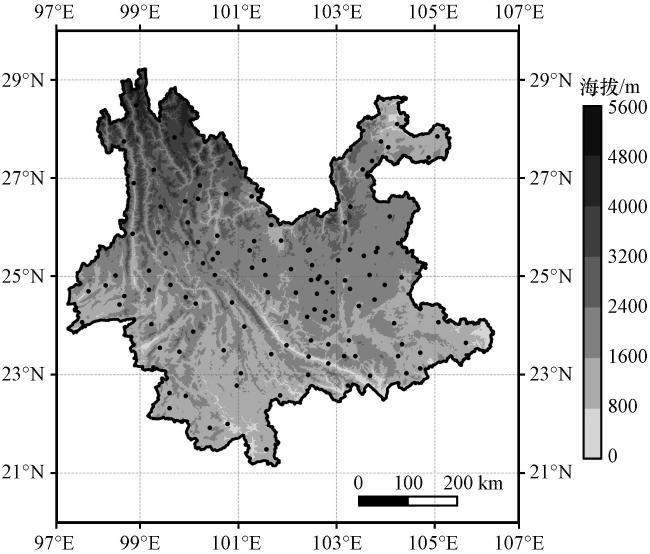
2.1 数据来源
2.2 方法介绍
2.2.1 风险阈值及年变化
2.2.2 四要素危险权重
表1 四类气象要素评价指标对比赋值结果Table 1 Comparative assigned results of evaluation indicators from four meteorological factors |
| 对比赋值 | 短时强降水 | 大风 | 低云 | 低能见度 |
|---|---|---|---|---|
| 短时强降水 | 1 | 2 | 3 | 4 |
| 大风 | 0.5 | 1 | 2 | 3 |
| 低云 | 0.3333 | 0.5 | 1 | 2 |
| 低能见度 | 0.25 | 0.3333 | 0.5 | 1 |
2.2.3 航空安全判断
3 结果分析
3.1 四要素季节变化特征
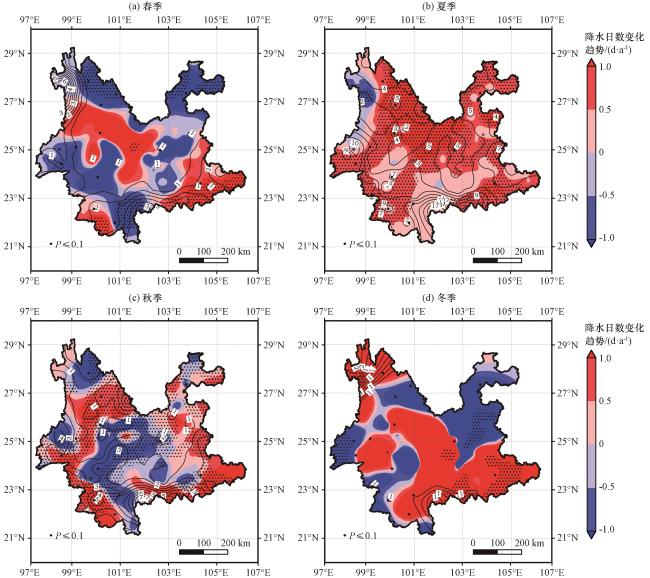
图2 2010 -2021年云南四季平均短时强降水日数(等值线, 单位: d)及其变化趋势(彩色区, 单位: d·a-1)的空间分布黑点区域表示通过0.1显著性水平检验 Fig.2 Spatial distribution of the average number of short-time severe precipitation days (contour, unit: d) and its trends (color area, unit: d·a-1) in Yunnan Province in four seasons from 2010 to 2021.The black dot area has passed the significance test at 0.1 level |
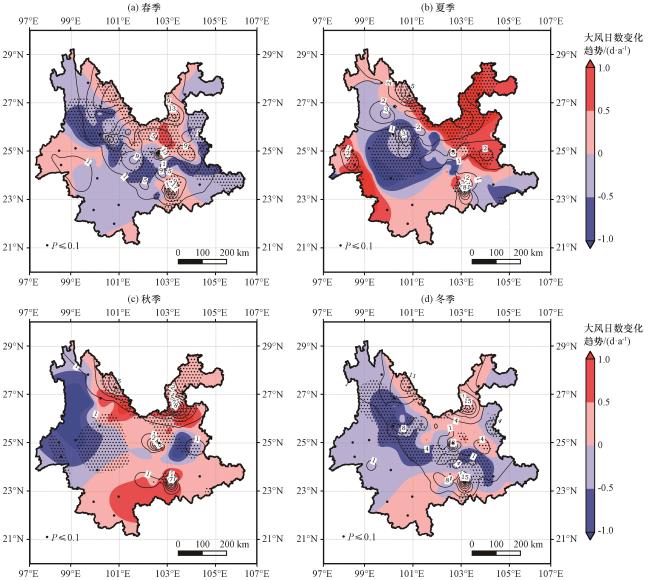
图3 2010 -2021年四季平均云南地区大风日数(等值线, 单位: d)及其变化趋势(彩色区, 单位: d·a-1)的空间分布黑点区域表示通过0.1显著性水平检验 Fig.3 Spatial distribution of the average number of windy days (contour, unit: d) and its trend (color area, unit: d·a-1) in Yunnan Province in four seasons from 2010 to 2021.The black dot area has passed the significance test at 0.1 level |
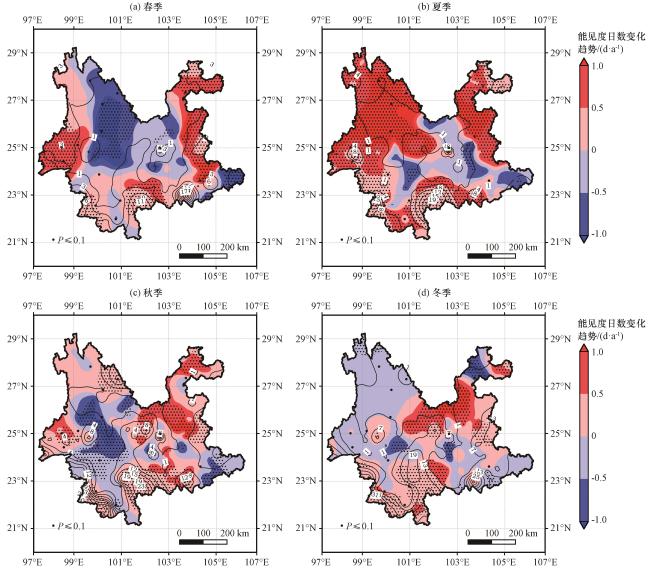
图4 2010 -2021年四季平均云南地区低能见度日数(等值线, 单位: d)及其变化趋势(彩色区, 单位: d·a-1)的空间分布黑点区域表示通过0.1显著性水平检验 Fig.4 The spatial distribution of average low visibility days (contour, unit: d) and its trend (color area, unit: d·a-1) in Yunnan Province in four seasons from 2010 to 2021.The black dot area has passed the significance test at 0.1 level |
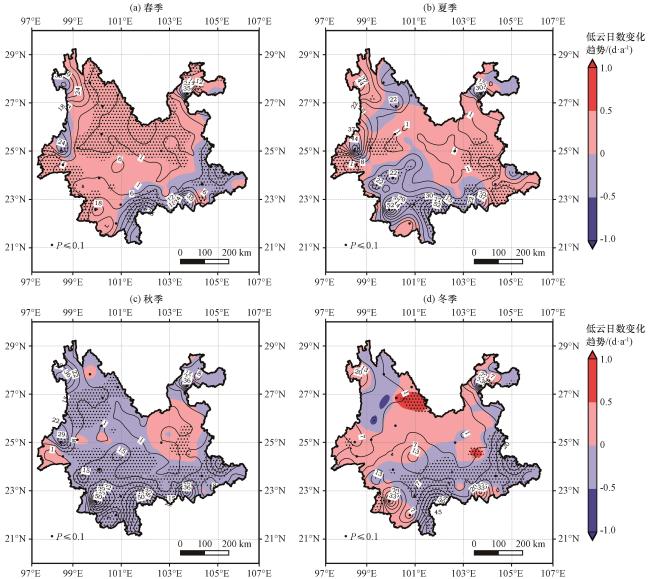
图5 2010 -2021年四季平均云南地区低云日数(等值线, 单位: d)及其变化趋势 (彩色区, 单位: d·a-1)的空间分布黑点区域表示通过0.1显著性水平检验 Fig.5 Spatial distribution of the average number of low cloud base height days (contour, unit: d) and its trend (color area, unit: d·a-1) in Yunnan province in four seasons from 2010 to 2021.The black dot area has passed the significance test at 0.1 level |
3.2 典型季节要素变化特征
3.3 航空安全运行分析
表2 各机场四要素危险权重及 “搭配”日数Table 2 Four-factor risk weights and "matching" days for each airport |
| 地区 | 危险权重 | 共同发生事件日数 | ||||||
|---|---|---|---|---|---|---|---|---|
| 短时强 降水 | 大风 | 低能 见度 | 低云 | 短时强降水 +低云 | 短时强降水+低能 见度+低云 | 短时强降水+ 大风+低云 | 危险 日数 | |
| 保山 | 0.79 | 0.03 | 0.03 | 0.15 | 24 | 0 | 0 | 0 |
| 沧源 | 0.45 | 0.01 | 0.44 | 0.10 | 11 | 2 | 0 | 2 |
| 大理 | 0.59 | 0.38 | 0.02 | 0.01 | 3 | 0 | 0 | 0 |
| 德宏 | 0.86 | 0.00 | 0.08 | 0.05 | 2 | 0 | 0 | 0 |
| 迪庆 | 0.27 | 0.42 | 0.05 | 0.26 | 5 | 1 | 0 | 1 |
| 昆明 | 0.59 | 0.35 | 0.03 | 0.04 | 8 | 0 | 0 | 0 |
| 澜沧 | 0.19 | 0.00 | 0.02 | 0.79 | 172 | 13 | 0 | 13 |
| 丽江 | 0.23 | 0.36 | 0.00 | 0.41 | 92 | 1 | 0 | 1 |
| 临沧 | 0.37 | 0.00 | 0.03 | 0.60 | 105 | 3 | 0 | 3 |
| 宁蒗 | 0.14 | 0.67 | 0.09 | 0.10 | 7 | 0 | 0 | 0 |
| 普洱 | 0.43 | 0.00 | 0.05 | 0.52 | 149 | 4 | 0 | 4 |
| 腾冲 | 0.27 | 0.00 | 0.05 | 0.68 | 204 | 14 | 1 | 15 |
| 文山 | 0.26 | 0.11 | 0.12 | 0.51 | 98 | 2 | 0 | 2 |
| 西双版纳 | 0.92 | 0.00 | 0.06 | 0.01 | 0 | 0 | 0 | 0 |
| 昭通 | 0.08 | 0.00 | 0.02 | 0.90 | 68 | 3 | 0 | 3 |
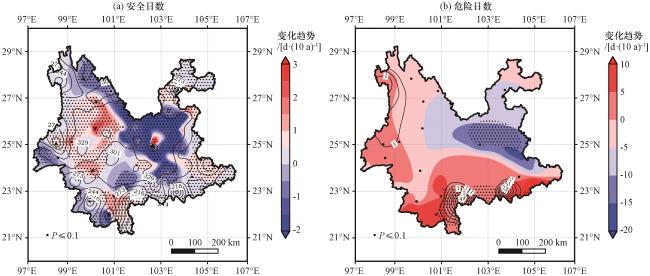
图9 2010 -2021年云南年均安全日数(a)和年均危险日数(b)(等值线, 单位: d)及变化趋势 [彩色区, 单位: d·(10a)-1]黑点区域表示通过0.1显著性水平检验 Fig.9 Spatial distribution (contour, unit: d) and temporal trends [color area, unit: d·(10a)-1] of annual average safe days (a) and dangerous days (b) in Yunnan from 2010 to 2021.The black dot area has passed the significance test at 0.1 level |