
1 引言
2 研究区、 数据来源与方法介绍
2.1 研究区概况
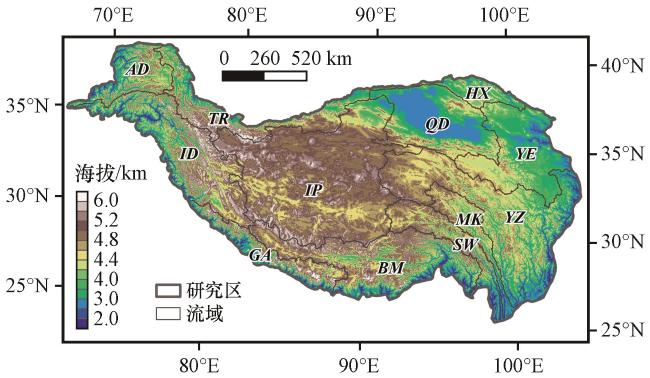
图1 青藏高原海拔和流域分布Fig.1 Elevation and watershed distribution on the Qinghai-Xizang (Tibetan) Plateau |
表1 青藏高原流域信息Table 1 The Information of the Qinghai-Xizang (Tibetan) Plateau Basin |
| 序号 | 代码 | 流域 |
|---|---|---|
| 1 | YZ | 长江流域 |
| 2 | YE | 黄河流域 |
| 3 | HX | 黑河流域 |
| 4 | QD | 柴达木盆地 |
| 5 | MK | 湄公河流域 |
| 6 | SW | 怒江流域 |
| 7 | BM | 雅鲁藏布江流域 |
| 8 | GA | 恒河流域 |
| 9 | AD | 阿姆河流域 |
| 10 | ID | 印度河流域 |
| 11 | TR | 塔里木盆地 |
| 12 | IP | 高原内陆流域 |
2.2 研究数据
2.3 研究方法
3 结果与分析
3.1 雪深时空变化特征
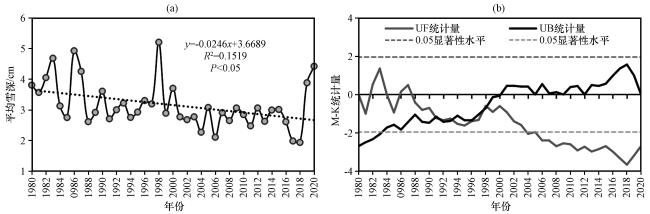
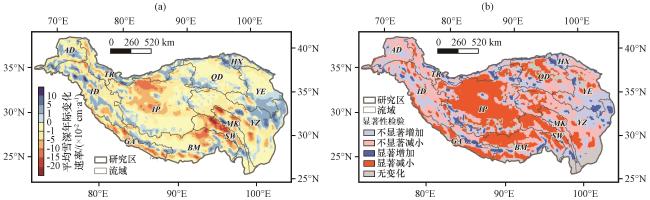
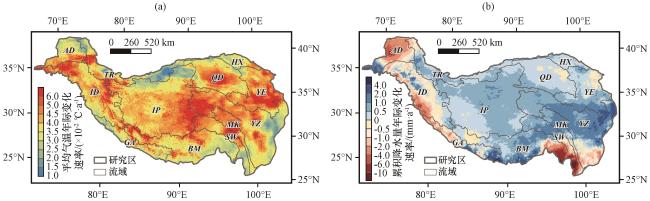
图4 1980 -2020年积雪季青藏高原年均雪深变化趋势(a)及其显著性检验(b)空间分布Fig.4 Spatial distribution of trends in mean annual snow depth (a) and its significance test (b) on the Qinghai-Xizang (Tibetan) Plateau during the snow season from 1980 to 2020 |
表2 1980 -2020年积雪季青藏高原平均雪深年际变化速率及其显著性检验统计Table 2 Interannual variation rate of average snow depth and its significance test statistics on the Qinghai-Xizang (Tibetan) Plateau during the snow season from 1980 to 2020 |
| 流域 | 平均年际变化速率/[cm·(10a)-1] | 面积百分比/% | ||||
|---|---|---|---|---|---|---|
| 不显著减小 | 显著减小 | 不显著增加 | 显著增加 | 不变 | ||
| AD | -0.04 | 55.87 | 2.02 | 40.87 | 1.24 | 0.00 |
| BM | -0.26 | 31.72 | 41.24 | 11.31 | 5.81 | 9.92 |
| GA | -0.41 | 33.63 | 43.98 | 7.23 | 6.96 | 8.21 |
| HX | 0.13 | 31.03 | 0.00 | 49.22 | 19.75 | 0.00 |
| ID | -0.10 | 51.05 | 13.48 | 32.49 | 2.91 | 0.06 |
| IP | -0.26 | 21.61 | 56.37 | 11.58 | 4.88 | 5.56 |
| MK | -0.39 | 52.34 | 24.77 | 11.21 | 2.45 | 9.23 |
| QD | -0.03 | 33.02 | 24.28 | 22.88 | 4.62 | 15.19 |
| SW | -0.53 | 26.16 | 47.20 | 9.99 | 4.06 | 12.59 |
| TR | -0.06 | 41.84 | 11.20 | 33.75 | 12.60 | 0.62 |
| YE | 0.02 | 40.52 | 8.44 | 37.76 | 7.17 | 6.11 |
| YZ | -0.06 | 40.19 | 15.61 | 29.38 | 3.35 | 11.47 |
| TP | -0.25 | 35.66 | 29.09 | 22.87 | 5.34 | 7.05 |
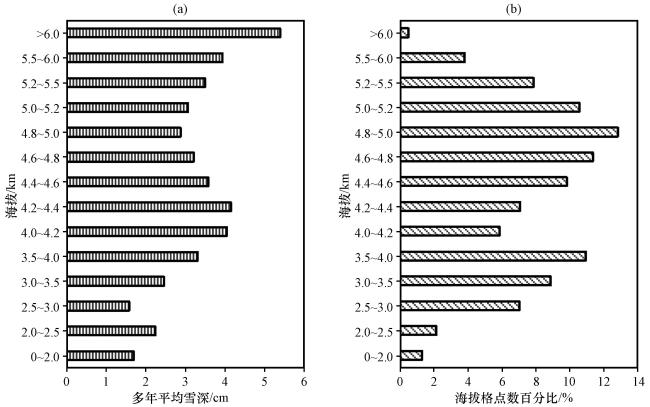
3.2 雪深海拔分异
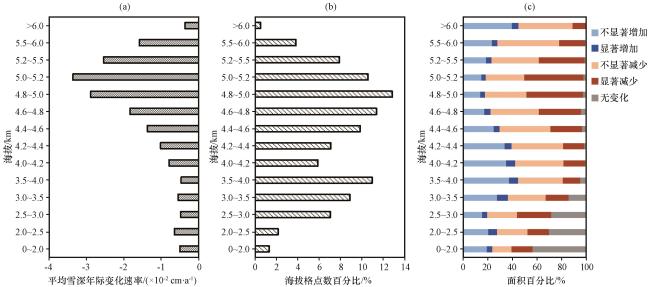
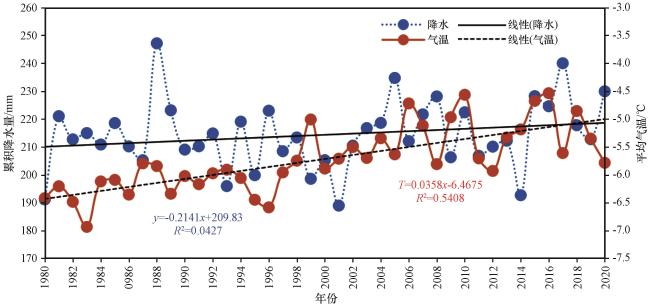
3.3 雪深对气候变化的响应
表3 1980 -2020年积雪季青藏高原平均雪深、 气温、 降水量及其年际变化速率的流域差异Table 3 Basin differences in average snow depth, temperature, precipitation, and their interannual variation rates on the Qinghai-Xizang (Tibetan) Plateau during the snow season from 1980 to 2020 |
| 流域 | 流域名称 | 雪深 | 气温 | 降水 | |||||
|---|---|---|---|---|---|---|---|---|---|
| 平均雪深/cm | 雪深变化趋势/[cm·(10a)-1] | 平均气温/℃ | 气温变化趋势/[℃·(10a)-1] | 平均降水量/mm | 降水量变化趋势/(mm·a-1) | ||||
| | | | | | | | | ||
| | | | | | | | | ||
| | | | | | | | | ||
| | | | | | | | | ||
| | | | | | | | | ||
| | | | | | | | | ||
| | | | | | | | | ||
| | | | | | | | | ||
| | | | | | | | | ||
| | | | | | | | | ||
| | | | | | | | | ||
| | | | | | | | | ||
红色表示气候暖干化导致雪深减小, 蓝色表示气候暖湿化导致雪深减小, 绿色表示气候暖湿化导致雪深增加 (The red font indicates that the warm and dry climate leads to the decrease of snow depth, the blue indicates that the warm and wet climate leads to the decrease of snow depth, and the green indicates that the warm and wet climate leads to the increase of snow depth) |
表4 1980 -2020年积雪季青藏高原平均雪深、 气温、 降水量及其年际变化速率的海拔差异Table 4 Elevation differences in average snow depth, temperature, precipitation, and their interannual variation rates on the Tibetan Plateau during the snow season from 1980 to 2020 |
| 海拔/km | 雪深 | 气温 | 降水 | |||||
|---|---|---|---|---|---|---|---|---|
| 平均雪深/cm | 雪深变化趋势/[cm·(10a)-1] | 平均气温/℃ | 气温变化趋势/[℃·(10a)-1] | 平均降水量/mm | 降水量变化趋势/(mm·a-1) | |||
| | | | | | | | ||
| | | | | | | | ||
| | | | | | | | ||
| | | | | | | | ||
| | | | | | | | ||
| | | | | | | | ||
| | | | | | | | ||
| | | | | | | | ||
| | | | | | | | ||
| | | | | | | | ||
| | | | | | | | ||
| | | | | | | | ||
| | | | | | | | ||
| | | | | | | | ||
红色表示气候暖干化导致雪深减小, 蓝色表示气候暖湿化导致雪深减小, 蓝色越深表明受气温影响越大(The red font signifies a warm and dry climate, leading to decreased snow depth.The blue font signifies a warm and humid climate, also resulting in reduced snow depth.Darker shades of blue indicate a more pronounced impact of temperature on these conditions) |