
1 引言
2 研究区域、 数据和方法介绍
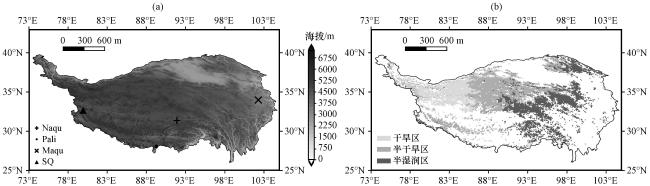
2.1 研究区域概况
2.2 数据介绍
2.3 研究方法
2.3.1 模式及实验设计
2.3.2 冻融参量的计算
2.3.3 高原气候分区
2.3.4 高原干湿季划分
3 研究结果
3.1 模拟结果的检验
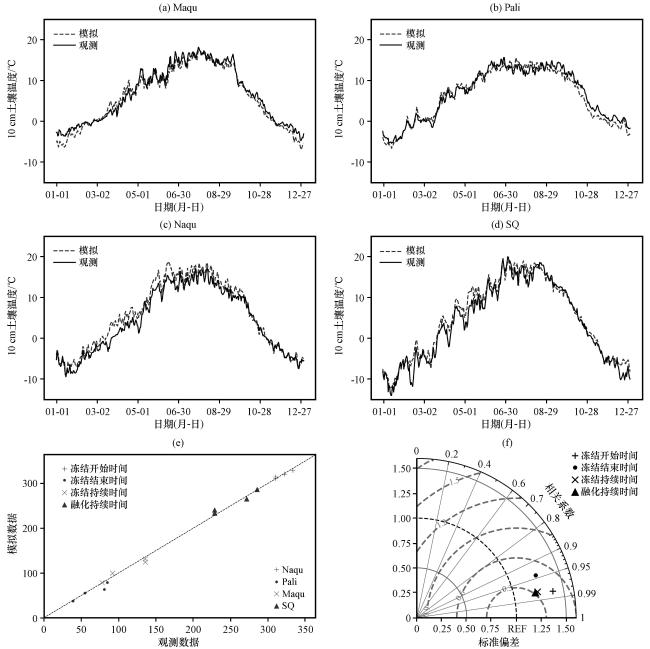
图2 2012年Naqu (a)、 2016 -2017年Pali (b)、 2009 -2010年Maqu (c)、 2017年SQ(d)的模拟和观测的土壤温度变化以及模拟冻结开始时间、 冻结结束时间、 冻结持续时间、 融化持续时间与0.1 m土壤深度原位观测分析(e)和泰勒图(f)(f)泰勒图中灰色虚线为标准化的中心化均方根误差 Fig.2 Simulated and observed soil temperature variations at Naqu in 2012 (a), Pali from 2016 to 2017 (b), Maqu from 2009 to 2010 (c), and SQ in 2017 (d), along with the analysis of simulated freeze start time, freeze end time, freeze duration, thaw duration, and in-situ observations at 0.1 m soil depth (e), and Taylor diagram (f).In the Taylor diagram (f), the gray dashed line represents the normalized centered root-mean-square error |
表1 冻融参量检验统计结果Table 1 Statistical results of freeze-thaw parameter validation |
| 冻结开始时间 | 冻结结束时间 | 冻结持续时间 | 融化持续时间 | |
|---|---|---|---|---|
| R | 0.98** | 0.94* | 0.97* | 0.97* |
| MBE/d | 0.68 | 6.53 | 2.18 | -2.68 |
*代表通过 90%的信度检验, **代表通过 99%的信度检验(*represents passing the 90% confidence level test, and **represents passing the 99% confidence level test) |
3.2 冻融时间参量时空分布特征
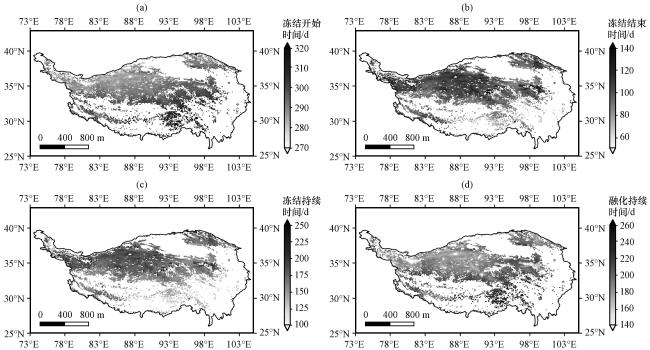
表2 1980 -2017年高原多年冻土不同气候区域年平均土壤冻融时间参量Table 2 Annual average soil freeze-thaw time parameters in different climatic regions of the plateau permafrost from 1980 to 2017 |
| 冻融时间参量 | 多年冻土全域 | 干旱区 | 半干旱区 | 半湿润区 |
|---|---|---|---|---|
| 冻结开始时间/(d) | 294 | 290 | 292 | 300 |
| 冻结结束时间/(d) | 99 | 98 | 101 | 95 |
| 冻结持续时间/(d) | 169 | 172 | 175 | 160 |
| 融化持续时间/(d) | 195 | 192 | 189 | 204 |
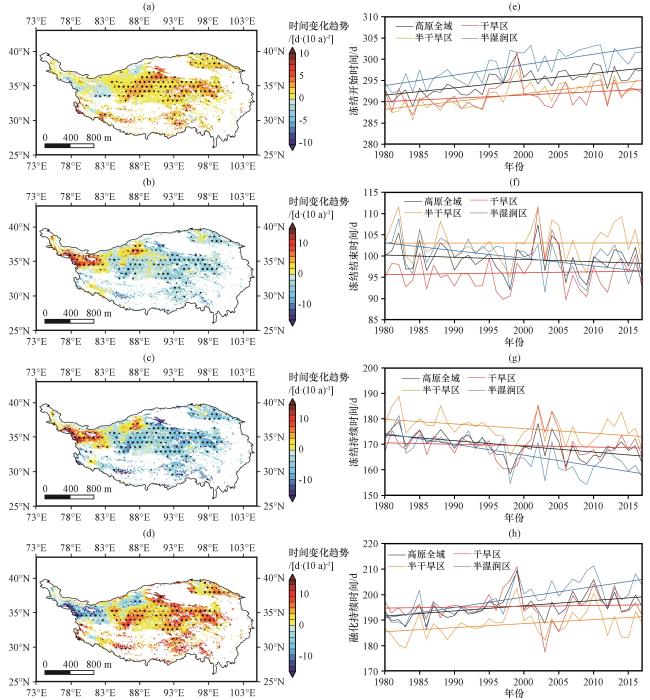
图4 1980 -2017年高原多年冻土区域冻结开始时间(a)、 冻结结束时间(b)、 冻结持续时间(c)、 融化持续时间(d)变化趋势空间分布(左)以及冻结开始时间(e)、 冻结结束时间(f)、 冻结持续时间(g)、 融化持续时间(h)时间序列及变化趋势(右)打点区域为通过90%信度检验 Fig.4 Spatial distribution of trends(left) in freeze start time (a), freeze end time (b), freeze duration (c), and thaw duration (d) in the permafrost regions of the plateau from 1980 to 2017, as well as time series and trends (right)of freeze start time (e), freeze end time (f), freeze duration (g), and thaw duration (h).Dotted areas indicate regions that passed the 90% confidence level test |
表3 高原多年冻土土壤冻融时间参量在不同气候区域的变化趋势Table 3 Trends of soil freeze-thaw time parameters in different climatic regions of the plateau permafrost |
| 冻融参量变化趋势/[d·(10a)-1] | 多年冻土全域 | 干旱区 | 半干旱区 | 半湿润区 |
|---|---|---|---|---|
| 冻结开始时间 | 1.7** | 0.77* | 1.8** | 2.4** |
| 冻结结束时间 | -0.5 | 0.2 | 0.01 | -1.8** |
| 冻结持续时间 | -2.2** | -0.5 | -1.8** | -4.2** |
| 融化持续时间 | 2** | 0.3 | 1.6* | 4** |
*代表通过 90%的信度检验, **代表通过99%的信度检验(*represents passing the 90% confidence level test, and **represents passing the 99% confidence level test) |
3.3 高原土壤冻融时间参量影响因子研究
3.3.1 高原土壤冻融时间参量与地理因子的关系
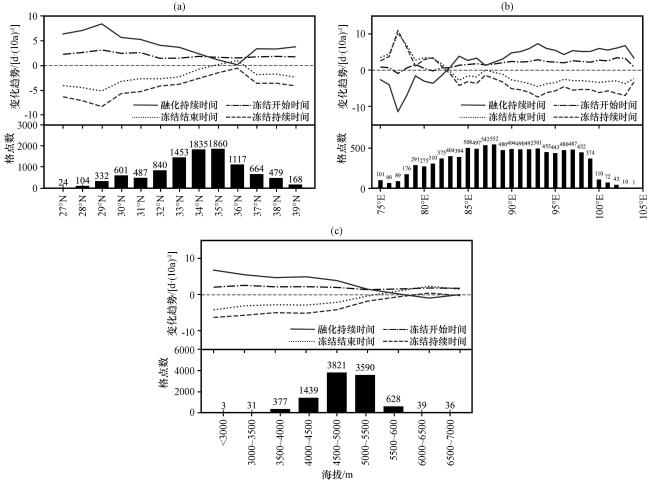
图5 冻结开始时间(点实线)、 冻结结束时间(点线)、 冻结持续时间(虚线)、 融化持续时间(实线)与地理因子的关系黑色柱状为格点数量(单位: 个) Fig.5 Relationships between freeze start time (dotted solid line), freeze end time (dotted line), freeze duration (dashed line), thaw duration (solid line), and geographic factors.The black bars represent the number of grid points (unit: count) |
3.3.2 多年冻土土壤融化持续时间与气候因子相关性研究
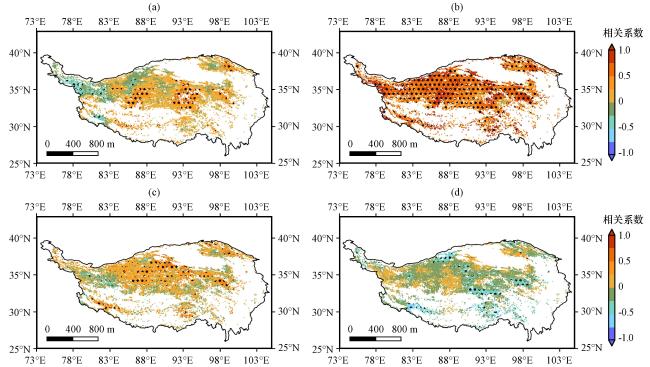
图6 1980 -2017年高原多年冻土区降水量(a)、 近地表温度(b)、 植被指数(1982 -2015年)(c)、 积雪厚度(d)与融化持续时间相关系数分布打点区为通过 90%信度检验 Fig.6 Distribution of correlation coefficients between thaw duration and precipitation (a), near-surface temperature (b), vegetation index (1982 -2015) (c), and snow depth (d) in the plateau permafrost region from 1980 to 2017.Dotted areas indicate regions that passed the 90% confidence level test |
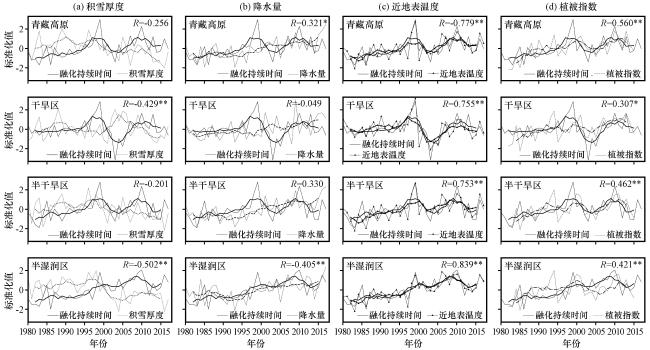
图7 1980 -2017年高原多年冻土不同气候分区土壤融化持续时间与积雪厚度(a)、 降水量(b)、 近地表温度(c)和植被指数(1982 -2015年)(d)的时间序列所有变量均进行标准化处理, 粗线条为滑动平均序列, R为相关系数, 其中*为通过90%的信度检验, **为通过99%的信度检验 Fig.7 Time series of soil thaw duration and snow depth (a), precipitation (b), near-surface temperature (c), and vegetation index (1982-2015) (d) in different climatic subregions of the plateau permafrost from 1980 to 2017.All variables are standardized, and the thick lines represent the moving average sequences.R is the correlation coefficient, where * indicates passing the 90% confidence level test, and ** indicates passing the 99% confidence level test |
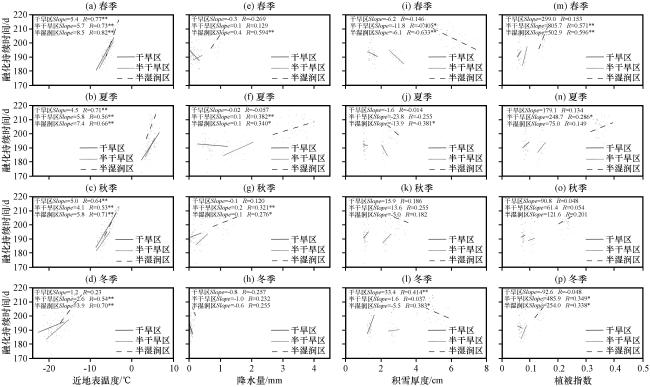
图8 1980 -2017年高原多年冻土区域不同季节和气候区融化持续时间与近地表温度(a~d)、 降水量(e~h)、 积雪厚度(i~l)、 植被指数(m~p)的相关性分析Fig.8 Correlation analysis between thaw duration and near-surface temperature (a~d), precipitation (e~h), snow depth (i~l), and vegetation index (m~p) in different seasons and climatic regions of the plateau permafrost area from 1980 to 2017 |
表4 1980 -2017年高原多年冻土干季和湿季不同气候分区土壤融化持续时间和气候因子相关系数Table 4 Correlation coefficients between soil thaw duration and climatic factors in different climatic subregions of the plateau permafrost during the dry and wet seasons from 1980 to 2017 |
| 分区 | 积雪厚度 | 降水量 | 近地表温度 | 植被指数 | |
|---|---|---|---|---|---|
| 湿季 | 多年冻土全域 | -0.49** | 0.3* | 0.61** | 0.55** |
| 干旱区 | -0.46** | -0.03 | 0.64** | 0.37** | |
| 半干旱区 | -0.37* | 0.25 | 0.68** | 0.46** | |
| 半湿润区 | -0.63** | 0.45** | 0.7** | 0.42** | |
| 干季 | 多年冻土全域 | -0.1 | 0.17 | 0.67** | 0.39* |
| 干旱区 | -0.36* | -0.23 | 0.6** | 0.19 | |
| 半干旱区 | -0.09 | -0.08 | 0.61** | 0.34 | |
| 半湿润区 | -0.38* | 0.16 | 0.87** | 0.25 |
*代表通过 90%的信度检验, **代表通过 99%的信度检验(*represents passing the 90% confidence level test, and **represents passing the 99% confidence level test) |