
1 引言
2 传统二分法预报评分
2.1 二分法TS评分
表1 二分类列联表Table 1 The binary classification contingency table |
| 观测发生 | 观测未发生 | |
|---|---|---|
| 预报事件发生 | A | B |
| 预报事件未发生 | C | D |
2.2 灾害性天气评价中TS评分的局限
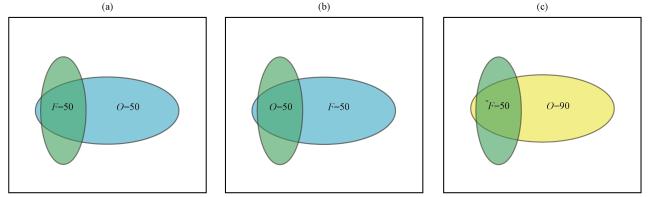
图1 不同的预报和观测降水场情景示例(a)观测降水面积大于预报面积, (b)预报降水面积大于观测面积, (c)观测降水面积大于预报面积, 同时降水量大于预报降水量。“F”表示预报, “O”表示观测, 数值表示降水的量级Fig.1 Illustrates examples of different scenarios for forecasted and observed precipitation fields.(a) The observed precipitation area is larger than the forecasted area.(b) The forecasted precipitation area is larger than the observed area.(c) The observed precipitation area is larger than the forecasted area, and the precipitation amount is also greater than the forecasted precipitation amount.The letter "F" represents the forecast, the letter "O" represents the observation, and the numerical values indicate the amount of precipitation |
3 ITS评分定义
表2 降水事件影响因子(A, C=1)及等价影响Table 2 The impact factors of precipitation events (A, C=1) and their equivalent impact |
| 观测 | 预报 | 事件 | 影响因子 | 等价影响 |
|---|---|---|---|---|
| O | F | A | ||
| C |
O表示观测, F表示预报("O" in the table represents observation, while "F" represents forecast) |
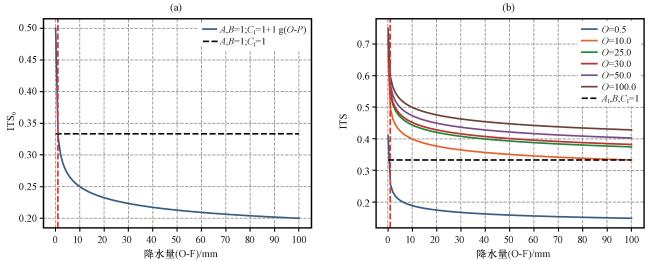
图3 影响评分随降水量差值和降水量的变化曲线(a) ITS0, (b)ITS, 图(a)中黑色虚线为A, B, CI等于1的ITS0评分, 图(b)中的黑色虚线为AI, B, CI等于1的ITS评分, 红色虚线为O-F为1.0 mm或者O为1.0 mm所对应的位置Fig.3 The curve of impact scores with changes in precipitation difference and precipitation amount.(a) ITS0, (b) ITS.The black dashed lines in (a) and (b) represent the impact scores for A, B, CI equal to 1 and AI, B, CI equal to 1.The red dashed line represents the position corresponding to O-F equals 1.0 mm or O equals 1.0 mm |
4 假想个例的降水预报评分试验
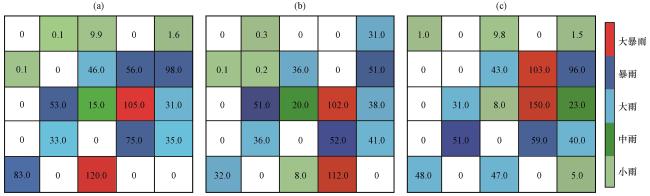
图4 假想的降水个例(a)观测降水, (b)假想的预报个例1, (c)假想的预报个例2, 图中数值为降水量(单位: mm)Fig.4 Hypothetical precipitation cases.(a) Observed precipitation, (b) Hypothetical precipitation forecast case 1, (c) Hypothetical precipitation forecast case 2.The numbers in the figure represent precipitation amounts (unit: mm) |
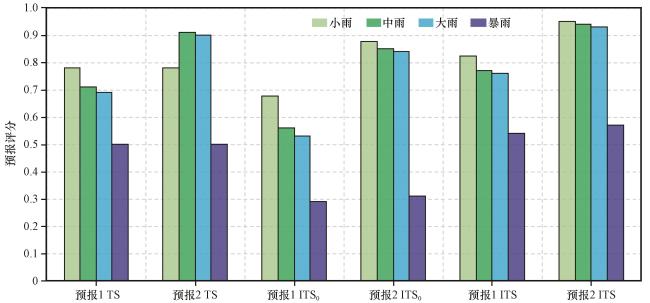
表3 单向累加的降水量分级的降水预报事件分类Table 3 Classification of precipitation forecast events based on one-way accumulated precipitation amount |
| TS | ITS0或ITS | ||||||
|---|---|---|---|---|---|---|---|
| 预报1事件 | 预报2事件 | 预报1事件 | 预报2事件 | ||||
| 小雨(R≥0.1 mm) | A=14 | B=2 | A=14 | B=2 | AI=31.21 | AI =35.95 | |
| C=2 | D=7 | C=2 | D=7 | CI=4.7 | CI =0.0 | ||
| 中雨(R≥10.0 mm) | A=10 | B=2 | A=12 | B=1 | AI =26.9 | AI =32 | |
| C=2 | D=11 | C=0 | D=13 | CI =5.7 | CI =0.0 | ||
| 大雨(R≥30.0 mm) | A=9 | B=2 | A=10 | B=1 | AI =24.75 | AI =28.1 | |
| C=2 | D=12 | C=1 | D=13 | CI =5.8 | CI =1.9 | ||
| 暴雨(R≥50.0 mm) | A=4 | B=1 | A=4 | B=1 | AI =11.61 | AI =11.64 | |
| C=3 | D=17 | C=3 | D=17 | CI =8.5 | CI =7.7 | ||
5 预报评分应用
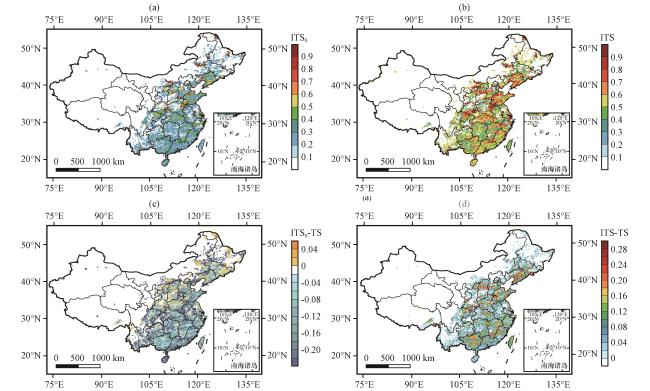
图8 2022年中国区域降水量R≥50.0 mm ECMWF模式的ITS0、 ITS以及与其TS评分的差值(a)ITS0, (b) ITS, (c) ITS0与TS评分的差值, (d) ITS与TS评分的差值Fig.8 ITS0 scores, ITS scores, and the difference between ITS0/ITS scores and TS scores for ECMWF model forecasts with precipitation amount R≥50.0 mm in China in 2022.(a) ITS0, (b) ITS, (c) the difference between ITS0 and TS, (d) the difference between ITS and TS |

图9 R≥0.1 mm(a、 c、 e)和R≥50.0 mm(b、 d、 f)的预报偏差(a)、 (b)为TS评分对应的Bias, (c)、 (d)为考虑等价影响AI后ITS0对应的Bias, (e)、 (f)为考虑等价影响AI和CI后对应的BiasFig.9 Bias for R≥0.1 mm(a、 c、 e) and R≥50.0 mm(b、 d、 f).(a), (b) represent the Bias corresponding to TS score; (c), (d) represent the Bias corresponding to ITS0 after considering the AI; (e), (f) represent the Bias after considering the AI and CI |