
1 引言
2 数据来源及数值试验设计
2.1 数据来源
2.2 模式系统设置
2.3 对比试验设计
3 过程概况及螺旋雨带对流演变特征分析
3.1 降水概况
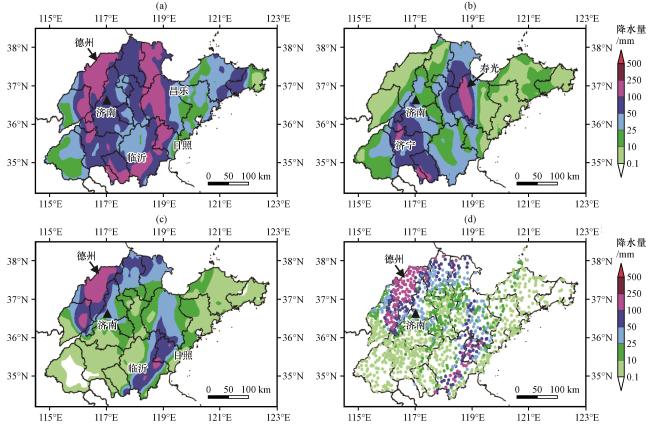
图1 2018年8月13日08:00至16日20:00山东省地面观测站降水量分布(a), 13日08:00至14日08:00(b)、 14日08:00至15日08:00(c) 、 14日08:00至15日08:00(d)山东省地面观测站24 h降水量分布Fig.1 Total rainfall amount (shading, unit: mm) caused by Typhoon Yagi from 08:00 on 13 to 20:00 on 16 August in 2018 (colored areas) (a), the 24-hour accumulated rainfall from 08:00 on 13 to 08:00 on 14(b), from 08:00 on 14 to 08:00 on 15(c), and the distribution of the 24-hour accumulated rainfall amount at ground-based meteorological stations in Shandong from 08:00 on 14 to 08: 00 on 15 August (d).Unit: mm.The triangular symbol in the figures is the location of Jinan |
3.2 雷达回波演变特征分析
3.2.1 对流初生阶段
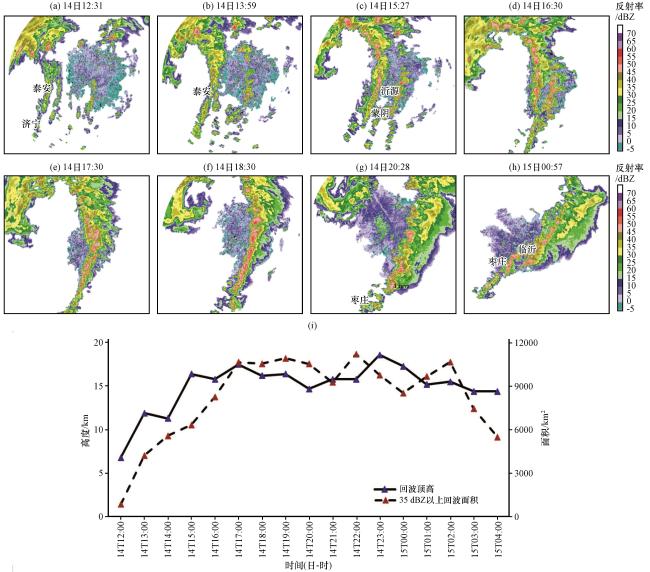
图2 2018年8月14日下午山东潍坊雷达(a~g)、 临沂雷达(h)组合反射率演变(单位: dBZ), 沿带状回波超过35 dBZ的回波顶高、 回波面积时间演变(i)(a)14日12:31, (b)14日13:59, (c)14日15:27, (d)14日16:30, (e) 14日17:30, (f)14日18:30, (g)14日20:28, (h)15日00:57Fig.2 Evolution of the composite radar reflectivity (unit: dBZ) of Weifang radar(a~g) and Linyi radar (h) in Shandong at 12:31 (a), 13:59(b), 15:27(c), 16:30(d), 17:30(e), 18:30 (f), 20:28(g) on 14 and 00:57 on 15(h) August, 2018, time evolution of the radar echo tops and areas exceeding 35 dBZ along the linear/spiral rainbands (i) |
3.2.2 组织发展阶段
3.2.3 成熟阶段
3.2.4 减弱消亡阶段
3.3 逐小时降水演变特征分析
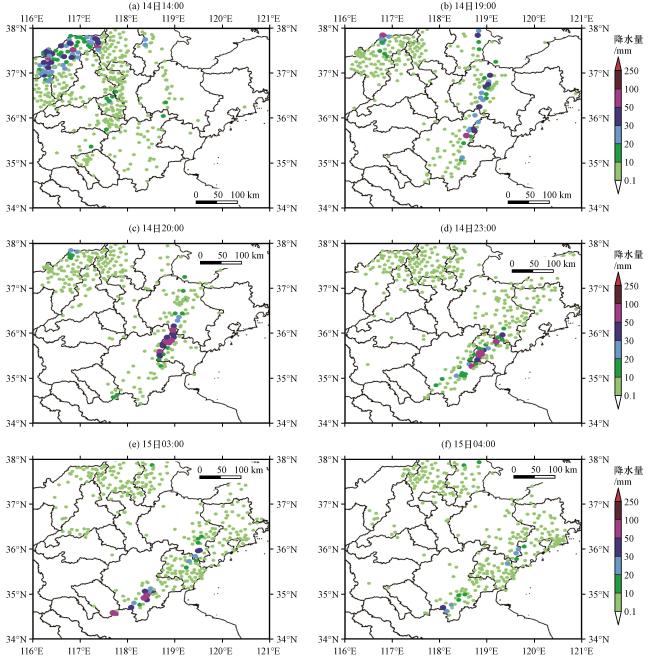
图3 8月14—15日山东省地面观测站逐小时降水分布特征(单位: mm)(a)14日14:00, (b)14日19:00, (c)14日20:00, (d)14日23:00, (e)15日03:00, (f)15日04:00Fig.3 Distribution of hourly precipitation (unit: mm) from the ground-based meteorological stations in Shandong at14:00 on August 14 (a), 19:00 on August 14 (b), 20:00 on August 14 (c), 23:00 on August 14 (d), 03:00 on August 15 (e) and 04:00 on August 15 (f) |
4 数值预报结果分析
4.1 台风强度和路径预报检验
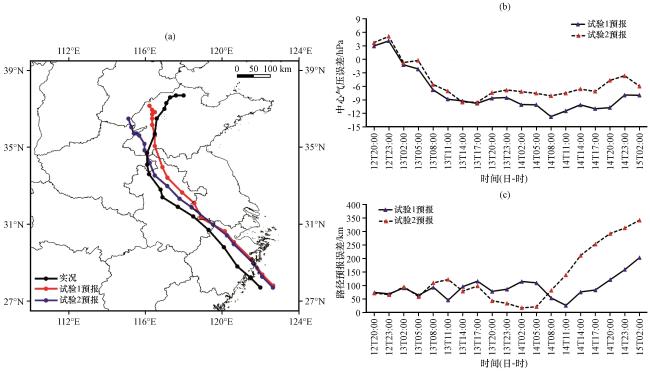
图4 试验1(Exp 1)和试验2(Exp 2)预报的台风路径和强度检验(a)台风路径预报和实况, (b)台风中心气压预报误差时间演变曲线, (c)台风路径预报误差时间演变曲线Fig.4 Track and intensity forecast of Exp 1 and Exp 2.(a) the track forecasts and observation data from CMA, (b) errors of pressure forecast near the center of typhoon by Exp 1 and Exp 2, (c) errors of track forecast of typhoon by Exp 1 and Exp 2 |
4.2 降水预报分析
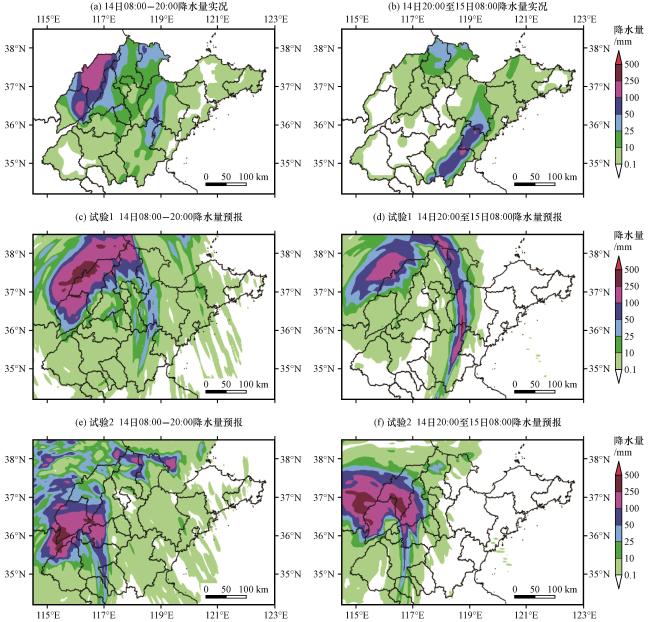
图5 不同试验逐12 h降水量预报与实况对比(单位: mm)(a)14日08:00 -20:00降水量实况, (b)14日20:00至15日08:00降水量实况, (c)试验1 14日08:00 -20:00降水量预报, (d)试验1 14日20:00至15日08:00降水量预报, (e)试验2 14日08:00 -20:00降水量预报, (f)试验2 14日20:00至15日08:00降水量预报Fig.5 Comparisons of the 12-hour accumulated rainfall (unit: mm) between the forecasts and the observations, the observations (a), forecasts of Exp 1(c) and Exp 2(e) from 08:00 to 20:00 on August 14, and the observations (b), forecasts of Exp 1(d) and Exp 2(f) from 20:00 on August 14 to 08:00 on August 15 |
表1 不同试验 24 h分段降水量预报 TS评分Table 1 Threat scores for the 24-hour accumulated rainfall forecasts in different experiments |
| 预报时效 | 试验名称 | 晴雨 | 中雨 | 大雨 | 暴雨 | 大暴雨 |
|---|---|---|---|---|---|---|
| 12~36 h | 试验1 | 91.70 | 31.74 | 22.60 | 16.37 | 9.91 |
| 试验2 | 92.09 | 27.98 | 12.07 | 11.38 | 8.68 | |
| 36~60 h | 试验1 | 86.31 | 17.73 | 12.72 | 17.6 | 31.54 |
| 试验2 | 81.36 | 12.44 | 6.16 | 4.71 | 11.28 |
4.3 模式预报的雷达组合反射率演变分析
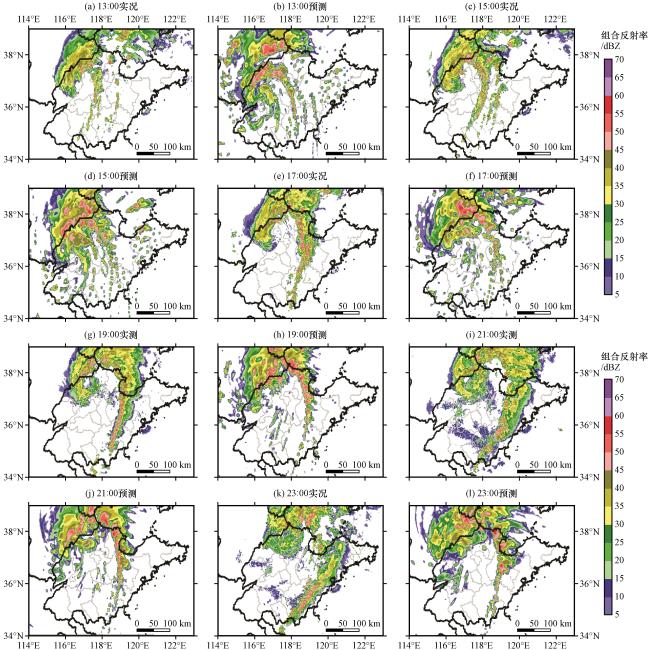
图6 2018年8月14日雷达组合反射率拼图实况及试验1预报结果诊断的雷达组合反射率(单位: dBZ)演变(a)13:00实况, (b)13:00预报, (c)15:00实况, (d)15:00预报, (e)17:00实况, (f)17:00预报, (g)19:00实况, (h)19:00预报, (i)21:00实况, (j)21:00预报, (k)23:00实况, (l)23:00预报Fig.6 The composite radar reflectivity mosaics (unit: mm)of the (a, c, e, g, i, k) observations and (b, d, f, h, j, l) forecasts from Exp 1 at (a, b) 13:00, (c, d) 15:00, (e, f) 17:00, (g, h) 19:00, (i, j) 21:00 and (k, l) 23:00 on August 14 |
5 螺旋雨带成因分析
5.1 螺旋雨带发生的天气尺度系统分析
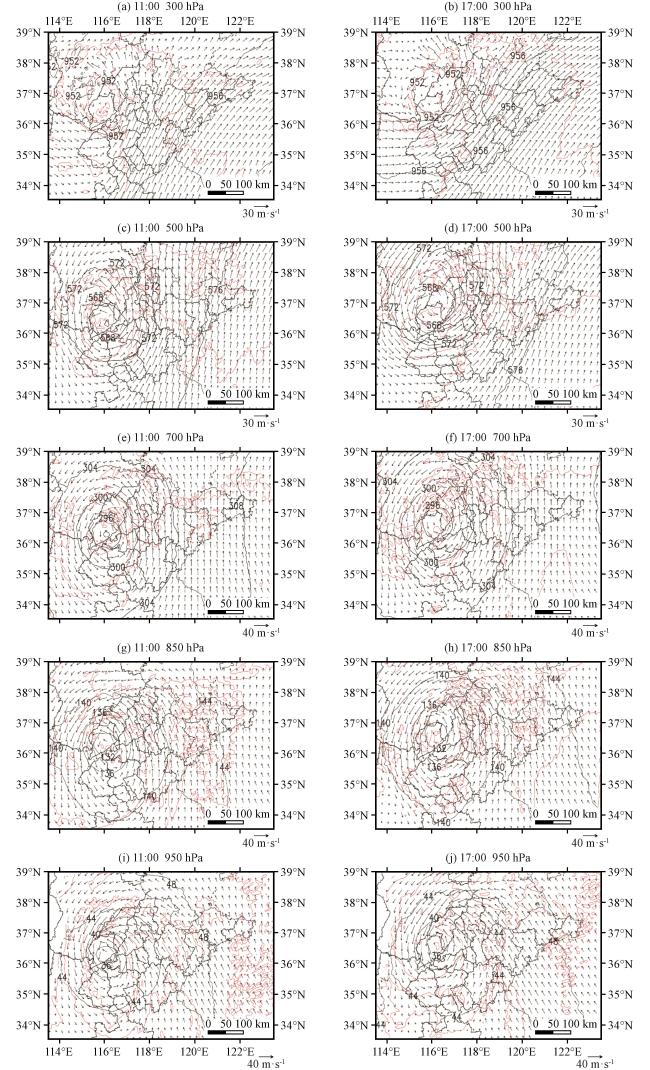
图7 试验1预报的14日山东上空大气位势高度场(黑色实线, 单位: dagpm)、 温度场(红色实线, 单位: ℃)和风场(箭头, 单位: m∙s -1)分布(a) 11:00 300 hPa, (b) 17:00 300 hPa, (c) 11:00 500 hPa, (d) 17:00 500 hPa, (e) 11:00 700 hPa, (f) 17:00 700 hPa, (g) 11:00 850 hPa, (h) 17:00 850 hPa, (i) 11:00 950 hPa, (j) 17:00 950 hPaFig.7 Atmospheric geopotential height fields (black solid lines, unit: dagpm), temperature fields (red solid lines, unit: ℃) and wind fields (arrows, unit: m·s -1) over Shandong forecasted in Exp 1 at (a, b) 300 hPa, (c, d) 500 hPa, (e, f) 700 hPa and (g, h) 850 hPa at 11:00 (a, c, e, g) and 17:00 (b, d, f, h) on August 14 |
5.2 大气垂直动力场和湿度场分析
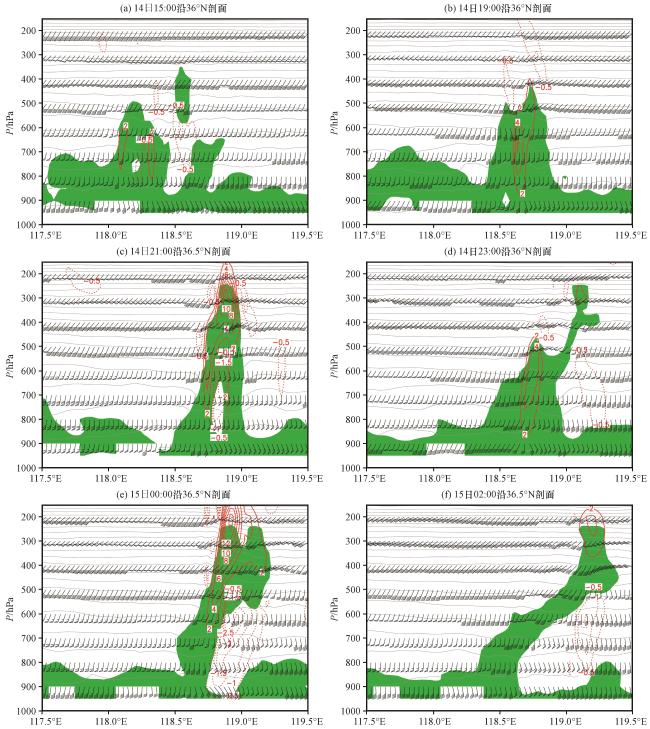
图8 试验1预报的沿36°N -36.5°N的大气风场(黑色风向杆, 单位: m∙s -1)、 温度场(黑色实线, 单位: ℃)和垂直速度场(红色实线和虚线, 单位: m∙s -1)剖面(绿色阴影区为相对湿度超过90%的区域)(a)14日15:00沿36°N剖面, (b)14日19:00沿36°N剖面, (c)14日21:00沿36.5°N剖面, (d)14日23:00沿36°N剖面, (e)15日00:00沿36.5°N剖面, (f)15日02:00沿36.5°N剖面Fig.8 Cross-sections of the atmospheric wind fields (black wind vectors, unit: m∙s -1), temperature fields (black solid lines, unit: ℃) and vertical velocity fields (red solid and dashed lines, unit: m·s -1) forecasted of Exp 1 along 36°N -36.5°N (the green shaded areas represent the areas with the relative humidity exceeding 90%).(a) 15:00 on 14 along 36°N, (b) 19:00 on 14 along 36°N, (c) 21:00 on 14 along 36.5°N, (d) 23:00 on 14 along 36°N, (e) 00:00 on 15 along 36.5°N, (f) 02:00 on 15 along 36.5°N |
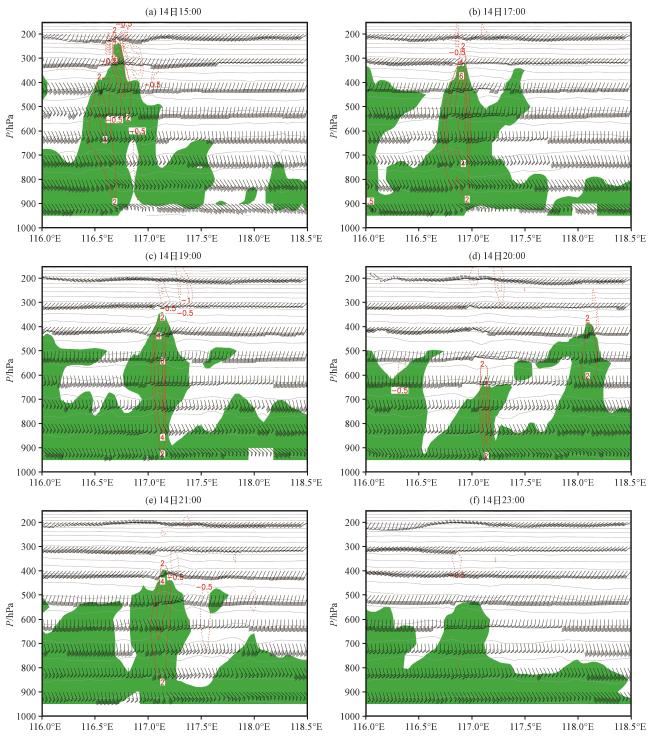
图9 试验2预报的14日沿36°N的大气风场(黑色风向杆, 单位: m∙s -1)、 温度场(黑色实线, 单位: ℃)和垂直速度场(红色虚线, 单位: m∙s -1)剖面(绿色阴影区为相对湿度超过90%的区域)(a)14日15:00, (b)14日17:00, (c)14日19:00, (d)14日20:00, (e)14日21:00, (f)14日23:00Fig.9 Cross-sections of the atmospheric wind fields (black wind vectors, unit: m∙s -1), temperature fields (black solid lines, unit: ℃) and vertical velocity fields (red dashed lines, unit: m s -1) forecasted by Exp 1 along 36°N at 15:00 (a), 17:00 (b), 19:00 (c), 20:00(d), 21:00 (e) and 23:00 (f) on August 14 (the green shaded areas represent the areas with the relative humidity exceeding 90%) |
5.3 对流发生和演变过程分析
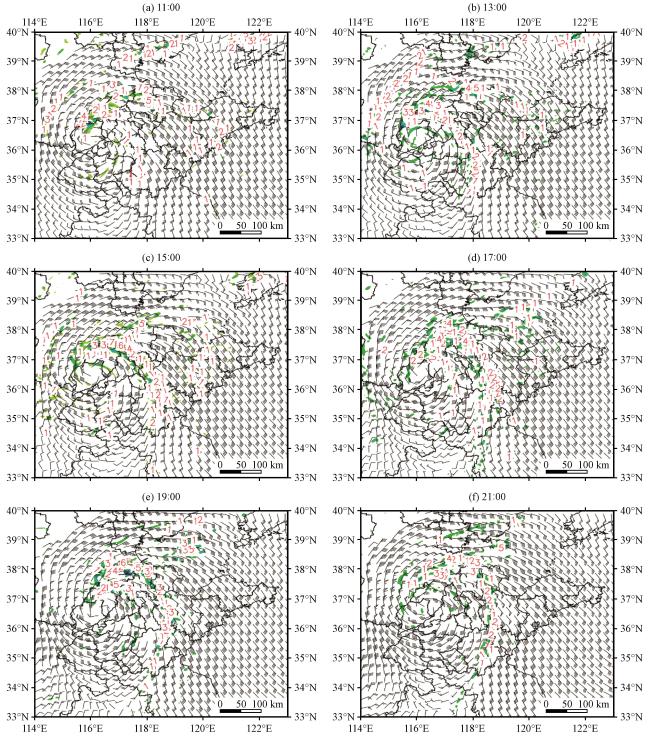
图10 试验1预报的14日850 hPa的垂直运动(红色等值线, 单位: m∙s -1)、 水汽通量辐合[绿色阴影区, 单位: g·(s·cm 2·hPa) -1]和950 hPa风场(黑色风向杆, 单位: m∙s -1)演变(a)11:00, (b)13:00, (c)15:00, (d)17:00, (e)19:00, (f)21:00Fig.10 The vertical motion at 850 hPa (red contour lines, unit: m s -1), water vapor flux convergence[green shaded, unit: g·(s·cm 2·hPa) -1]and the evolution of the 950 hPa wind field (black wind vectors, unit: m∙s -1) forecasted in Exp.1 at 11:00(a), 13:00(b), 15:00 (c), 17:00 (d), 19:00 (e) and 21:00 (f) on August 14 |
5.4 对流触发形成过程分析
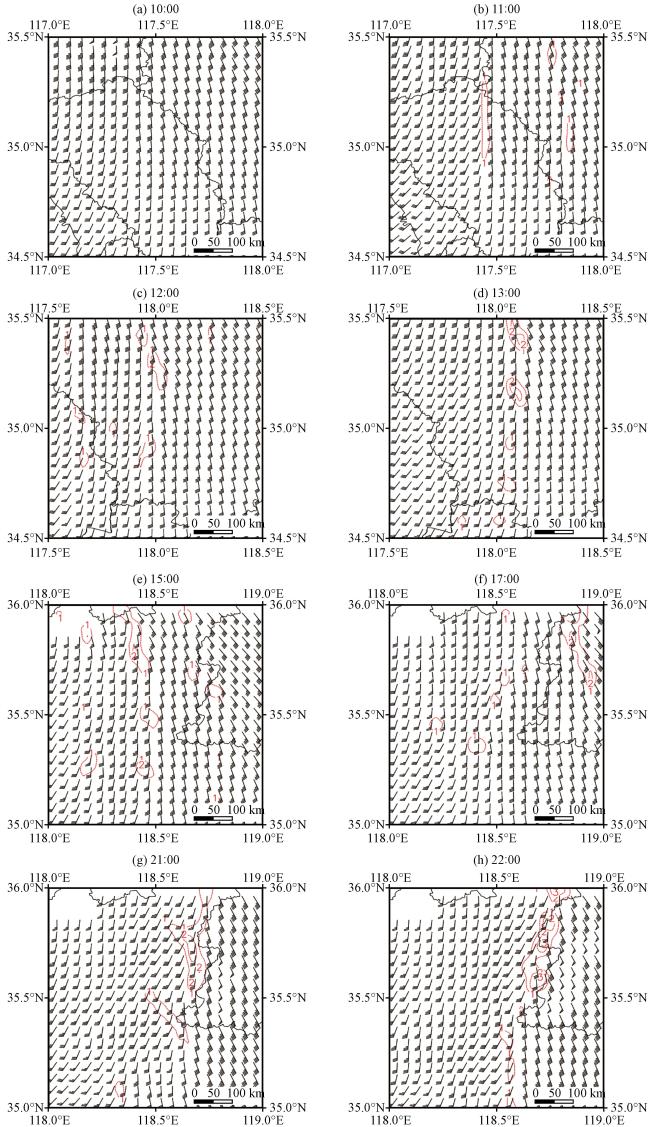
图11 试验1预报的14日对流系统初生和发展过程850 hPa的垂直运动(等值线, 单位: m∙s -1)和950 hPa风场(黑色风向杆, 单位: m∙s -1)演变特征(a)10:00, (b)11:00, (c)12:00, (d)13:00, (e)15:00, (f)17:00, (g)21:00, (h)22:00Fig.11 The vertical motion at 850 hPa (contour lines, unit: m s -1) and the evolution characteristics of the 950 hPa wind field (black wind vectors, unit: m∙s -1) during the initiation and development of the convective system forecasted in Exp1 at 10:00 (a), 11:00 (b), 12:00 (c), 13:00 (d), 15:00 (e), 17:00 (f), 21:00 (g) and 22:00 (h) on August 14 |
5.5 大气热力场分析
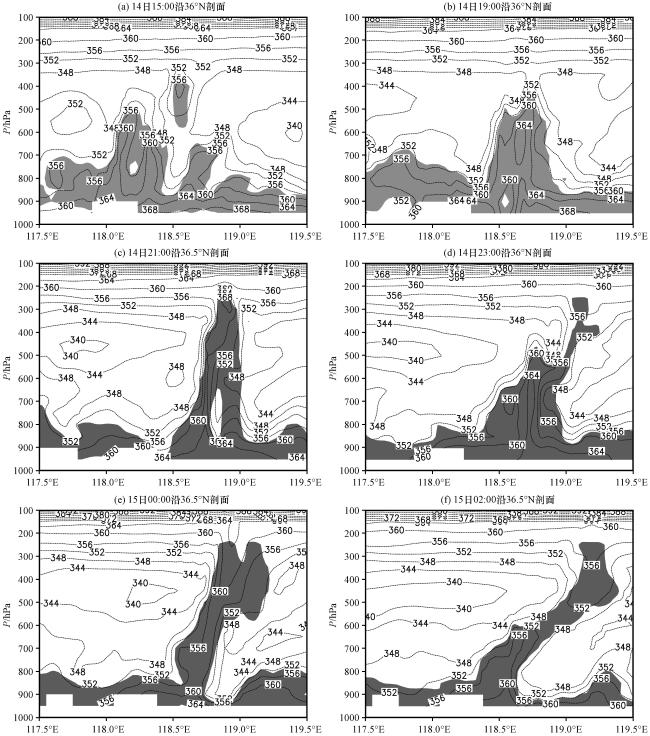
图12 试验1预报的沿36°N -36.5°N的大气假相当位温剖面(单位: K, 阴影区为相对湿度超过90%的区域)(a)14日15:00沿36°N剖面, (b)14日19:00沿36°N剖面, (c)14日21:00沿36.5°N剖面, (d)14日23:00沿36°N剖面, (e)15日00:00沿36.5°N剖面, (f)15日02:00沿36.5°N剖面Fig.12 Cross-sections of the atmospheric pseudo-equivalent potential temperature (K).The shaded areas represent the areas with the relative humidity exceeding 90%.(a) 15:00 on 14 along 36°N, (b) 19:00 on 14 along 36°N, (c) 21:00 on 14 along 36.5°N, (d) 23:00 on 14 along 36°N, (e) 00:00 on 15 along 36.5°N, (f) 02:00 on 15 along 36.5°N |