
1 引言
2 研究区域、 数据来源与方法介绍
2.1 研究区概况
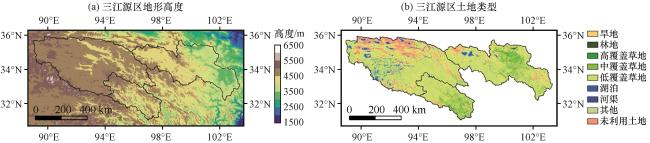
图1 三江源区地形高度(a)和2015年土地利用类型分布(b)黑色边界线表示三江源区域的边界以及长江源区、 黄河源区、 澜沧江源区边界 Fig.1 Topographic height of the Three River Source Region (TRSR)(a) and distribution of land use types in 2015.The black line represents the boundary of the TRSR, as well as the Yangtze River, the Yellow River and the Lancang River |
2.2 数据来源
2.3 研究方法
2.3.1 趋势分析
2.3.2 相关分析
2.3.3 部分信息分解(PID)解耦分析
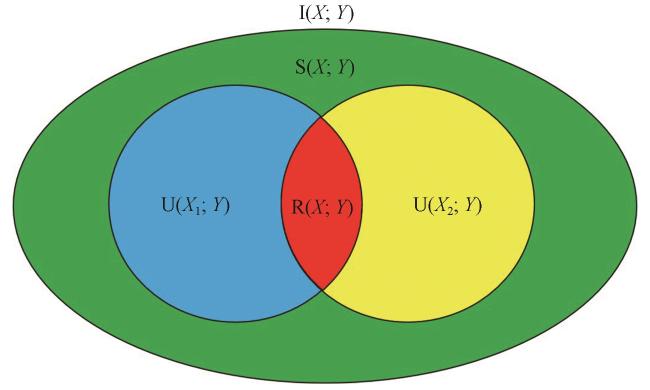
图2 两个来源X 1和X 2部分信息分解示意图总互信息(整个椭圆形)分解为四部分: X 1的独立信息(蓝色斑块)、 X 2的独立信息(黄色斑块)、 冗余信息(红色斑块)和协同信息(绿色斑块), 引自Schick-Poland et al, 2021 Fig.2 Schematic diagram of partial information decomposition for two sources: X 1 and X 2.The total mutual information (the entire ellipse) is decomposed into four components: unique information of X 1 (blue patches), unique information of X 2 (yellow patches), redundant information (red patches), and synergistic information (green patches), adapted from Schick-Poland et al, 2021 |
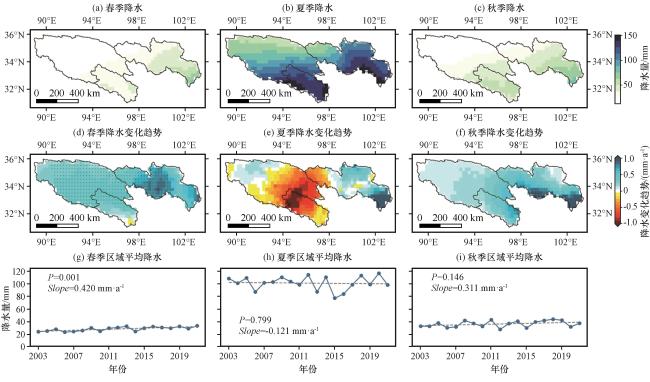
图3 2003 -2021年三江源区不同季节月降水总量(a, b, c), 降水总量的线性变化趋势(d, e, f), 区域平均降水总量的线性变化趋势(g, h, i)图(d)~(f)中黑点表示表示通过Student’s t-test 95%显著性检验水平, 图(g)~(i)中虚线表示变化趋势线 Fig.3 Monthly precipitation (a, b, c), the linear trends of precipitation (d, e, f), and the linear trends of regional mean precipitation (g, h, i) in different seasons in the TRSR from 2003 to 2021.The black dots in Fig.3(d)~(f) represent grid cells that pass 95% significance level based on the Student’s t-test, and dashed lines in Fig.3(g)~(i) represent the trend lines |
3 结果分析
3.1 春、 夏、 秋季气象要素和LAI的时空变化特征
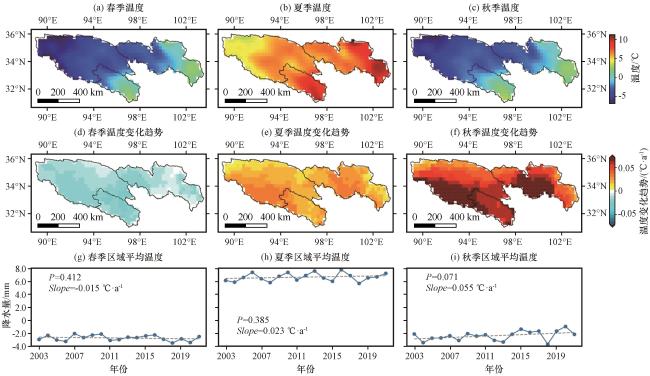
图4 2003 -2021年三江源区不同季节的平均温度(a, b, c), 温度的线性变化趋势(d, e, f), 区域平均温度的线性变化趋势(g, h, i)图(d)~(f)中黑点表示表示通过Student’s t-test 95%显著性检验水平, 图(g)~(i)中虚线表示变化趋势线 Fig.4 Average temperature (a, b, c), the linear trends of temperature (d, e, f), and the linear trends of regional mean temperature (g, h, i) in different seasons in the TRSR from 2003 to 2021.The black dots in Fig.4(d)~(f) represent grid cells that pass 95% significance level based on the Student’s t-test, and the dashed lines in Fig.4(g)~(i) represent the trend lines |
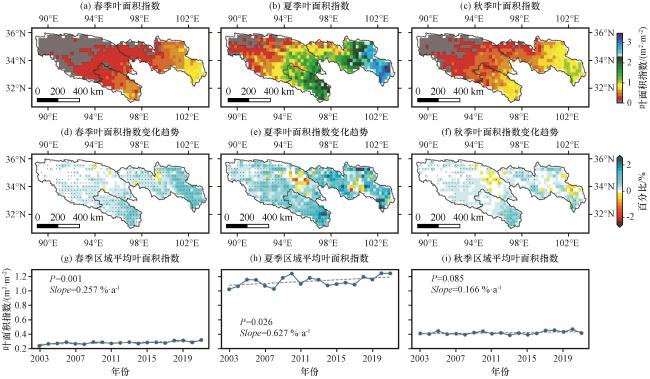
图5 2003 -2021年三江源区不同季节的平均LAI(a, b, c), LAI的线性变化趋势(d, e, f), 区域平均LAI的线性变化趋势(g, h, i)图(d)~(f)中黑点表示表示通过Student’s t-test 95%显著性检验水平, 图(g)~(i)中虚线表示变化趋势线 Fig.5 Average LAI ( a, b, c), the linear trends of LAI change (d, e, f), the linear trends of regional mean LAI (g, h, i) in different seasons in the TRSR from 2003 to 2021.The black dots in Fig.5(d)~(f) represent grid cells that pass 95% level based on the Student’s t-test, and the dashed lines in Fig.5(g)~(i) represent the trend lines |
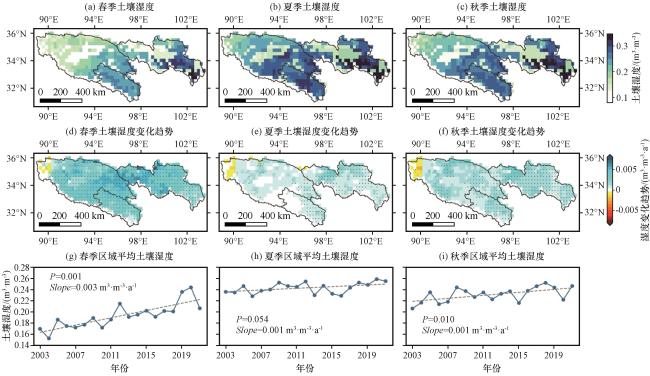
图6 2003 -2021年三江源区不同季节的平均SM(a, b, c), SM的线性变化趋势(d, e, f), 区域平均土壤湿度的线性变化趋势(g, h, i)图(d)~(f)中黑点表示表示通过 Student’s t-test 95%显著性检验水平, 图(g)~(i)中虚线表示变化趋势线 Fig.6 Average soil moisture (a, b, c), the linear trends of SM (d, e, f), the linear trends of regional mean SM (g, h, i) in different seasons in the TRSR from 2003 to 2021.The black dots in Fig.6(d)~(f) represent grid cells that pass 95% level based on the Student’s t-test, and the dashed lines in Fig.6(g)~(i) represent the trend lines |
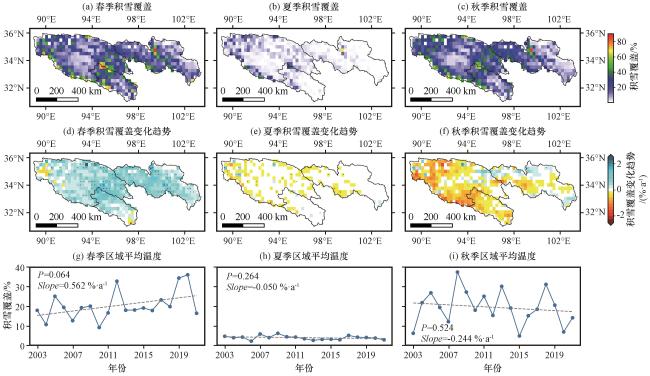
图7 2003 -2021年三江源区不同季节的平均SC(a, b, c), SC的线性变化趋势(d, e, f), 区域平均SC的线性变化趋势(g, h, i)图(d~f)中黑点表示表示通过 Student’s t-test 95%显著性检验水平, 图(g~i)中虚线表示变化趋势线 Fig.7 Average snow cover (a, b, c), the linear trends of SC (d, e, f), the linear trends of regional mean SC (g, h, i) in different seasons in the TRSR from 2003 to 2021.The black dots in Fig.(d~f) represent grid cells that pass 95% level based on the Student’s t-test, and the dashed lines in Fig.(g~i) represent the trend lines |
3.2 不同季节LAI与水分驱动因子、 水分驱动因子与气候变化的线性相关分析
表1 不同季节SM、 SC与LAI之间的Pearson相关系数Table 1 Pearson correlation coefficients between SM, SC and LAI in different seasons |
| 季节 | 相关系数 | ||
|---|---|---|---|
| 土壤湿度 | 积雪覆盖 | ||
| 叶面积指数 | 春季 | 0.56** | 0.24 |
| 夏季 | 0.59*** | -0.17 | |
| 秋季 | 0.32 | -0.08 | |
*** (p<0.01), **(p<0.05), *(p<0.1) |
表2 不同季节降水、 温度与SM、 SC之间的Pearson相关系数Table 2 Pearson correlation coefficients between precipitation, temperature and SM, SC in different seasons |
| 季节 | 相关系数 | ||
|---|---|---|---|
| 降水 | 温度 | ||
| 土壤湿度 | 春季 | 0.63*** | -0.44*) |
| 夏季 | 0.77*** | -0.15 | |
| 秋季 | 0.85*** | -0.09 | |
| 积雪覆盖 | 春季 | 0.41* | -0.60*** |
| 夏季 | 0.46** | -0.37 | |
| 秋季 | 0.61*** | -0.66*** | |
*** (p<0.01), ** (p<0.05), * (p<0.1) |
3.3 LAI影响因子的PID解耦分析
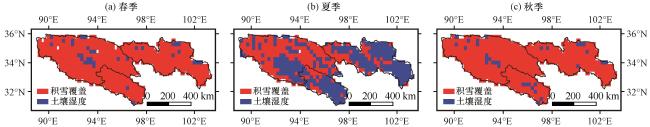
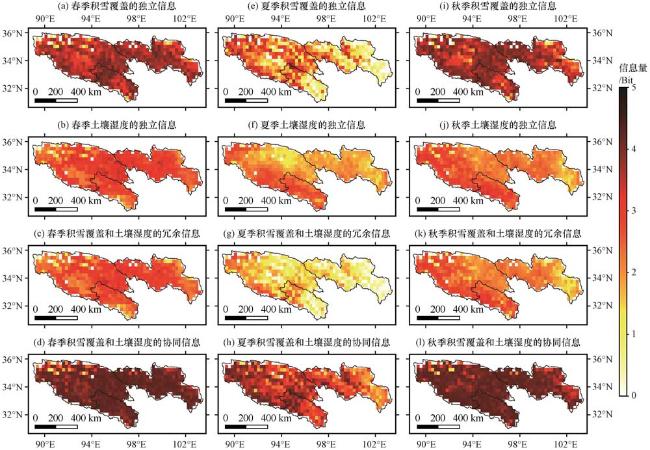
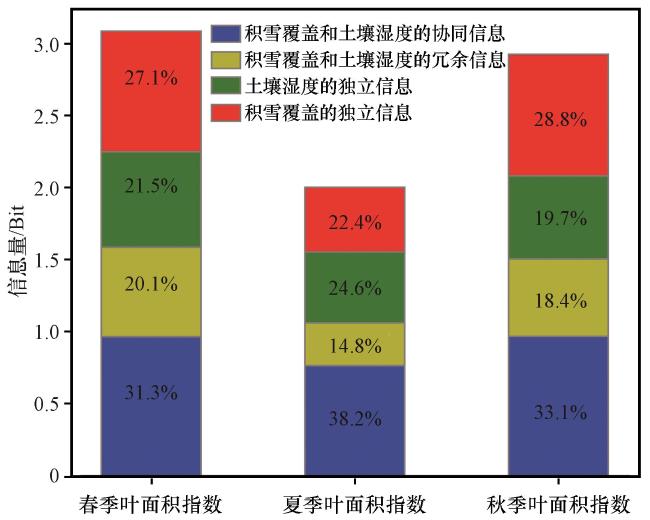
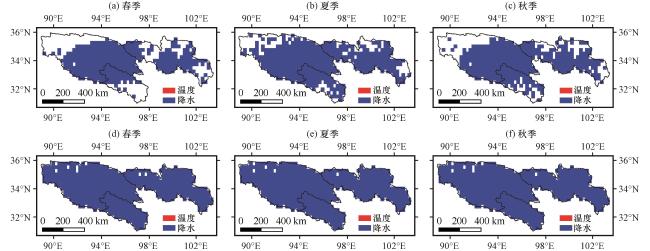
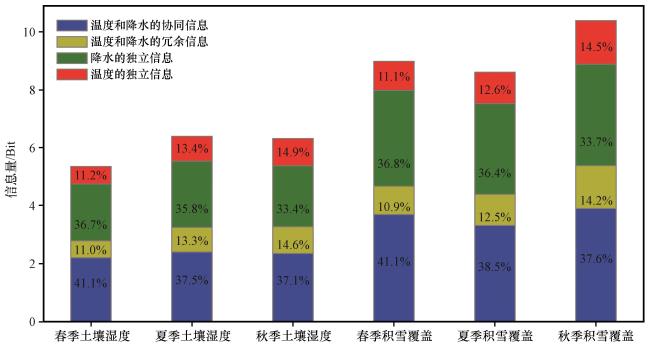
图11 不同季节SM(a, b, c)和SC(d, e, f)的主要驱动因素(温度和降水的影响)的空间分布(a, d)春季, (b, e)夏季, (c, f)秋季 Fig.11 Spatial distribution of the main drivers of SM(a, b, c) and the main drivers of SC (d, e, f) (influence of temperature and precipitation) in different seasons: (a, d) spring, (b, e) summer, (c, f) autumn |