
1 引言
2 数据来源与方法介绍
2.1 数据来源
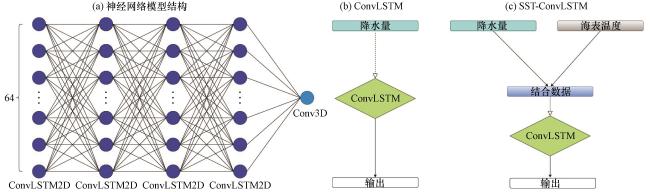
2.2 ConvLSTM
2.3 SST-ConvLSTM
2.4 评估方法
3 结果分析
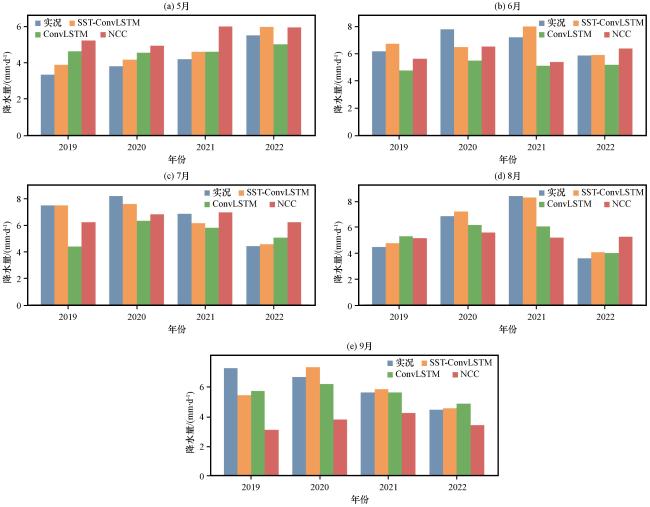
3.1 月均降水量预测
3.2 降水量预测的空间分布
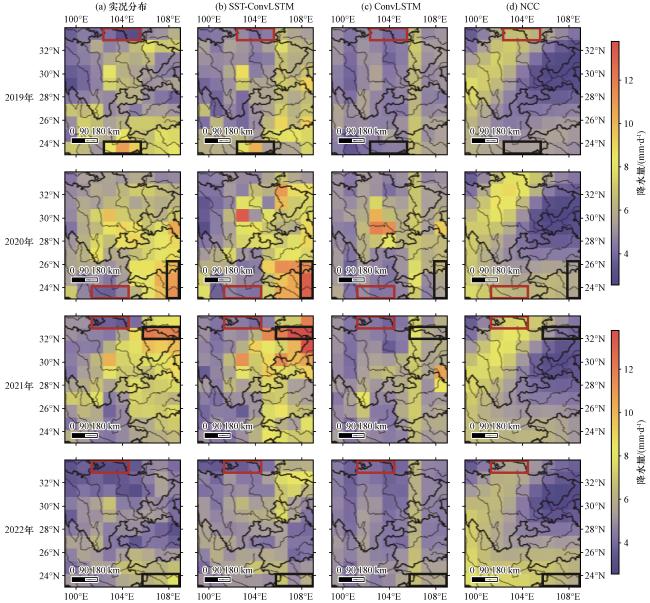
图3 三个模型2019 -2022年平均降水量空间分布的预测结果(单位: mm·d-1)(a)表示实况降水分布, (b) SST-ConvLSTM模型的预测结果, (c) ConvLSTM的预测结果, (d) NCC的预测结果黑色方框和红色方框大小均为3个格点, 分别表示实况降水量占比最大和最小格点所在的区域Fig.3 The forecasted spatial distribution of average precipitation for the three models from 2019 to 2022.Unit: mm·d-1.(a) column represents the distribution of real data, (b) the forecasted distributions of SST-ConvLSTM, (c) the forecasted distributions of ConvLSTM, (d) the forecasted distributions of NCC.The black square and the red square, both spanning 3 grid points, represent the regions where the real precipitation percentage is highest and lowest, respectively |
表1 三个模型的预测值的最大值与最小值所在方框格点的平均值Tabel 1 The average values of the maximum and minimum prediction values of the three models within the boxed grid points are presented |
| 模型 | 时间 | 最大值/(mm·d-1) | 最小值/(mm·d-1) |
|---|---|---|---|
| SST-ConvLSTM | 2019 | 7.796 | 4.107 |
| 2020 | 12.562 | 4.399 | |
| 2021 | 13.181 | 4.357 | |
| 2022 | 5.993 | 3.871 | |
| ConvLSTM | 2019 | 4.435 | 4.176 |
| 2020 | 5.911 | 4.513 | |
| 2021 | 6.452 | 4.421 | |
| 2022 | 6.057 | 3.997 | |
| NCC | 2019 | 5.359 | 6.522 |
| 2020 | 5.622 | 6.389 | |
| 2021 | 7.128 | 4.399 | |
| 2022 | 6.267 | 5.459 |
黑体突出表示效果最好(the best performance highlighted) |
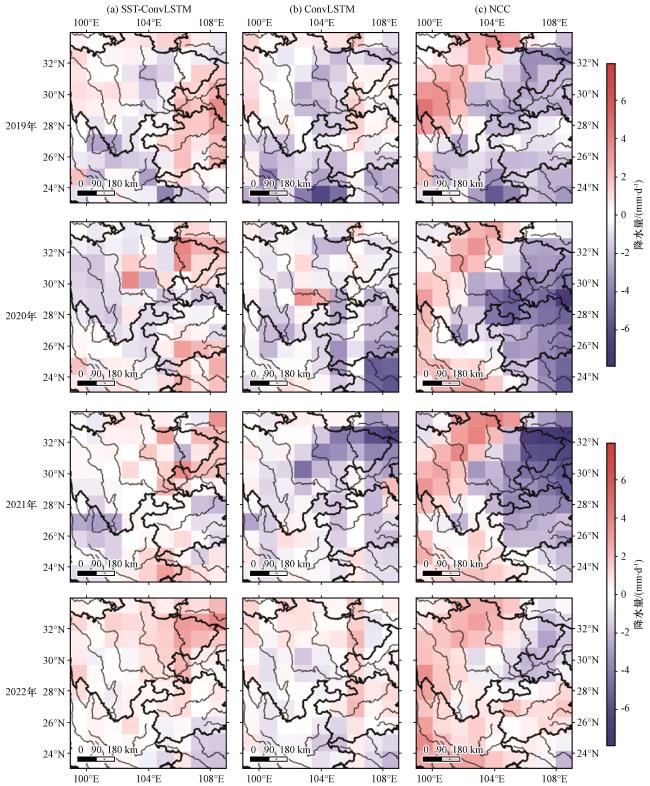
图4 三个模型2019 -2022年平均降水量预测结果绝对误差的空间分布(单位: mm·d-1)(a) SST-ConvLSTM的绝对误差, (b) ConvLSTM的绝对误差, (c) NCC的绝对误差Fig.4 Spatial distribution of absolute errors in the average precipitation forecasts from 2019 to 2022 for the three models.Unit: mm·d-1.(a) the absolute errors of SST-ConvLSTM, (b) the absolute errors of ConvLSTM, (c) the absolute errors of NCC |
3.3 模型评估
表2 三个模型的三种评估结果Tabel 2 The evaluation results for the three models are as follows |
| 模型 | 时间 | |||
|---|---|---|---|---|
| SST-ConvLSTM | 2019 | 1.333 | 1.061 | -0.058 |
| 2020 | 1.329 | 1.074 | -0.075 | |
| 2021 | 1.327 | 0.972 | -0.154 | |
| 2022 | 0.863 | 0.707 | -0.049 | |
| ConvLSTM | 2019 | 1.660 | 1.244 | 0.791 |
| 2020 | 1.744 | 1.231 | 0.918 | |
| 2021 | 1.855 | 1.328 | 1.028 | |
| 2022 | 1.120 | 0.850 | -0.501 | |
| NCC | 2019 | 2.150 | 1.850 | 0.692 |
| 2020 | 2.788 | 2.297 | 1.137 | |
| 2021 | 2.952 | 2.363 | 0.915 | |
| 2022 | 1.574 | 1.334 | -0.675 |
黑体突出表示效果最好(the best performance highlighted) |