
1 引言
珠穆朗玛峰(以下简称“珠峰”)国家级自然保护区位于青藏高原腹地的喜马拉雅山脉中段, 是全球冰川积雪最为密集的地区之一, 也是亚洲水塔的核心区域。由于该区域地形复杂、 受强烈的海陆相互作用及广泛分布的冰川河流和积雪的影响, 形成了独特的大气环流系统和气候环境特征, 成为研究高原山地特殊大气过程与生态环境变化的天然实验室(Ma et al, 2023)。为更全面地理解珠峰地区的气候变化及其对全球的影响, 科学家们建立了该地区特殊大气过程与环境变化的观测网络。这一网络显著提升了对该区域天气、 气候及其变化的观测能力, 为气候模型的开发和遥感监测提供了宝贵的数据支持(Ma et al, 2023)。
珠峰及其周边地区正经历显著的气候变化, 这不仅对当地生态系统和人类健康带来复杂的风险, 还引发了地质灾害, 影响当地居民和游客的安全(Miner et al, 2020)。气候变化导致该区域出现显著的升温趋势、 降水模式的变化及冰川融化, 这些变化不仅威胁珠峰地区本身, 还可能通过影响全球海平面上升, 对全球其他地区产生深远影响(Khadka et al, 2023)。因此, 珠峰地区不仅受到气候变化的直接影响, 也可能成为全球气候系统变化的重要指示器, 其变化对全球气候模式的研究具有重要的参考价值(Matthews et al, 2020)。
研究珠峰地区的能量交换过程对气候变化的追踪具有重要意义。珠峰地区的能量交换复杂多样, 受大气边界层结构、 地表特性及海拔的显著影响(Ma et al, 2020)。研究表明, 该地区的能量交换不仅包括辐射和对流等传统机制, 还受到冰川风等特殊气象现象的强烈调控(Huang et al, 2022)。不同海拔和下垫面条件对能量交换的影响也存在显著差异, 例如, 在珠峰地区, 白天以感热通量为主, 而在其他观测站, 潜热通量则占据主导地位, 这些差异反映了地表类型和气候条件对能量交换的深远影响(Jacobi, 2012)。
辐射观测在珠峰地区的能量交换研究中起到了关键作用, 同时也为揭示冰川-大气相互作用机制提供了重要数据支持(Bridges and Mielke, 1996)。珠峰站独特的高海拔地理位置使其成为研究复杂辐射传输过程的理想观测场所(马伟强等, 2023)。辐射是该区域生态系统碳循环和能量平衡的关键驱动力, 准确把握该区域辐射现状及其动力学机制意义重大。珠峰站长期持续的辐射观测不仅是研究大气环流、 气溶胶特性和冰冻圈变化的重要数据源, 还为提高全球气候模式的模拟精度提供了宝贵的数据支持(Ma et al, 2023)。此外, 深入了解辐射场对当地生态系统的影响, 将为制定高原地区环境保护战略奠定科学基础。珠峰高海拔地区的特殊自然环境也为开展空间环境效应和航天生物育种等相关研究提供了有利条件(Liu et al, 2022)。
然而, 现有的珠峰地区辐射观测研究主要集中在特定时段或局部区域, 缺乏时间连续性和空间覆盖广度, 对辐射场时空分布规律及其驱动机制的认知存在不确定性。此外, 辐射在高原特殊地形条件下的传输规律仍有待深入探讨, 与大尺度环流系统的动力和热力耦合机制尚未完全阐明。准确量化该独特区域辐射的输送和分配过程, 对于全面理解其对局地环境和生态的影响至关重要。
为弥补上述不足, 深入认识高原复杂地形和地表特征下的地气能量和水分交换特征, 我们在珠峰地区不同下垫面上沿绒布河谷建立了涵盖冰川、 高寒砾石、 高寒灌丛、 高寒湿地、 高寒荒漠草原等主要地理生态单元的气象梯度观测网络(图1), 获取了详细的多年连续实测数据(马伟强等, 2023)。本研究将基于这一珍贵资料, 全面分析珠峰地区辐射场的基本特征和变化规律, 厘清影响因素, 为相关科学研究提供坚实的观测基础和新的认知视角, 旨在为全球变化研究、 气候模型改进和高海拔环境效应等领域作出贡献。
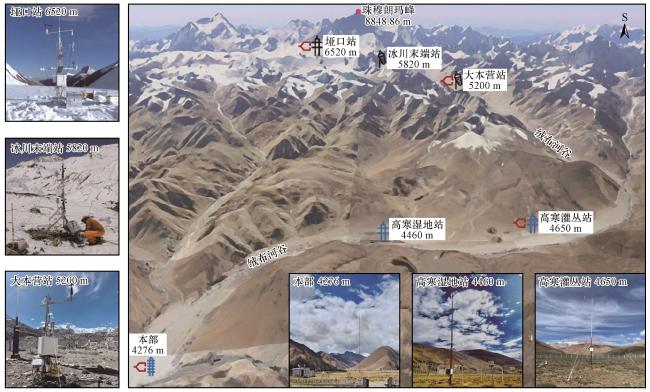
图1 珠峰地区多圈层地-气相互作用综合观测网络野外站点空间分布(Ma et al, 2023)Fig.1 Spatial distribution of the comprehensive observation network for land-atmosphere interaction in the Everest Region (Ma et al, 2023) |
2 数据来源与方法介绍
2.1 研究区概述
珠穆朗玛峰国家级自然保护区位于西藏自治区日喀则地区, 地处喜马拉雅山脉中段(28°21′N - 28°36′N, 86°32′E -87°08′E), 是世界海拔最高的自然保护区。该区域总面积达53, 633 km2, 平均海拔超过5000 m, 地貌复杂多样, 由高山、 山谷、 河流、 冰川等多种地形单元组成, 体现了高原山地环境的独特风貌。主要山峰包括海拔8844.43 m的珠穆朗玛峰、 8516 m的罗琺峰、 8201 m的卓奥友峰等。地表覆盖着大面积的现代冰川, 总面积约占珠峰保护区一半(Liu et al, 2022)。主要河流有雅鲁藏布江等, 贯穿峡谷, 最终汇入恒河(Yao et al, 2023; Liu et al, 2022)。珠峰地区属典型的高原大陆性气候, 年均气温仅为-3.5 ℃(Ghimire et al, 2023)。7 -9月平均气温为5~8 ℃, 而1 -3月平均气温为-16 ℃(Khadka et al, 2023), 最低气温可达-40 ℃; 年降水量为465 mm, 但分布极不均匀, 其中6 -9月占年降水量的90%(Salerno et al, 2023)。这种高海拔、 低温少雨的极端环境导致该区域生物多样性较低, 生态系统十分脆弱(Chen et al, 2022; Xu et al, 2023)。
珠峰本站作为本研究辐射分析的核心站点, 位于绒布谷下游, 海拔4276 m。该站点地势平坦, 地表覆盖大量沙砾, 植被稀疏。为全面监测湿地和灌丛环境中的辐射条件, 研究选定了珠峰高寒湿地站(海拔4460 m)和珠峰高寒灌丛站(海拔4650 m)作为观测点。两个站点均位于地势平坦的区域, 适合进行典型生态系统下陆地与大气相互作用的观测, 也是是代表性辐射分析的重要类型(图1)。
2.2 辐射观测设备与技术介绍
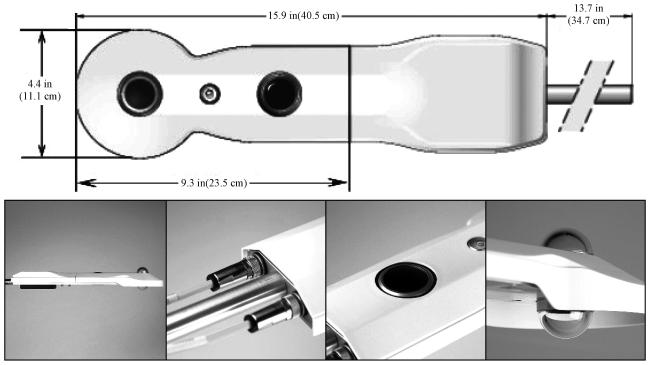
2019年之前, 珠峰站使用CNR1辐射计, 随后升级为CNR4(图2)。CNR4由向上和向下的光度计及红外辐度计对组成, 用于测量短波和长波辐射。其视场从CNR1的150°提升至接近180°, 显著增强了观测范围。4个传感器直接集成在仪器本体内, 均经过单独校准, 确保了高精度。系统还集成了两个温度传感器, 用于校正壳体温度对红外读数的影响, 进一步提高长波辐射测量的准确性。CNR4设计轻便, 配有集成遮阳罩和加热装置, 有效降低了热效应和结霜对测量的干扰。设备电缆采用黄色防水连接器, 安装杆可拆卸以便运输。结构紧凑的设计确保了空气流动覆盖穹顶和窗户, 减少露点形成和清洁频率。这些特性使CNR4能够在高海拔恶劣环境中长期稳定运行。与CNR1相比, CNR4在设计上做了多方面优化, 如改进的曲面辐射罩和集成太阳遮挡板, 大幅提升了长波辐射测量精度, 并减少了水滴聚集的影响。此外, 珠峰高寒灌丛站和高寒湿地站使用的是NR01辐射计。NR01在响应时间和准确性方面表现优异, 但设计相对传统、 重量较大, 需要额外的安装结构来确保测量稳定性。综上, CNR4凭借其轻量化设计、 长波测量精度和集成加热装置等显著优势, 成为极端环境下科学研究的首选仪器。
2.3 数据采集与处理方法
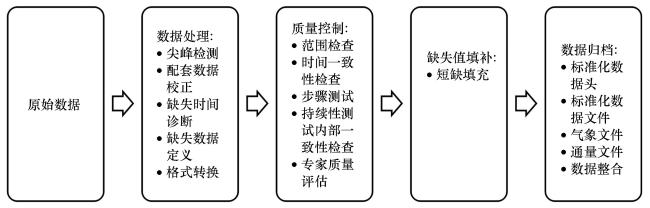
为了获取珠峰地区高质量的原位四分量辐射通量观测数据集, 本研究特别设计了一系列自动化后处理算法, 并辅以人工评估, 用于对该辐射观测网络数据进行处理。整个处理流程可分为数据处理、 质量控制、 缺失值填补和数据归档4个主要环节(图3)。
2.3.1 数据处理
在数据处理环节, 首先对原始四分量辐射通量数据进行初步处理, 包括诊断和处理缺失时间段、 格式转换等。所有原始数据均经过尖峰值检测、 尖峰值去除、 趋势去除, 并依据Ma et al(2020, 2023)和Liu et al(2023)提出的方法, 对辐射数据进行校正, 并诊断了所有数据序列的时间连续性。在进行后续处理前, 缺失值用NAN或-9999表示, 最终用9999.9指示缺失数据, 并将负值校正为0。由于数据合并到共同格式是关键步骤, 本研究生成的输出文件采用通用ASCII逗号分隔值(CSV)文件格式。
2.3.2 数据质量控制
在复杂环境中的微气象观测中, 实施严格的质量控制至关重要。由于青藏高原独特的气候特征以及陆-大气相互作用观测网络的布局, 在之前发布的数据集中(Ma et al, 2020)发现了一些实际问题, 传统的质量控制技术未能完全解决。为确保数据的可靠性, 本研究设计了一套自动处理方案, 针对四分量辐射通量数据, 旨在验证观测的可靠性并检测错误和可疑观测值。该自动数据质量控制算法通过一系列顺序检查构建, 重点关注观测数据的连续性及与其他气象要素场之间的一致性, 从而识别可疑的观测结果。
首先是范围检查, 确认观测数值是否在合理范围内。在青藏高原恶劣的自然环境中, 异常值的出现较为普遍, 可能由于环境条件突变、 仪器波动或数据记录仪故障等原因引起。未通过范围检查的数据点将被标记为错误(QC评分为2)。本研究使用的范围限定值保持不变, 并根据传感器硬件规格说明和理论极限值进行了微调, 以确保结果的准确性。
接下来是时间性检查, 用于评估站点数据时间序列变化的合理性。本文使用了持久性测试和步进测试来检测数据的时间连续性。持久性测试用于检验连续数值是否满足最低差异要求, 以发现传感器阻塞或仪器故障导致的“平缓区域”; 步进测试则用于发现天气条件改变引起的不合理数值跳跃。由于地表辐射的波动性, 文中未对其执行类似测试。持久性测试中, 目标变量连续24 h以上保持不变的数据将被标记为错误(QC标志2); 步进测试基于标准偏差阈值进行, 通过移动平均值计算数据序列的标准偏差, 并与平均值进行比较, 差异超过3倍标准偏差的数据将被视为可能错误并标记为2。
内部一致性检查用于识别偏离两个参数之间正常气象关系(或同一变量在不同高度之间的关系)的观测值。四分量辐射通量观测值与三维超声风速仪及其配套通量设备同步检查, 以确保内部一致性。此外, 如果四分量辐射通量数值连续12 h保持不变, 可能是由于极端寒冷温度导致传感器卡住、 辐射罩模糊或数据记录仪故障, 在青藏高原某些站点偶尔会观察到这种情况。
最后是人工质量评估, 它为质量保证专家提供关键信息, 帮助确定需要进一步分析的数据。即使所有数据点在可接受范围内且无异常变化, 算法也可能无法正确诊断不准确的数据。因此, 本文仔细研究了每日昼夜循环、 各变量长期变化的最小值、 平均值、 最大值及标准差等季节性特征。通过将可疑数值与其他相关变量或同一变量在不同高度或深度的观测值进行比较, 来评估这些数值的可靠性, 并对数据点进行人工调整QC代码。
2.3.3 缺失值填补
对于被标记为可疑、 错误或缺失的所有数据点, 如果连续非零QC标志数量少于3个, 则应用线性时间插值法进行填补。由于重建方法的效果依赖于数据间隙的长度, 文中仅插补短暂间隙。尽管复杂方法如概率填充和人工神经网络可能在填补长时间缺失间隙时表现更好, 但本研究仍采用简单有效的线性插补方法。
2.3.4 数据归档
在数据归档步骤中, 首先对输出文件的头部描述进行标准化, 包括变量名称、 时间和单位信息。本研究生成了两个级别的数据集。级别0数据集包含原始数据采集的每10 min或每30 min的观测值, 未经进一步处理, 可能包含时间错误和间隙。级别1数据集经过质量保证和部分缺失值填补后生成。
2.3.5 数据特点
在对辐射观测网络数据进行自动化处理并辅以人工评估后, 获取了珠峰站2006 -2019年时间间隔30 min、 2020 -2024年时间间隔10 min的四分量原位辐射观测数据, 此外还包括珠峰高寒灌丛站2016 -2024年时间间隔10 min的数据, 以及珠峰高寒湿地站2020 -2024年时间间隔10 min的数据。这些数据包括直接观测的向下短波辐射、 向上短波辐射、 向下长波辐射、 向上长波辐射和净辐射, 以及一系列配套的气象参数数据, 如土壤表层温度、 土壤深层温度和地表温度等。数据中的异常值和缺失值占比低于总数据量的10%, 保证了多年长时间、 高频率的原位辐射观测的准确性和可靠性。
3 结果与分析
3.1 珠峰地区辐射年平均变化
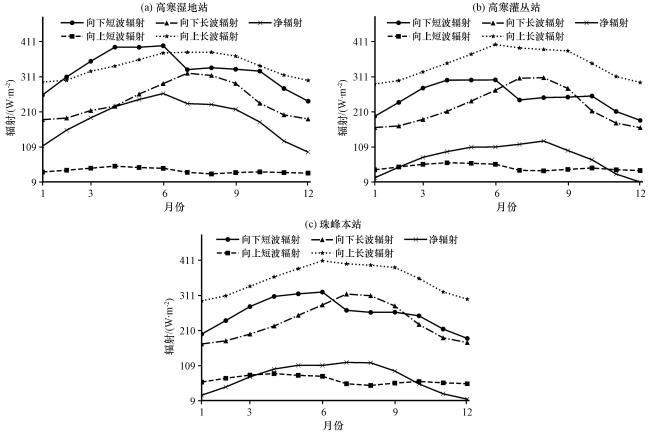
3.2 珠峰地区辐射多年月平均变化
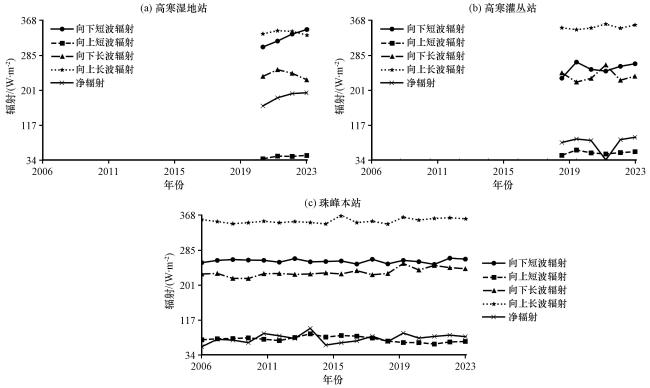
从不同观测站点的多年月平均变化曲线(图5)来看, 四种辐射通量均表现出明显的季节性循环规律。以珠峰本站[图5(c)]为例, 四分量辐射通量在6 -8月达到峰值, 其中净辐射通量的峰值约为120 W·m-2; 11月至次年1月处于最低谷值, 净辐射通量的谷值约为30 W·m-2。这种变化与太阳赤道高度角和大气透明度的季节性变化密切相关(Yıldız, 2018)。夏季太阳高度角较大, 日照时间延长, 短波辐射强度较高; 而冬季则相反。长波辐射主要受大气温度和云量的影响(Kejna et al, 2021)。尽管不同站点的年内变化趋势相似, 但幅度存在显著差异。珠峰本站[图5(c)]与高寒灌丛站[图5(b)]的年内变化幅度相似, 而高寒湿地站[图5(a)]的向下短波辐射通量和净辐射通量分别比其他两个站点高出约80 W·m-2和1200 W·m-2。总体而言, 高寒湿地站[图5(a)]的向下短波辐射通量最大, 而珠峰本站[图5(c)]的向下长波辐射通量、 向上长波辐射通量和净辐射通量最大。这反映了下垫面类型差异对辐射通量的显著影响。湿地较浅的水体对短波辐射有较强的反射作用, 而植被覆盖密集的站点则具有较高的长波辐射和净辐射, 这与Seyednasrollah et al(2013)的研究结果一致。
3.3 珠峰地区辐射多年夏季、 冬季日平均变化
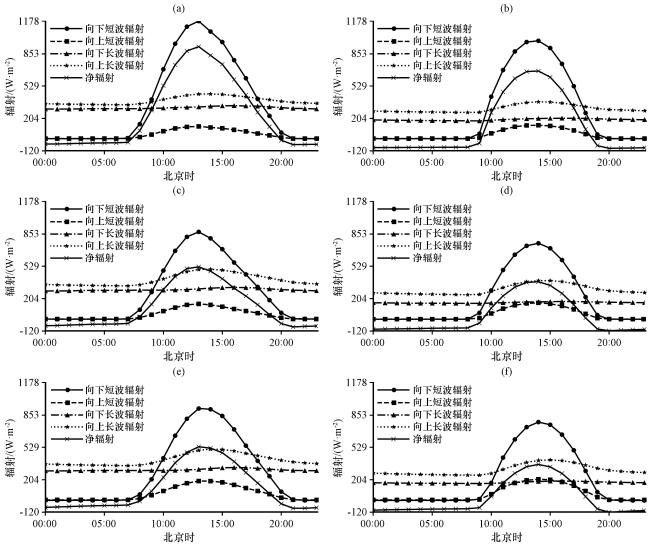
从多年日平均变化曲线(图6)可以看出, 四种辐射通量在正午前后达到最大值, 且夏季的峰值显著高于冬季。在夏季, 高寒湿地站[图6(a)]的向下短波辐射通量峰值约为1180 W·m-2, 比其他两个站点高出约310 W·m-2, 净辐射通量峰值约为900 W·m-2, 比其他两个站点高出约380 W·m-2。高寒灌丛站[图6(b)]和珠峰本站[图6(c)]的四分量辐射通量从07:00(北京时, 下同)左右开始明显增加, 并在14:00左右达到峰值, 向下短波辐射通量峰值约为880 W·m-2, 净辐射通量峰值约为520 W·m-2。冬季时, 高寒湿地站[图6(d)]的向下短波辐射通量峰值约为1000 W·m², 比其他两个站点高出约240 W·m-2, 净辐射通量峰值约为680 W·m-2, 比其他两个站点高出约300 W·m-2。在珠峰本站[图6(c)], 夏季的向下短波辐射通量峰值比冬季高约190 W·m-2, 净辐射通量峰值比冬季高约220 W·m-2。冬季时, 高寒灌丛站[图6(e)]和珠峰站[图6(f)]的四分量辐射通量的增长时间和峰值时间均比夏季滞后约1 h, 其中向下短波辐射通量峰值约为760 W·m-2, 较夏季降低约120 W·m-2, 净辐射通量峰值约为380 W·m-2, 较夏季降低约140 W·m-2。这种变化与太阳赤道高度角的日变化和气候季节变化一致。此外, 由于大气折射作用, 日出和日落时段的辐射值略有延迟。不同站点的日内变化趋势虽有相似之处, 但幅度存在显著差异。
图6 辐射通量多年夏季(a, b, c)、 冬季(d, e, f)日平均变化图(a)、 (d)高寒湿地站, (b)、 (e)高寒灌丛站, (c)、 (f)珠峰本站 Fig.6 Annual average daily variation charts of radiation flux for summer(a, b, c) and winter(d, e, f).(a)、 (d) High-altitude Wetland Station, (b)、 (e) High-altitude Cold Bush Station, (c)、 (f) Mount Everest Station |
4 讨论
在讨论珠峰地区的辐射观测研究时, 以往的工作多局限于单点短期观测, 这限制了对该区域辐射场时空分布特征的全面理解(Zhang et al, 2019)。本研究通过建立覆盖多种典型地理单元的梯度观测网络, 获取了长时间序列的高质量原位观测数据, 能够较为完整地刻画出该区域辐射通量的总体分布格局及其日、 年、 季节等不同尺度的变化规律。同时, 文中探讨了影响辐射场特征的主导因素, 弥补了以往研究的不足。为了确保数据的高精度和可靠性, 本研究建立了一整套自动化数据质量控制和处理流程, 为后续的深入分析研究奠定了基础。
从年际变化趋势来看, 本研究中观测到的珠峰地区各站点四分量辐射通量的年际变化相对平稳, 特别是本部站和高寒灌丛站, 其向下短波辐射通量以每年0.1 W·m-2的速率增加, 向上长波辐射通量以每年0.5 W·m-2的速率增加, 净辐射通量的增加速率为每年0.7 W·m-2。这些趋势与Shi and Liang(2013)对青藏高原地表辐射收支的研究结果相吻合, 他们也观察到净辐射通量的逐年增长, 并指出这些变化与大气和地表条件的年际波动密切相关。然而, 在向上长波辐射通量的变化趋势方面, 本研究显示出一个持续的增长趋势, 而这一现象在文献中并未被广泛报道, 这可能与观测方法、 站点位置和数据处理方法的差异有关。
在季节性变化方面, 本研究发现, 不同观测站点的四分量辐射通量均表现出明显的季节性变化规律, 尤其在6 -8月期间, 所有站点的辐射通量达到峰值, 这与青藏高原及其周边区域的太阳辐射季节性变化特点相一致(Zhao et al, 2020)。夏季, 由于太阳赤道高度角的增加和日照时间的延长, 短波辐射显著增加; 相反, 冬季的辐射通量达到最低谷值。本研究进一步观察到, 净辐射通量的峰值和谷值分别出现在夏季和冬季, 这种季节性变化模式与太阳辐射的日变化和大气透明度的季节性变化密切相关(Yao et al, 2023; Shi and Liang, 2013)。
在不同观测站点之间, 显著的辐射通量差异尤为突出。高寒湿地站的向下短波辐射通量高出约310 W·m-2, 净辐射通量则高出约380 W·m-2, 这与Ma et al(2003)的研究相一致, 他们利用卫星遥感数据和地面观测数据发现, 由于下垫面的差异, 各站点的辐射通量表现出显著的空间变化, 尤其是短波辐射通量在湿地和其他类型下垫面之间的差异非常明显。然而, 本研究中观察到的高寒湿地站的辐射通量差异幅度较大, 这在现有文献中并未被广泛报道。这种差异可能与观测时段、 站点条件和数据处理方法的不同, 以及气候变化的区域性影响有关。此外, 三个研究站点海拔不同, 也会对辐射分析造成影响, 例如, 研究发现在高海拔地区下行长波辐射对水分和云变化的敏感性, 发现这种敏感性在冬季最高, 在夏季最低; Chen et al(2014)进一步比较了两个高海拔站点的下行长波辐射对水汽变化的敏感性, 指出在高海拔地区, 这种敏感性更高, 尤其是在夜间; Feng et al(2020)通过机器学习方法对高海拔和低海拔站点的辐射估算进行了评价, 发现这些方法在不同海拔站点均表现良好。
当前的工作为进一步深化珠峰辐射观测的认识奠定了基础。然而, 由于站点分布的限制, 目前观测点位尚无法完全覆盖整个珠峰地区复杂的地形地貌单元。未来研究需要进一步扩充和完善珠峰地区的梯度观测网络, 增加更多代表性地理单元的覆盖, 开展多源数据同化分析, 综合气象、 遥感等信息, 系统厘清影响辐射场的各种环境要素及其协同效应。此外, 结合区域气候模式研究, 提高对该特殊区域辐射环境的模拟能力, 以及探索先进的卫星遥感等技术手段, 实现时空连续的三维辐射场遥感监测。
在研究辐射对环境与生物影响机制时, 辐射场的变化对珠峰地区的冰冻圈、 生态系统和局地气候可能产生重要影响。例如, 净辐射的减小可能减缓冰雪消融和生物生长, 而增强的短波辐射则可能带来相反效应(Wei et al, 2022)。长时间的观测和模拟分析评估将是理解这些影响的关键。总结来说, 珠峰地区辐射场的变化趋势不仅反映了该区域正在发生的环境演变, 也揭示了其潜在的生态与气候影响, 这些问题的深入研究对于全面揭示和理解珠峰地区的环境变化至关重要(Ma et al, 2019)。
5 结论
本研究针对青藏高原珠峰地区独特的地形地貌与气候环境, 构建了涵盖冰川、 砾石、 灌丛、 湿地和草原等主要地理生态单元的梯度观测网络, 获得了多年连续的辐射观测数据。通过系统分析, 该研究揭示了珠峰地区辐射场的时空变化规律, 全面阐明了各辐射分量的日、 月、 年变化特征, 并探讨了这些周期性变化背后的主导因子及其物理机制, 为解析该特殊环境下复杂的辐射传输过程提供了重要参考。此外, 本研究通过环境与生物活动的耦合分析, 初步探讨了该地区辐射变化对生态系统和气候环境的潜在影响。研究过程中, 建立了先进的自动化辐射观测系统及数据质量控制程序, 为获取高质量的珠峰地区辐射数据提供了重要保障, 有效弥补了该领域现有研究的不足。此研究不仅为深入理解该独特区域的辐射场特征及其对局地生态环境的影响奠定了坚实基础, 也为提升全球气候模式在高原地区的模拟能力, 探究高原大气边界层结构与通量交换过程等重大科学问题提供了宝贵的观测依据。通过系统分析, 本研究得出了以下重要结论:
(1) 珠峰地区辐射通量表现出显著的年平均、 年内及日内规律性变化。净辐射通量年平均约为70 W·m-2; 年内净辐射通量在6 -8月达到峰值(约120 W·m-2), 在11月至次年1月降至低谷(约30 W·m-2); 夏季净辐射通量在13:00左右达到日内峰值(约520 W·m-2), 冬季则在14:00左右达到峰值(约330 W·m-2)。夏季净辐射通量的显著增加时间为07:00, 较冬季提前约2 h; 夏季夜间净辐射通量稳定时间为21:00, 较冬季推迟约2 h。这些变化与太阳赤道高度角的年变化及大气透明度的季节性差异密切相关。
(2) 不同地表类型与海拔对辐射通量的影响显著, 珠峰地区复杂多变的地形导致了局地辐射场分布的较大差异。具体表现为, 不同观测站点的辐射通量存在一定差异, 尤其在峰值时段差异更加明显。高寒湿地站的净辐射通量年平均约为183 W·m-2, 比其他站点高出约110 W·m-2; 年内峰值约为240 W·m-2, 较其他站点高出约120 W·m-2; 夏季日内峰值约为920 W·m-2, 高出其他站点约350 W·m-2; 冬季日内峰值约为630 W·m-2, 比其他站点高出约150 W·m-2。