
1 引言
2 资料来源与方法介绍
2.1 区域概况
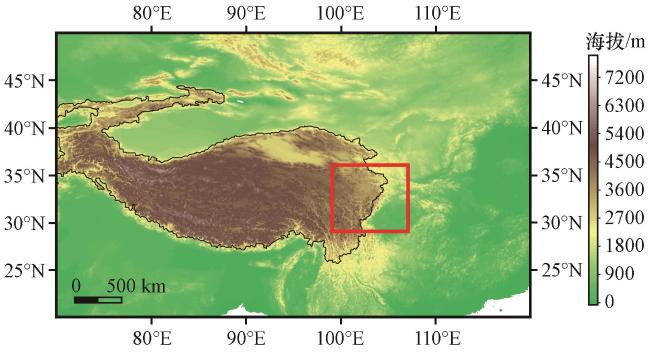
图1 青藏高原东坡范围和地形高度图红色框区域为青藏高原东坡(下同), 黑色等值线区域为青藏高原2500 m等高线 Fig.1 Terrain and elevation of the eastern slope of the Qinghai-Xizang Plateau.The red box area represents the eastern slope of the Qinghai-Xizang Plateau (the same as after), while the black contour line indicates the 2500-meter elevation contour of the Qinghai-Xizang Plateau |
2.2 观测和模式数据
表1 16个HighResMIP模式的基本信息Table 1 Basic information of 16 CMIP6 HighResMIP models |
| 单位(所属国家/地区) | 模式名称 | 分辨率(格点数) |
|---|---|---|
| BCC(中国) | CSM2-HR | 800×400 |
| CMCC(意大利) | CMCC-CM2-HR4 | 288×192 |
| CMCC(意大利) | CMCC-CM2-VHR4 | 1152×768 |
| ECMWF(欧洲中心) | ECMWF-IFS-HR | 1600 ×800 |
| ECMWF(欧洲中心) | ECMWF-IFS-LR | 800×400 |
| ECMWF(欧洲中心) | ECMWF-IFS-MR | 800×400 |
| CAS(中国) | FGOAL-f3-H | 1440×720 |
| GFDL(美国) | GFDL-CM4C192 | 720×360 |
| MOHC(英国) | HadGEM3-GC31-HH | 1024×768 |
| MOHC(英国) | HadGEM3-GC31-HM | 1024×768 |
| MOHC(英国) | HadGEM3-GC31-LL | 192×144 |
| MOHC(英国) | HadGEM3-GC31-MM | 432×324 |
| HiRAM(中国台湾) | HiRAM-SIT-HR | 1536×768 |
| HiRAM(中国台湾) | HiRAM-SIT-LR | 768×384 |
| INM(俄罗斯) | INM-CM5-H | 540×360 |
| MPI(德国) | MPI-ESM1-2-HR | 384×192 |
2.3 研究方法
3 结果与分析
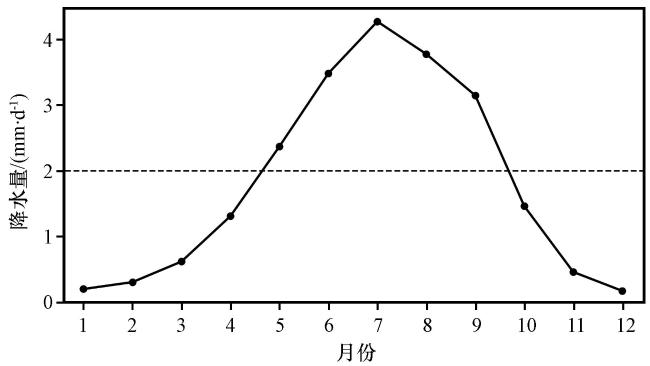
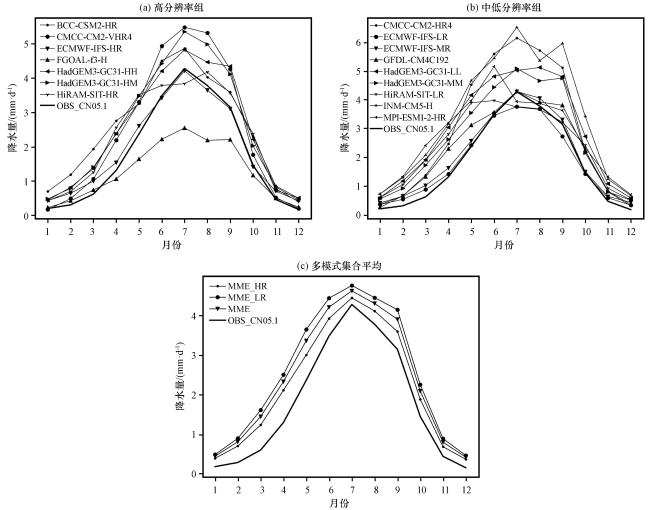
3.1 青藏高原东坡降水时间变化特征
3.2 模式平均降水空间分布和偏差
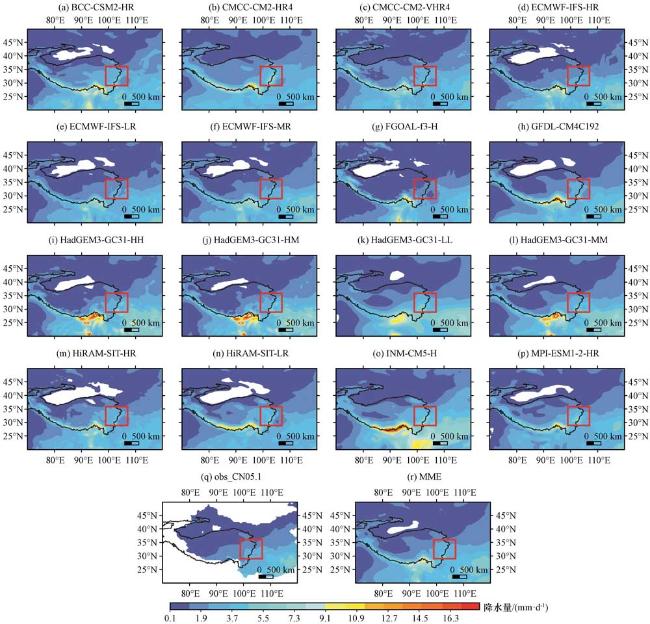
图4 HighResMIP模式(a)~(p)、 观测数据(q)以及多模式集合平均(r)1995 -2014年暖季平均降水分布(单位: mm·d-1)Fig.4 The warm-season monthly mean precipitation distribution from HighResMIP models (a)~(p), observational data (q), and the multi-model ensemble mean (r) over 1995 -2014.Unit: mm·d-1 |
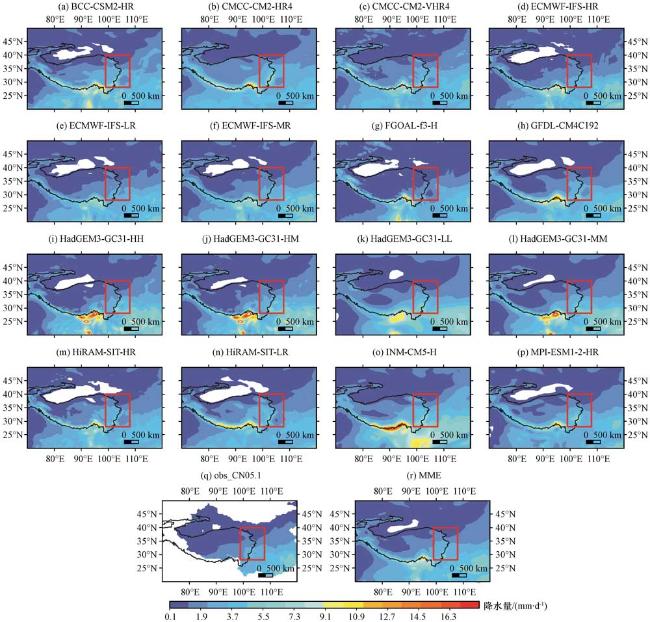
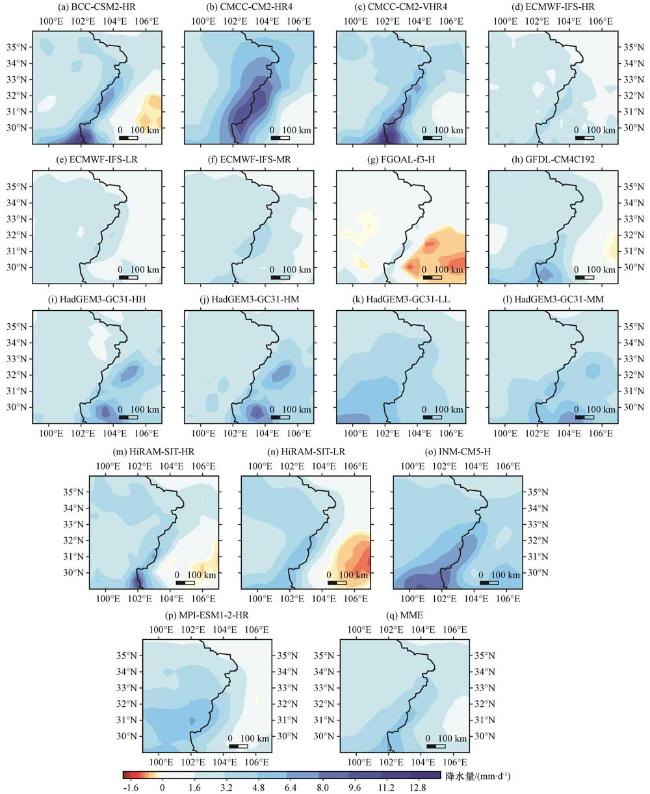
图6 1995 -2014年青藏高原东坡暖季平均降水的HighResMIP模式(a~p)以及多模式集合平均(q)相较于观测偏差(单位: mm·d-1)Fig.6 Warm-season mean precipitation biases relative to observations during 1995 -2014 over the eastern slope of the Qinghai-Xizang Plateau from HighResMIP models (a~p) and multi-model ensemble mean (q).Unit: mm·d-1 |
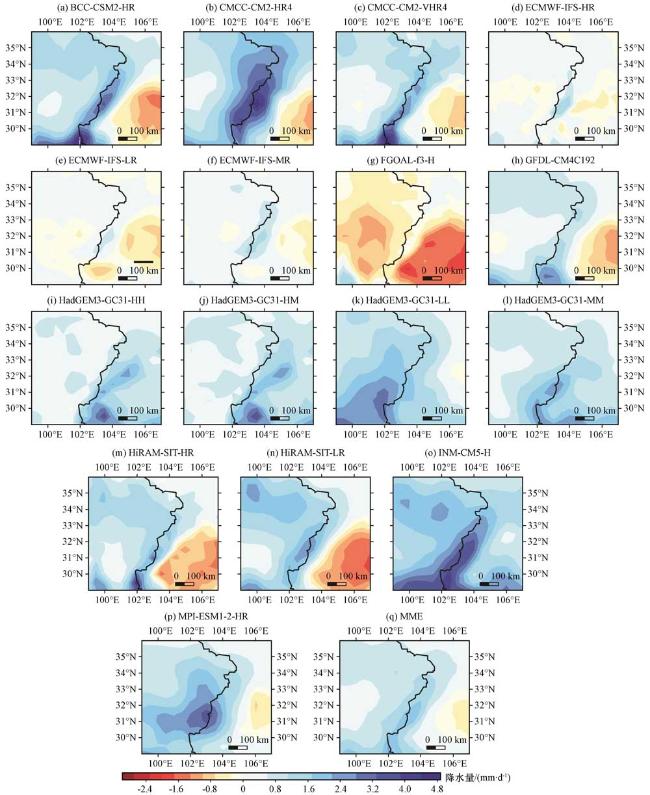
图7 1995 -2014年青藏高原东坡年平均降水的HighResMIP模式(a~p)以及多模式集合平均(q)相较于观测偏差(单位: mm·d-1)Fig.7 Annual mean precipitation biases relative to observations during 1995 -2014 over the eastern slope of the Qinghai-Xizang Plateau from HighResMIP models (a~p) and multi-model ensemble mean (q).Unit: mm·d-1 |
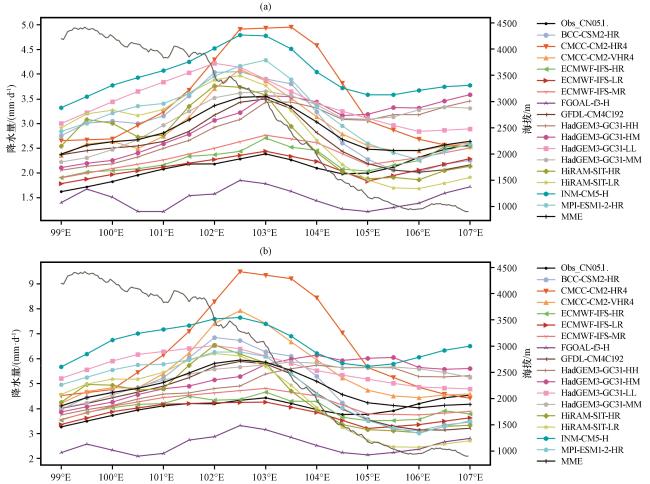
图8 1995 -2014年青藏高原东坡年平均降水(a)和暖季降水(b)经向平均剖面图(单位: mm·d-1)灰色实线为区域的经向平均海拔 Fig.8 Meridional mean profiles of annual mean precipitation (a) and warm season precipitation (b)over the eastern slope of the Qinghai-Xizang Plateau for 1995 -2014.The gray solid line represents the zonal average elevation of the region.Unit: mm·d-1 |
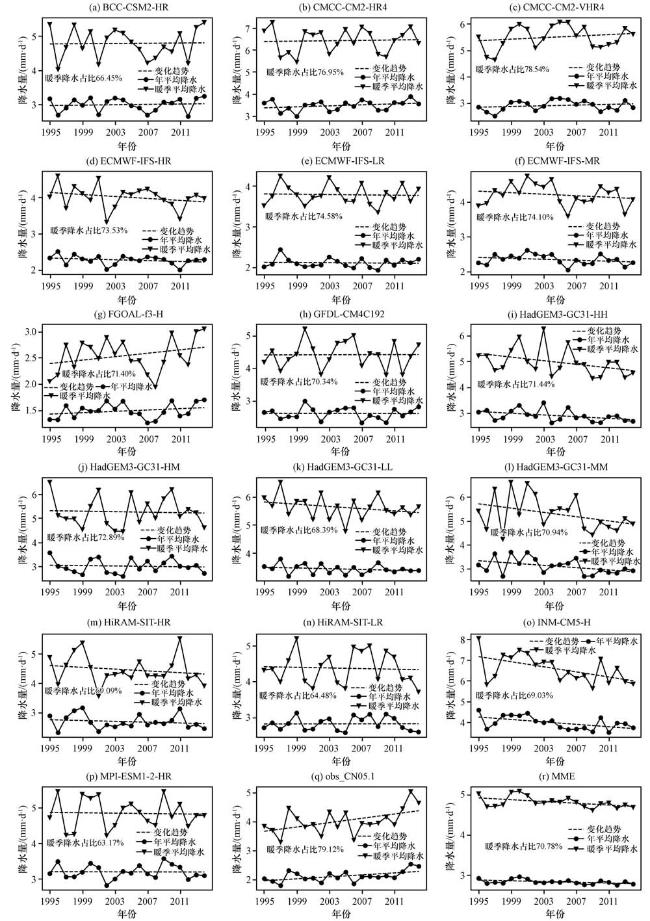
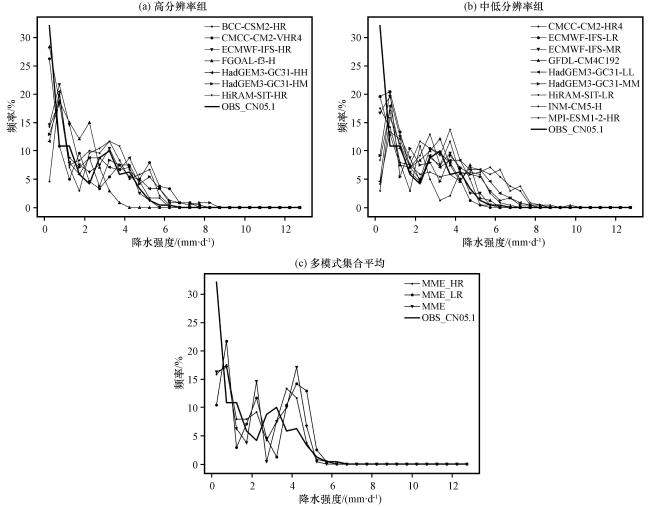
3.3 不同分辨率降水时间变化和频率分析
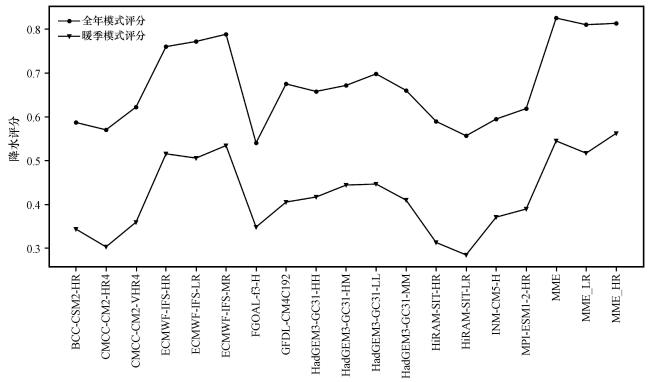
3.4 模式的泰勒图分析和模式评分
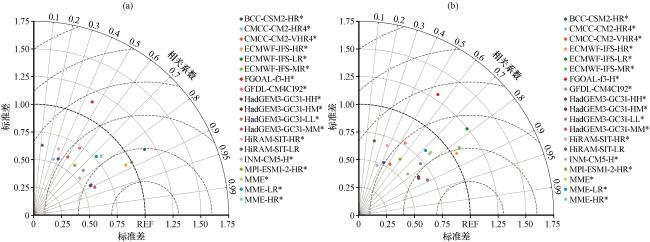
图11 青藏高原东坡 HighResMIP各模式和CN05.1观测数据年平均(a)和暖季降水(b)空间分布泰勒图*表示相关系数通过了95%显著性检验 Fig.11 Taylor diagrams for the spatial distribution of precipitation over the eastern slope of the Qinghai-Xizang Plateau comparing HighResMIP models with CN05.1 observations for annual mean(a) and warm season precipitation(b).An asterisk (*) indicates that the correlation coefficient has passed the 95% significance test |