
1 引言
2 资料来源及天气过程
2.1 西南涡加密观测科学试验和资料简介
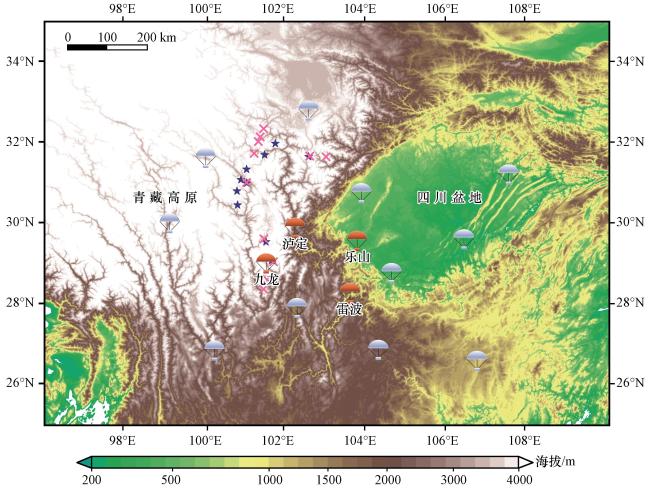
图1 西南涡加密探空试验观测站网布局示意图蓝色星星表示7月26日下投探空点, 粉色十字叉表示7月27日下投探空点; 橙色探空为科学试验加密地面探空站, 白色探空为四川及周边区域时间加密的业务探空站 Fig.1 Schematic layout of the observation station network for the Southwest Vortex intensive sounding experiment.Among them, the blue stars represent the dropsonde points on July 26, and the pink crosses represent the dropsonde points on July 27; the orange soundings denote the intensive ground-based sounding stations for the scientific experiment, while the white soundings indicate the operationally intensified temporal sounding stations in Sichuan and surrounding areas |
2.2 环流背景
2.3 降水概况
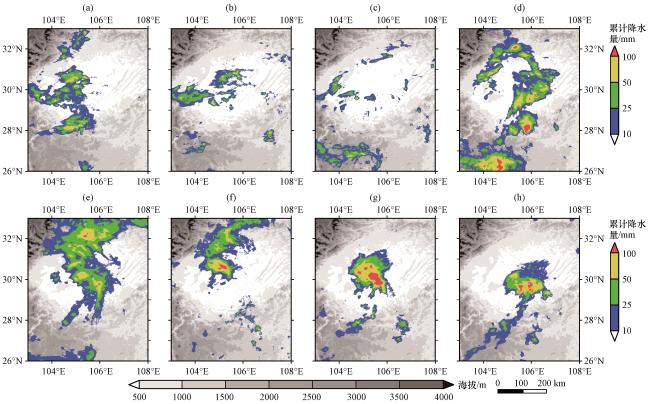
图2 “2023-07-26”过程逐6 h累计降水分布(填色, 单位: mm)灰色阴影为海拔(单位: m); 其中(a)~(h)依次为26日00:00至28日00:00逐6 h的累计降水 Fig.2 6-hour cumulative precipitation distribution in the process of “2023-07-26” (shading, unit: mm).The gray shadow is altitude (unit: m).Among them, (a)~(h) refers to the 6-hour cumulative precipitation from 00:00 on 26 to 00:00 on 28, 2023 |
3 西南涡的生命史及不同阶段的结构特征
3.1 西南涡的演变过程
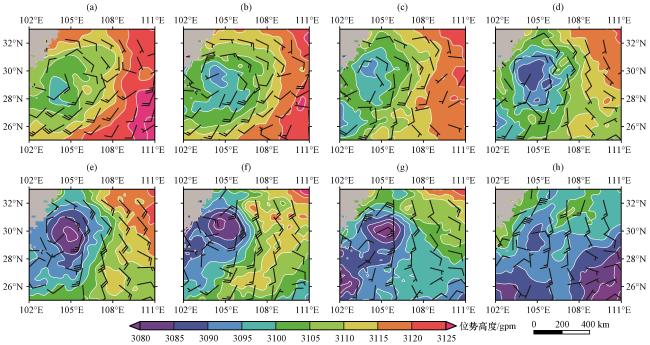
图3 “2023·07·26”过程, 700 hPa的位势高度场(填色和等值线, 单位: gpm)和风场(风羽, 单位: m·s-1)灰色阴影是地表气压低于700 hPa的区域; (a)26日00:00, (b)26日06:00, (c)26日12:00, (d)26日18:00, (e)27日00:00, (f)27日06:00, (g)27日12:00, (h)27日18:00 Fig.3 700 hPa potential height field (shading and contour, unit: gpm) and wind field (barb, unit: m·s-1) in process of “2023·07·26”.The gray shadow is the area of surface pressure below 700 hPa.(a) at 00:00 on 26, (b) at 06:00 on 26, (c) at 12:00 on 26, (d) at 18:00 on 26, (e) at 00:00 on 27, (f) at 06:00 on 27, (g) at 12:00 on 27, (h) at 18:00 on 27 |
3.2 西南涡的结构演变特征
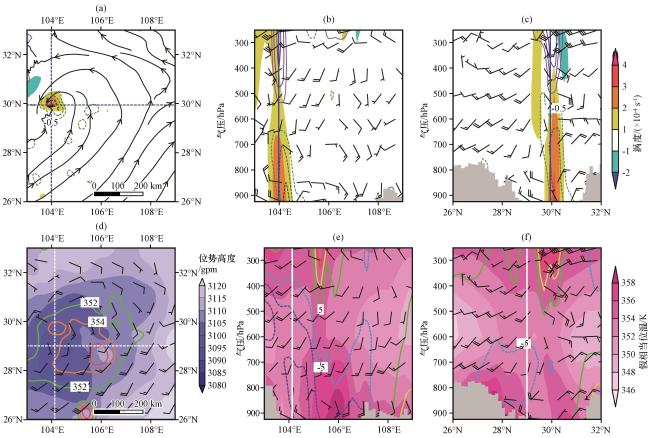
图4 西南涡初生期(26日00:00), 西南涡的水平(a, d)和垂直(b, c, e, f)结构特征(a)700 hPa风场(流线, 单位: m·s-1)和涡度(阴影, 单位: ×10⁻⁴ s⁻¹)散度(等值线, 单位: ×10⁻⁴ s⁻¹); 过气旋中心[103.99°E, 29.94°N, 即图(a)中虚线交叉点]的纬向(b)和经向(c)涡度(阴影)、 散度(等值线)和风(风羽)的垂直剖面; (d)700 hPa位势高度(阴影, 单位: gpm)、 假相当位温(等值线, 单位: K)和风(风羽, 单位: m·s-1); 过低压中心[104.13°E, 29°N, 即图(d)中虚线交叉点]的纬向(e)和经向(f)假相当位温(阴影)、 位势高度距平(等值线)和风(风羽)的垂直剖面 Fig.4 Horizontal (a, d) and vertical (b, c, e, f) structural characteristics of the southwest vortex during its nascent period (at 00:00 on the 26).(a) the 700 hPa wind field (streamlines, unit: m·s-1), vorticity (shading, unit: ×10⁻⁴ s⁻¹), and divergence (contours, unit: ×10⁻⁴ s⁻¹); Vertical cross-sections of zonal (b) and meridional (c) vorticity (shading), divergence (contours), and wind (wind barbs) passing through the vortex center [103.99°E, 29.94°N, the intersection point of the dashed lines in Fig.4(a)]; (d) The 700 hPa geopotential height (shading, unit: gpm), pseudo-equivalent potential temperature (contours, unit: K), and wind (wind barbs, unit: m·s-1); Vertical cross-sections of zonal (e) and meridional (f) pseudo-equivalent potential temperature (shading), geopotential height anomaly (contours), and wind (wind barbs) passing through the low-pressure center [104.13°E, 29°N, the intersection point of the dashed lines in Fig.4(d)] |
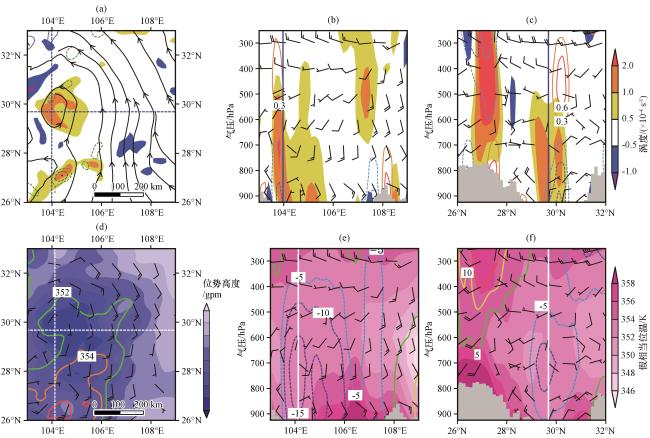
图5 西南涡发展期(26日18:00), 西南涡的水平(a, d)和垂直(b, c, e, f)结构特征(a)700 hPa风场(流线, 单位: m·s-1)和涡度(阴影, 单位: ×10⁻⁴ s⁻¹)散度(等值线, 单位: ×10⁻⁴ s⁻¹); 过气旋中心[103.99°E, 29.68°N, 即图(a)中虚线交叉点]的纬向(b)和经向(c)涡度(阴影)、 散度(等值线)和风(风羽)的垂直剖面; (d)700 hPa位势高度(阴影, 单位: gpm)、 假相当位温(等值线, 单位: K)和风(风羽, 单位: m·s-1); 过低压中心[104.13°E, 29.68°N, 即图(d)中虚线交叉点]的纬向(e)和经向(f)假相当位温(阴影)、 位势高度距平(等值线)和风(风羽)的垂直剖面 Fig.5 Horizontal (a, d) and vertical (b, c, e, f) structural characteristics of the southwest vortex during its development period (at 18:00 on the 26).(a) the 700 hPa wind field (streamlines, unit: m·s-1), vorticity (shading, unit: ×10⁻⁴ s⁻¹), and divergence (contours, unit: ×10⁻⁴ s⁻¹); Vertical cross-sections of zonal (b) and meridional (c) vorticity (shading), divergence (contours), and wind (wind barbs) passing through the vortex center [103.99°E, 29.68°N, the intersection point of the dashed lines in Fig.5(a)]; (d) The 700 hPa geopotential height (shading, unit: gpm), pseudo-equivalent potential temperature (contours, unit: K), and wind (wind barbs, unit: m·s-1); Vertical cross-sections of zonal (e) and meridional (f) pseudo-equivalent potential temperature (shading), geopotential height anomaly (contours), and wind (wind barbs) passing through the low-pressure center [104.13°E, 29.68°N, the intersection point of the dashed lines in Fig.5(d)] |
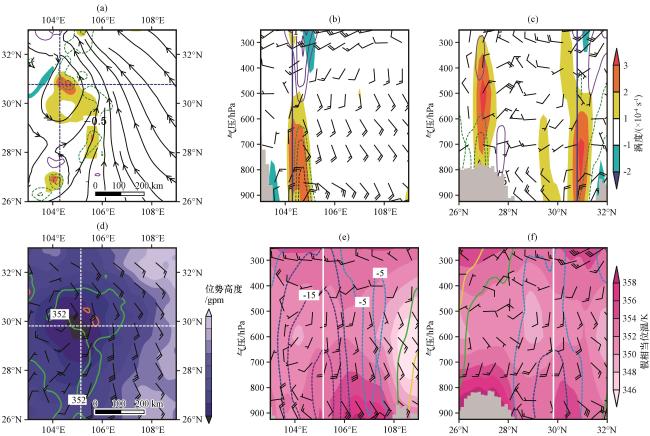
图6 西南涡鼎盛期(27日00:00), 西南涡的水平(a, d)和垂直(b, c, e, f)结构特征(a)700 hPa风场(流线, 单位: m·s-1)和涡度(阴影, 单位: ×10-4 s-1)散度(等值线, 单位: ×10-4 s-1); 过气旋中心[104.28°E, 30.78°N, 即图(a)中虚线交叉点]的纬向(b)和经向(c)涡度(阴影)、 散度(等值线)和风(风羽)的垂直剖面; (d)700 hPa位势高度(阴影, 单位: gpm)、 假相当位温(等值线, 单位: K)和风(风羽, 单位: m·s-1); 过低压中心[105.13°E, 29.82°N, 即图(d)中虚线交叉点]的纬向(e)和经向(f)假相当位温(阴影)、 位势高度距平(等值线)和风(风羽)的垂直剖面。 Fig.6 Horizontal (a, d) and vertical (b, c, e, f) structural characteristics of the southwest vortex during its strong period (at 00:00 on the 27).(a) the 700 hPa wind field (streamlines, unit: m·s-1), vorticity (shaded, unit: ×10⁻⁴ s⁻¹), and divergence (contours, unit: ×10⁻⁴ s⁻¹); Vertical cross-sections of zonal (b) and meridional (c) vorticity (shading), divergence (contours), and wind (wind barbs) passing through the vortex center [104.28°E, 30.78°N, the intersection point of the dashed lines in Fig.6(a)]; (d) The 700 hPa geopotential height (shading, unit: gpm), pseudo-equivalent potential temperature (contours, unit: K), and wind (wind barbs, unit: m·s-1); Vertical cross-sections of zonal (e) and meridional (f) pseudo-equivalent potential temperature (shading), geopotential height anomaly (contours), and wind (wind barbs) passing through the low-pressure center [105.13°E, 29.82°N, the intersection point of the dashed lines in Fig.6(d)] |
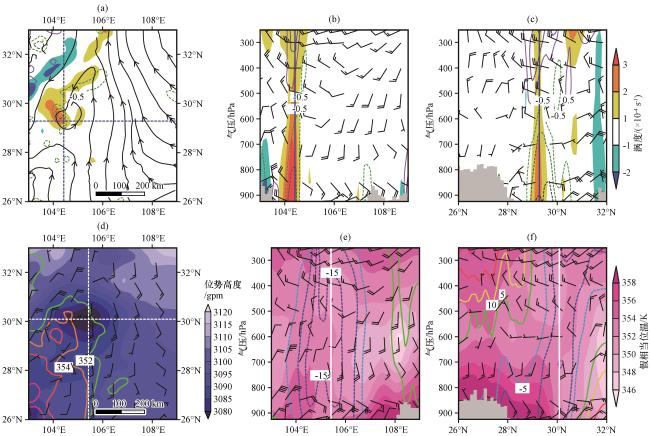
图7 西南涡维持期(27日12:00), 西南涡的水平(a, d)和垂直(b, c, e, f)结构特征(a)700 hPa风场(流线, 单位: m·s-1)和涡度(阴影, 单位: ×10-4 s-1)散度(等值线, 单位: ×10-4 s-1); 过气旋中心[104.42°E, 29.28°N, 即图(a)中虚线交叉点]的纬向(b)和经向(c)涡度(阴影)、 散度(等值线)和风(风羽, 单位: m·s-1)的垂直剖面; (d)700 hPa位势高度(阴影, 单位: gpm)、 假相当位温(等值线, 单位: K)和风(风羽); 过低压中心[105.42°E, 30.09°N, 即图(d)中虚线交叉点]的纬向(e)和经向(f)假相当位温(阴影)、 位势高度距平(等值线)和风(风羽)的垂直剖面 Fig.7 Horizontal (a, d) and vertical (b, c, e, f) structural characteristics of the southwest vortex during its maintenance period (at 12:00 on 27).(a) The 700 hPa wind field (streamlines, unit: m·s-1), vorticity (shading, unit: ×10⁻⁴ s⁻¹), and divergence (contours, unit: ×10⁻⁴ s⁻¹); Vertical cross-sections of zonal (b) and meridional (c) vorticity (shading), divergence (contours), and wind (wind barbs) passing through the vortex center [104.42°E, 29.28°N, the intersection point of the dashed lines in Fig.7(a)]; (d) The 700 hPa geopotential height (shading, unit: gpm), pseudo-equivalent potential temperature (contours, unit: K), and wind (wind barbs, unit: m·s-1); Vertical cross-sections of zonal (e) and meridional (f) pseudo-equivalent potential temperature (shading), geopotential height anomaly (contours), and wind (wind barbs) passing through the low-pressure center [105.42°E, 30.09°N, the intersection point of the dashed lines in Fig.7(d)] |
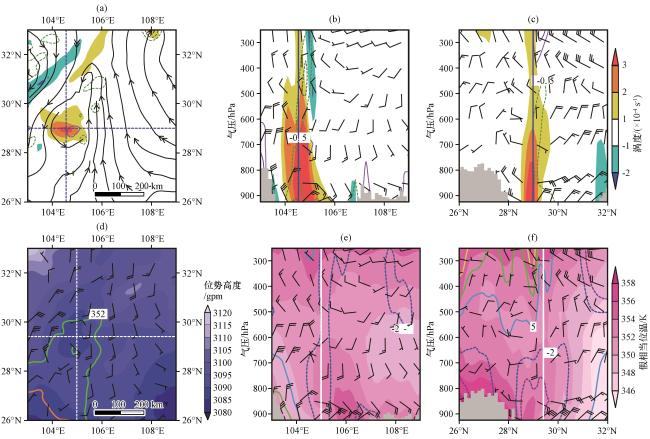
图8 西南涡衰减期(27日18:00), 西南涡的水平(a, d)和垂直(b, c, e, f)结构特征(a)700 hPa风场(流线, 单位: m·s-1)和涡度(阴影, 单位: ×10-4 s-1)散度(等值线, 单位: ×10-4 s-1); 过气旋中心[104.56°E, 29°N, 即(a)中虚线交叉点]的纬向(b)和经向(c)涡度(阴影)、 散度(等值线)和风(风羽, 单位: m·s-1)的垂直剖面; (d) 700 hPa位势高度(阴影, 单位: gpm)、 假相当位温(等值线, 单位: K)和风(风羽); 过低压中心[104.99°E, 29.41°N, 即(d)中虚线交叉点]的纬向(e)和经向(f)假相当位温(阴影)、 位势高度距平(等值线)和风(风羽)的垂直剖面 Fig.8 Horizontal (a, d) and vertical (b, c, e, f) structural characteristics of the southwest vortex during its decay period (at 18:00 on the 27).(a) the 700 hPa wind field (streamlines, unit: m·s-1), vorticity (shading, unit: ×10⁻⁴ s⁻¹), and divergence (contours, unit: ×10⁻⁴ s⁻¹); Vertical cross-sections of zonal (b) and meridional (c) vorticity (shading), divergence (contours), and wind (wind barbs, unit: m·s-1) passing through the vortex center [104.56°E, 29°N, the intersection point of the dashed lines in Fig.8(a)]; (d) The 700 hPa geopotential height (shading, unit: gpm), pseudo-equivalent potential temperature (contours, unit: K), and wind (wind barbs); vertical cross-sections of zonal (e) and meridional (f) pseudo-equivalent potential temperature (shading), geopotential height anomaly (contours), and wind (wind barbs) passing through the low-pressure center [104.99°E, 29.41°N, the intersection point of the dashed lines in Fig.8(d)] |
4 西南涡演变过程与降水时空分布
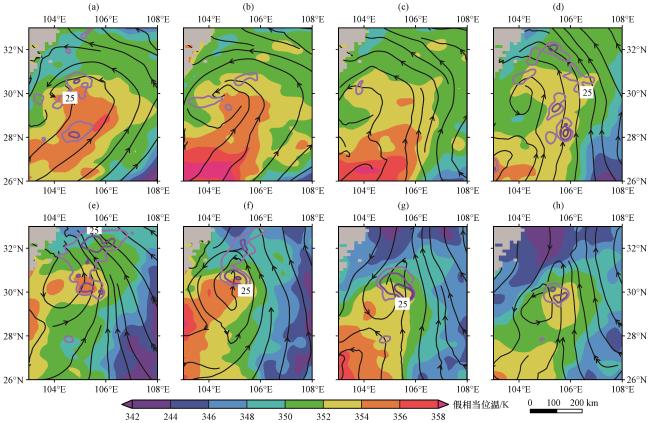
图9 “2023·07·26”过程700 hPa相邻2个时次平均的假相当位温(填色, 单位: K)、 风场(流线, 单位: m·s-1)和累计雨量(等值线, 单位: mm)(a) 26日00:00 -06:00, (b) 26日06:00 -12:00, (c) 26日12:00 -18:00, (d) 26日18:00至27日00:00, (e) 27日00:00 -06:00, (f) 27日06:00 -12:00, (g) 27日12:00 -18:00, (h) 27日18:00至28日00:00; 灰色阴影为地表气压低于700 hPa区域 Fig.9 The average pseudo-equivalent potential temperature (shading, unit: K), wind field (streamline, unit: m·s-1) on the 700 hPa and accumulated precipitation (contour, unit: mm) of the two adjacent times of the "2023·07·26" process.(a) 00:00 - 06:00 on 26, (b)06:00 -12:00 on 26, (c) 12:00 -18:00 on 26, (d) 18:00 on 26 to 00:00 on 27, (e) 00:00 - 06:00 on 27, (f) 06:00 -12:00 on 27, (g) 12:00-18:00 on 27, (h)18:00 on 27 to 00:00 on 28.The gray shadow is the area of surface pressure below 700 hPa |
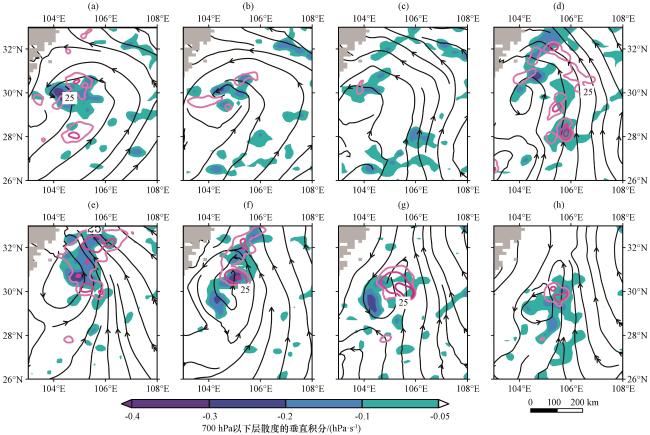
图10 “2023·07·26”过程, 相邻2个时次平均的700 hPa以下层散度垂直积分(填色, 单位: hPa·s-1)、 风场(流线, 单位: m·s-1)和累计雨量(等值线, 单位: mm)(a)26日00:00 -06:00, (b)26日06:00 -12:00, (c)26日12:00 -18:00, (d)26日18:00至27日00:00, (e)27日00:00 -06:00, (f)27日06:00 -12:00, (g)27日12:00 -18:00, (h)27日18:00至28日00:00; 灰色阴影为地表气压低于700 hPa区域 Fig.10 The integral of divergence below 700 hPa (shading, unit: hPa·s-1), wind field (streamline, unit: m·s-1) on the 700 hPa and accumulated precipitation (contour, unit: mm) of the two adjacent times of the “2023·07·26” process.(a) 00:00 -06:00 on 26, (b) 06:00 -12:00 on 26, (c) 12:00 -18:00 on 26, (d) 18:00 on 26 to 00:00 on 27, (e) 00:00 -06:00 on 27, (f) 06:00 -12:00 on 27, (g) 12:00 -18:00 on 27, (h) from 18:00 on 27 to 00:00 on 28.The gray shadow is the area of surface pressure below 700 hPa |