
1 引言
随着中国经济的快速发展, 大气污染问题日益严重, 并呈现出明显的区域性和复合型特征。以京津冀、 长江三角洲、 珠江三角洲和四川盆地等地区为例, 由于这些地区城市密集、 产业活动频繁, 均不同程度地面临区域性大气污染问题(王英等, 2012; Gao et al, 2020; 李佳霖和张美根, 2022; 任鑫冰等, 2024)。其中, 四川盆地位于我国西南地区, 是大气污染防治“三区十群”的重点防控区域之一。该地区的“深盆”地形导致了频繁的静稳天气(表现为静风频率高以及多层次、 高强度的逆温现象), 使得盆地内大气污染物易于积累, 污染形势依然严峻, 是我国污染最严重的区域之一(杨显玉等, 2024), 主要污染物为臭氧(O3)和细粒颗粒物(PM2.5)(Gao et al, 2020; 卢宁生等, 2023)。氮氧化物(NO x )作为O3的重要前体物, 其排放水平是衡量人为源大气污染物排放的关键指标(韩丽等, 2021; 杨景怡等, 2025)。因此系统研究四川盆地NO x 浓度及其排放的长期变化, 识别排放热点区域, 对于进一步改善四川盆地的大气污染具有重要意义。
NO x (NO x = NO + NO2)是大气中重要的污染物, 主要来自于化石燃料的燃烧和机动车尾气排放等人为源, 同时也包括闪电过程、 土壤微生物的硝化和反硝化过程、 生物质燃烧等自然源。NO x 是硝酸盐气溶胶和对流层臭氧等二次污染物的重要前体物, 也是导致酸雨的主要成因, 对生态环境和人体健康有较大危害(Geddes et al, 2012; 王占山等, 2014; 韩丽等, 2021)。其危害主要包括: NO x 溶于水形成酸雨, 会对环境造成大面积破坏, 造成巨大的经济损失; NO x 会影响人体的呼吸系统, 导致气管炎、 肺气肿等疾病, 严重危害人体健康; NO x 与其他污染物发生光化学反应, 造成光化学烟雾(Geddes et al, 2012; 王英等, 2012)。NO x 对人类社会和生态环境的影响不可忽视。因此, 研究NO x 的时空分布特征对于国家大气防治措施的制定和实施具有重要的参考意义。
早期对NO x 时空分布特征的研究主要基于地面监测数据, 但由于地面监测的局限性, 在研究区域尺度NO x 时空分布特征方面存在很大不足。近年来, 随着卫星监测技术的不断发展, 卫星数据因其具有实时性、 连续性、 高分辨率和覆盖范围广等优势, 被广泛应用于区域尺度NO2等痕量气体的热点分布研究。目前用于检测NO2的卫星遥感传感器主要包括GOME(The Global Ozone Monitoring Experiment, 1996 -2003年)、 SCIAMACHY(Scanning Imaging Absorption Spectrometer for Atmospheric Cartography, 2002 -2012年)、 臭氧监测仪OMI(Ozone Monitoring Instrument, 2004年至今)、 GOME-2(2007年至今, 含2013年升级版)、 对流层监测仪TROPOMI (Tropospheric Monitoring Instrument, 2017年至今)等(Goldberg et al, 2019)。
近年来, 国内外学者广泛利用卫星遥感数据分析对流层NO2柱浓度的时空分布特征, 重点研究NO x 的变化趋势及其与大气污染的关系(朱文东等, 2019; Wang et al, 2019; 马超等, 2020; 蒋涛等, 2021)。一些学者使用GOME和SCIAMACHY数据对中国NO2浓度的演变特征进行了分析, 结果表明中国东部及香港地区NO2柱浓度显著增加, 京津冀、 长三角、 珠三角和四川盆地是NO2污染的主要区域(Richter et al, 2005; 张兴赢等, 2007)。由于OMI数据具有较高的精度和较长的时间序列, 它被广泛应用于相关研究中(张彦军等, 2008; 王跃启等, 2009; 尉鹏等, 2011; Zhang et al, 2012)。近年来TROPOMI NO2柱浓度数据凭借其高分辨率和高信噪比的优势, 被广泛应用于NO x 排放的估算与热点区域识别(Beirle et al, 2019; Goldberg et al, 2019; Lorente et al, 2019; Silvern et al, 2019)。已有研究指出夏季NO2在大气中的寿命较短且传输距离有限, 卫星观测的NO2柱浓度与地面NO x 排放量具有很好的相关性(尉鹏等, 2011; Zhang et al, 2012)。基于这一特性, NO2柱浓度高值区可以视为NO x 排放高值区的代表。此外, 对流层NO2柱浓度数据可用于推测NO x 排放和变化趋势(Silvern et al, 2019)。
自《大气污染防治行动计划》实施以来, 我国采取了严格的大气污染防治措施, 各城市群的大气污染物浓度均明显下降。已有研究主要采用OMI卫星观测数据对四川盆地对流层NO2柱浓度进行分析。肖钟湧和江洪(2011)指出2004 -2010年间对流层NO2柱浓度与总NO2柱浓度分别以5.14%和3.42%的年均增长率逐年上升。朱文东等(2019)基于OMI卫星观测数据识别了2005 -2017年成渝城市群对流层NO2柱浓度的变化, 发现成渝城市群对流层NO2柱浓度在2005 -2012年明显增加, 而在2012年之后呈现下降趋势。蒋涛等(2021)进一步研究了2008 -2019年四川省对流层OMI NO2柱浓度的时空分布, 指出四川省对流层NO2垂直柱浓度整体呈“M-型”波动且2015 -2019年间呈现先升后降的变化趋势。为进一步识别四川盆地NO x 排放的时空特征及长期变化趋势, 本研究使用2005 -2021年OMI卫星和2018-2021年TROPOMI卫星的NO2垂直柱浓度数据, 识别四川盆地NO2柱浓度的时空分布特征, 并结合高分辨率排放清单评估卫星观测结果的准确性, 以期为四川盆地NO x 排放的进一步管控提供新的决策参考。
2 数据来源和方法介绍
2.1 卫星观测数据
OMI是由美国国家航空航天局于2004年7月发射的Aura卫星上搭载的紫外可见光谱仪。该卫星为极地轨道的太阳同步卫星, 每天可覆盖全球一次, 过境时间约为13:45(地方时, 下同)(张彦军等, 2008)。OMI的空间分辨率为13 km×24 km, 主要用于监测大气痕量气体, 如NO2和O3等。本研究采用由荷兰皇家气象研究院反演的QA4ECV版本1.1的OMI对流层NO2垂直柱浓度产品。
TROPOMI是欧洲航天局于2017年10月发射的卫星“哨兵-5P”(Sentinel-5P)上搭载的大气监测光谱仪, 其过境时间约为13:30, 实现每天全球覆盖。与OMI相比, TROPOMI具有更高的空间分辨率, 为3.5 km×7 km(自2019年8月6日起, 分辨率提高至3.5 km×3.5 km)(Wang et al, 2020)。为了提高数据精度, 本研究剔除了云量大于30%, 太阳天顶角大于70°以及质量控制系数(qa_value)小于0.7的数据, 以减少云量等因素导致的误差。
2.2 MEIC排放清单NO x 数据
中国多尺度排放清单模型MEIC(Multi-resolution Emission Inventory for China)由清华大学自2010年开发并维护, 旨在构建高分辨率的中国人为源大气污染物排放清单(Li et al, 2018)。本文使用MEIC-V1.3版本的 NO x 排放数据, 分辨率为0.25°×0.25°, 数据来源于MEIC官网(http: //meicmodel.org)。MEIC的排放源涵盖农业、 电力、 民用、 工业和交通五个部门, 其中农业部门的NO x 排放量为0 kt, 因此本文不再讨论农业部门。
2.3 地面环境监测数据
本研究采用四川省与重庆市近地面国控环境空气质量监测站的逐小时NO2浓度进行分析。环境空气中的NO2浓度通过化学发光法与差分吸收光谱法进行测定, 各站点的NO2分析仪器测量范围为0~500 ppb, 最低检出限小于2 ppb, 最小显示单位0.1 ppb, 定期使用标准气体进行标定。监测数据参考《环境空气质量评价技术规范(试行)(HJ 663-2013)》与《环境空气氮氧化物的自动测定化学发光法(HJ 1043-2019)》进行严格质量控制。
2.4 研究区域
本文将川渝地区按地理分布划分为6个区域, 分析各区域对流层NO2柱浓度的时空分布特征, 具体划分详见表1。本文中涉及的川渝地区地图是基于中华人民共和国自然资源部地图技术审查中心标准地图服务系统下载的审图号为GS(2019)3333号中国分省(区、 市)地图制作, 底图无修改。
表1 川渝地区区域划分表Table 1 Regional division table of the Sichuan-Chongqing Area |
| 区域 | 地级市 | 区域 | 地级市 |
|---|---|---|---|
| 成都平原城市群 | 成都市 | 川东北城市群 | 广元市 |
| 德阳市 | 南充市 | ||
| 绵阳市 | 广安市 | ||
| 遂宁市 | 达州市 | ||
| 乐山市 | 巴中市 | ||
| 眉山市 | 攀西高原城市群 | 攀枝花市 | |
| 雅安市 | 凉山州 | ||
| 资阳市 | 川西高原城市群 | 阿坝州 | |
| 川南城市群 | 自贡市 | 甘孜州 | |
| 泸州市 | 重庆市 | 重庆市 | |
| 内江市 | |||
| 宜宾市 |
3 结果与讨论
3.1 对流层NO2 柱浓度空间分布
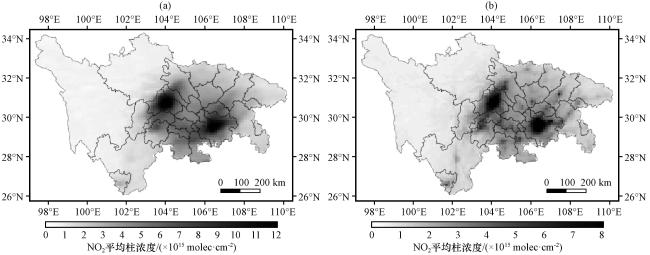
图1为2010 -2020年川渝地区对流层OMI和TROPOMI NO2柱浓度年均空间分布。从图1中可以看出, 四川盆地OMI NO2柱浓度空间分布显示两个热点区域(NO2柱浓度高达12×1015 molec·cm-2), 分别位于成都市和重庆市主城区[图1(a)]。成都平原城市群、 川南城市群、 川东北城市群和重庆的大部分地区NO2柱浓度均超过4×10¹⁵ molec·cm-2, 而川西高原和攀西高原城市群大部分地区NO2柱浓度均低于1×10¹⁵ molec·cm-2。值得注意的是, 攀枝花市NO2柱浓度高达4×10¹⁵ molec·cm-2, 这可能与当地钢铁行业的NO x 排放贡献有关。与OMI相比, TROPOMI卫星能够识别出更精细的空间分布特征[图1 (b)]。TROPOMI NO2柱浓度空间分布同样识别了四川盆地的两个热点区域(成都市和重庆市), 主城区的NO2柱浓度高达8×10¹⁵ molec·cm-2。此外, 由于TROPOMI卫星相较OMI卫星具有更高的分辨率, 除成都市和重庆市以外, TROPOMI卫星还识别出其他城市中心NO2柱浓度的高值分布(超过4×10¹⁵ molec·cm-2), 这一现象与这些城市核心区的人为活动强度高度对应。
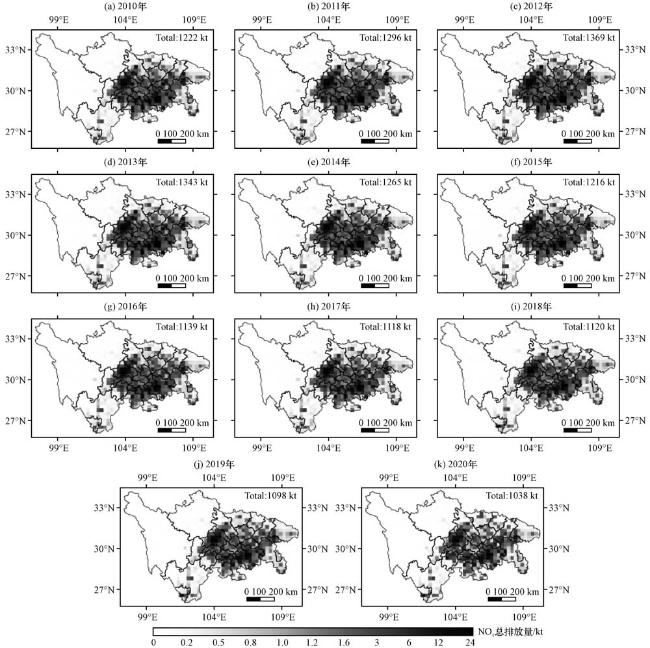
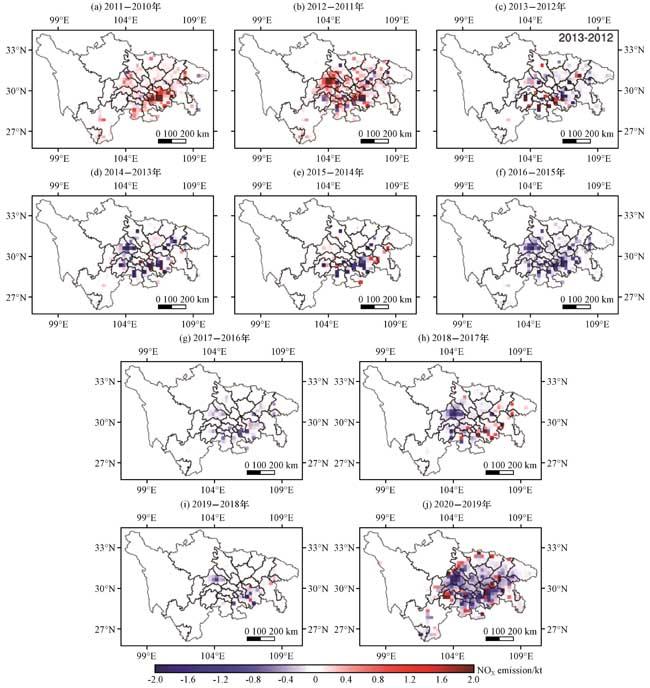
从MEIC排放清单NO x 年总排放量的空间分布图(图2)可以看出, 与图1相似, 川渝地区存在两个NO x 高排放区, 分别为成都市和重庆市。除阿坝州和甘孜州以外, 其余城市中心的NO x 排放量普遍较高, 各个城市中心的NO x 排放量显著高于周边地区。与图1相比, MEIC排放清单中的NO x 空间分布与卫星观测的NO2柱浓度空间分布具有较好的对应关系。在成都平原城市群中, 成都、 乐山、 德阳和绵阳市的NO x 排放量均较高, 2010 -2012年这些高排放区的年总排放量均达到12 kt, 其中成都市高排放区年总排放量超过24 kt。自2013年起, 各大城市的NO x 年总排放量呈现下降趋势, 其中乐山市和绵阳市下降尤为明显, 成都市年总排放量大于12 kt的区域开始减少。雅安市的NO x 年总排放量相对较低, 高排放区年总排放量小于3 kt, 且多年无明显变化。在川南城市群中, 内江市、 自贡市、 宜宾市和泸州市的NO x 高排放区年总排放量均在12 kt左右。就川东北城市群而言, 巴中市和广元市的NO x 年总排放量较低, 广元市高排放区年总排放量小于3 kt, 巴中市则小于1.6 kt。广安市在2010 - 2012年NO x 高排放区年总排放量约为24 kt, 但自2013年起逐渐下降, 到2015年高排放区年总排放量降至12 kt以下, 减排幅度超过50%。在攀西高原城市群中, 攀枝花市的年总排放量较高, 高排放区排放量接近12 kt。从各年份的NO x 排放量峰值来看, 2010 -2012年间NO x 排放量有所增加, 之后逐渐减少。与2010 -2012年相比, 四川盆地各区域在2019年和2020年的NO x 高排放区面积明显缩小。
3.2 对流层NO2 柱浓度变化趋势
为研究川渝地区不同城市群对流层NO2柱浓度的长期变化趋势, 图4和图5分别显示了川渝地区不同城市群2010 -2020年OMI NO2柱浓度和2018年4月至2022年2月TROPOMI NO2柱浓度的变化趋势。由OMI NO2柱浓度图(图4)可见, 成都平原城市群、 川南城市群、 川东北城市群和重庆的NO2柱浓度普遍高于2×10¹⁵ molec·cm-2, 明显高于川西高原和攀西高原城市群。同样的空间分布特征在TROPOMI的观测结果中也有所体现(图5)。此外, 在川渝地区的6大城市群中, NO2柱浓度平均值最高的是川南城市群, 特别是在冬季, 川南地区的NO2柱浓度显著高于其他地区。2011年1月、 2012年12月和2013年1月, 川南地区的NO2柱浓度超过10.0×10¹⁵ molec·cm-2, 并在2012年12月达到峰值, 浓度为11.0×10¹⁵ molec·cm-2。同一时间, 成都平原城市群、 重庆和川东北城市群的NO2柱浓度分别为5.9×10¹⁵、 5.6×10¹⁵和6.1×10¹⁵ molec·cm-2, 明显低于川南地区。这主要是因为川南地区NO2柱浓度整体较高, 而其他地区虽然中心城市的NO2柱浓度较高, 但是周边大多数为低值区域, 导致川南地区的NO2平均柱浓度高于其他地区。
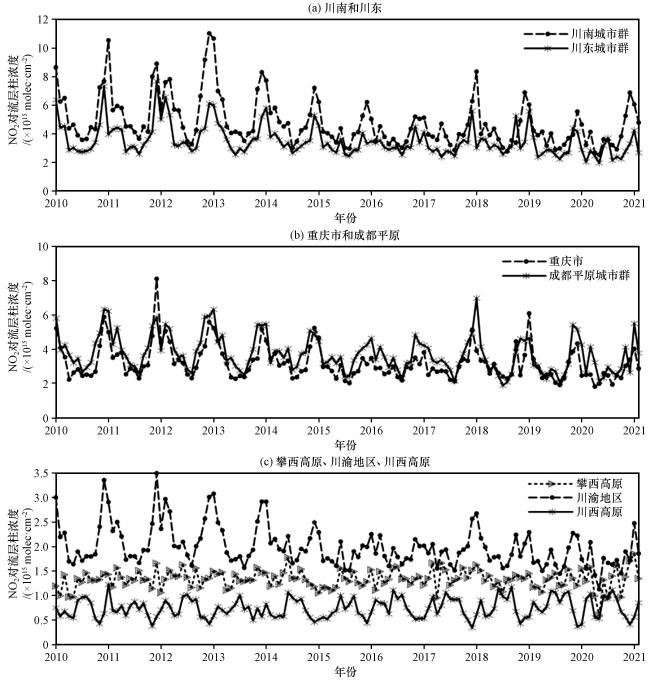
图4 2010 -2020年川渝地区不同城市群OMI NO2柱浓度变化(单位: ×1015 molec·cm-2)Fig.4 Changes in OMI NO2 column density in different urban agglomerations in the Sichuan-Chongqing region from 2010 to 2020.Unit: ×1015 molec·cm-2 |
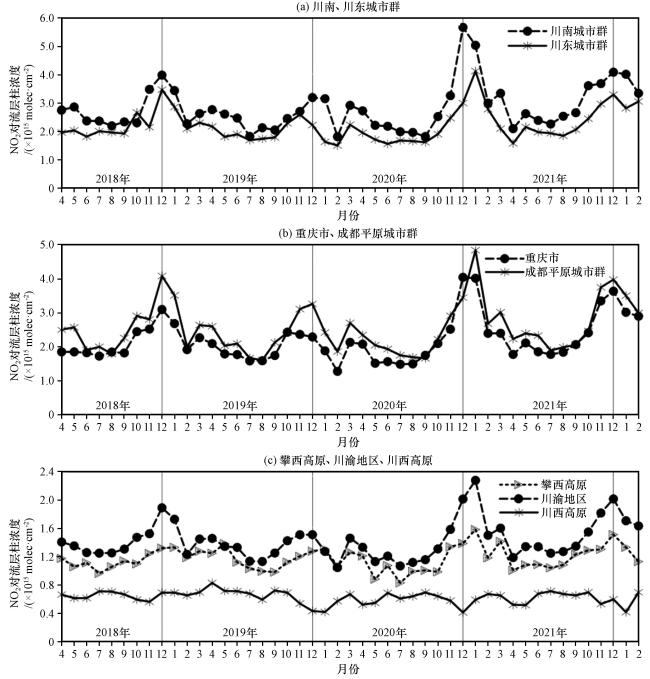
从长期变化来看, 除攀西高原和川西高原城市群多年OMI NO2柱浓度无明显变化外, 其他城市群变化较为显著(图4)。2010 -2012年, 各城市群的NO2柱浓度较高, 并呈现逐年上升的趋势。然而自2012年之后, NO2柱浓度逐渐下降。其中, 川南城市群在2016年冬季的NO2柱浓度峰值相比2012年减少了5.8×10¹⁵ molec·cm-2, 下降幅度高达52.8%。2017年冬季, NO2柱浓度普遍升高, 尤其是川南和成都平原城市群的上升最为明显。与2016年冬季相比, 2017年冬季川南城市群的NO₂柱浓度峰值增加了3.1×10¹⁵ molec·cm-2, 上升幅度为59.62%; 成都平原地区增加了2.2×10¹⁵ molec·cm-2, 上升幅度为45.8%。自2018年起, 各大城市群的NO2柱浓度总体呈下降趋势。值得注意的是, 2020年冬季除了川南城市群NO2柱浓度峰值较前一年明显升高外, 成都平原城市群、 重庆市和川东北城市群的NO2柱浓度峰值较前一年明显下降。
各地区的TROPOMI NO2柱浓度在2019年呈下降趋势 (图5), 但在2020年冬季NO2柱浓度明显升高。其中, 川南城市群、 川东北城市群、 重庆市和成都平原城市群2020年的NO2柱浓度峰值相较于2019年增幅分别为77.5%、 85.2%、 76.9%和70.4%。这种变化趋势与图4中OMI观测的NO2柱浓度变化趋势并不一致。此外, 除川西高原城市群外, NO2柱浓度在每年2月均有所下降, 但在3月又普遍回升。这一时间变化特征在OMI观测结果中也有体现(图4)。这种现象可能是由于春节期间, 车流量减少、 工厂停工, 导致NO x 排放量大幅度减少, 从而导致2月对流层NO2柱浓度下降(黄伟等, 2015)。3月通常为春节假期结束时段, 随着车流量上升和工厂复工, NO x 排放量增加, 从而导致NO2柱浓度回升。4月出现的次峰值则可能是受农业生产的影响(肖钟湧和江洪, 2011)。受新冠疫情影响, 2020年1月川东北城市群、 重庆市和成都平原城市群的NO2柱浓度低于3月。然而, 川西高原城市群2020年的NO2柱浓度变化趋势与其他年份基本一致, 这可能是由于疫情期间的管控对川西高原城市群NO2柱浓度影响相对较小。
图6为成都平原城市群、 重庆市和整个川渝地区2010 -2020年年平均NO2柱浓度及其多年变化趋势。2010 -2020年, 三个区域的NO2柱浓度均呈下降趋势, 其中川渝地区的NO2柱浓度下降较为缓慢, 下降幅度为0.053×10¹⁵ molec·(cm2·a)-1。成都平原城市群和重庆NO2柱浓度下降较快, 且两者变化趋势较为接近, 成都平原城市群NO2柱浓度的下降幅度为0.115×10¹⁵ molec·(cm2·a)-1, 重庆地区为0.096×10¹⁵ molec·(cm2·a)-1。
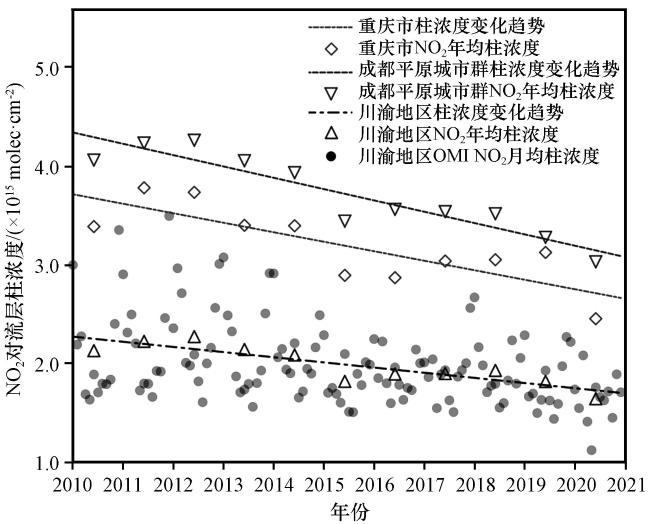
从逐年变化趋势来看, 三个区域对流层NO2柱浓度在2010 -2012年逐渐增加, 成都平原城市群NO2平均柱浓度在此期间达到最大值, 为4.27×10¹⁵ molec·cm-2, 这与经济发展、 工业和机动车NO x 排放量的增加密切相关。2012年后, NO2柱浓度逐渐下降, 到2015年降至最低点。与2012年相比, 成都平原城市群、 重庆市及川渝地区NO2柱浓度分别下降了19.20%、 22.51%和19.91%。2012年9月27日, 国务院批复《重点区域大气污染防治“十二五”规划》, 为成渝地区建立了统一协调的区域联防联控机制, 使其成为重点防治区域之一。2013年9月10日, 国务院发布《大气污染防治行动计划》, 随后《〈四川省大气污染防治行动计划实施细则〉2014年度实施计划》开展了包括燃煤锅炉整治、 加速“黄标车”和老旧车辆淘汰、 加强城市扬尘综合治理以及全面完成工业脱硫、 脱硝、 除尘减排等污染控制措施。NO2柱浓度的下降表明川渝地区在NO x 减排方面取得了显著成效。2015 -2017年, NO2柱浓度有所回升, 其中川渝地区上升10.76%, 但之后又逐渐下降。重庆地区在2019年NO2柱浓度上升明显, 而2020年又大幅度下降。
由前文分析可知, 四川盆地四个区域(川南城市群、 川东北城市群、 重庆市、 成都平原城市群)的NO2柱浓度变化趋势基本一致, 全年最高值出现在冬季, 最低值出现在夏季。川西高原城市群的NO2柱浓度变化趋势与四川盆地相反, 全年最高值出现在夏季, 最低值在冬季。而攀西高原的变化趋势介于两者之间。图7进一步显示了2010 -2020年川渝地区的NO2季节变化趋势。
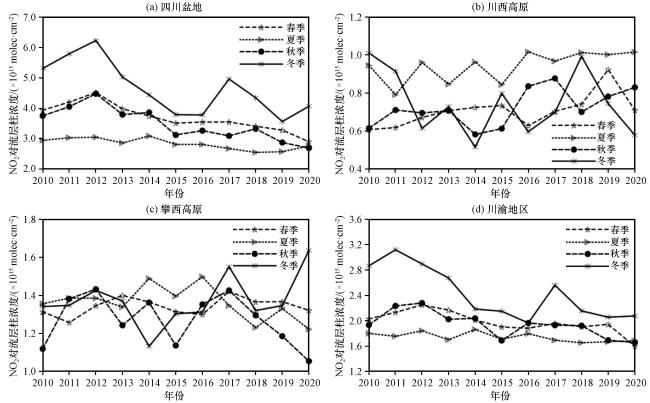
2010 -2020年川渝地区冬季NO2柱浓度最高, 平均值为4.72×10¹⁵ molec·cm-2, 夏季浓度最低, 平均值为2.83×10¹⁵ molec·cm-2, 而秋季柱浓度略高于春季, 平均值分别为3.69×10¹⁵ molec·cm-2、 3.48×10¹⁵ molec·cm-2[图7(a)]。这主要由于冬季四川盆地气温较低、 湿度小, 导致NO2的生命周期较短。此外, 冬季NO x 排放量较高, 在人为排放和气象条件的共同作用下, NO2柱浓度上升。相反, 夏季高温多雨, NO2的生命周期缩短且被雨水冲刷, 导致浓度下降。从长期变化来看, 四川盆地冬季的NO2柱浓度变化较大。2010 -2012年间柱浓度上升, 2012年冬季达到峰值, 为6.23×10¹⁵ molec·cm-2。2012年后, 柱浓度逐渐下降, 到2016年冬季降至谷值, 为3.78×10¹⁵ molec·cm-2, 相较于2012年下降了39.33%。2017年冬季, 柱浓度大幅度回升至4.96×10¹⁵ molec·cm-2, 较2016年上升31.22%。2017年后, NO2柱浓度再次下降, 但在2020年冬季略有回升。对于春秋季节, 2012年达到峰值后, 基本呈现缓慢下降趋势。2020年春秋季, NO2柱浓度较2012年下降约40%。而夏季柱浓度在2010 - 2020年间变化不明显。
由图4和图5可知, 川西高原每年NO2柱浓度峰值通常出现在夏季, 冬季浓度明显降低。由图7(b)可知, 2010 -2020年川西高原夏季NO2柱浓度为0.94×10¹⁵ molec·cm-2, 高于冬季的0.76×10¹⁵ molec·cm-2。除2010年和2011年外, 其余年份均为夏季浓度较高。这主要是因为川西高原人为活动较少, 自然源对对流层NO2柱浓度的贡献较大(Van et al, 2006)。夏季高温有利于土壤中的NO x 挥发, 这可能是导致夏季NO2浓度升高的主要原因。而攀西高原的NO2柱浓度季节变化存在较大不确定性。图4中, 2017年之前冬季NO2浓度通常较低, 如2014年和2016年冬季的情况。在图7中, 2014 - 2016年冬季柱浓度低于夏季, 尤其是2014年, 冬夏两季柱浓度差值达到了0.36×10¹⁵ molec·cm-2, 冬夏季的平均柱浓度分别为1.35×10¹⁵ molec·cm-2和1.36×10¹⁵ molec·cm-2。2017年后, 攀西高原的NO2季节变化趋势与四川盆地基本一致。2017年冬季, 攀西高原NO2柱浓度达到最大值, 这可能与2017年四川盆地冬季NO2浓度大幅上升有关。此外, 2020年冬季攀西高原NO2柱浓度峰值为1.58×10¹⁵ molec·cm-2, 较2019年冬季的1.30×10¹⁵ molec·cm-2上升了21.54%(图5)。这与2020年冬季四川盆地NO2柱浓度的上升趋势一致。这表明, 随着经济发展和人为活动增加, 攀西高原的NO2浓度从2017年之前主要受自然源影响, 逐渐转变为受人为源影响。
图8(a)~(j)为2010 -2020年OMI对流层NO2柱浓度逐年变化。2011年和2012年, 成都平原城市群、 重庆市以及川南城市群NO2柱浓度明显增加, 而部分地区浓度虽有所下降, 但变化并不明显。2013 -2015年, NO2浓度呈明显下降趋势, 尤其是重庆市, 2015年NO2年均柱浓度较2014年下降了4×10¹⁵ molec·cm-2。2016 -2018年, 部分地区NO2柱浓度明显上升, 与之前的分析一致。2017年, 成都市和重庆市主城区NO2柱浓度明显上升, 而眉山、 乐山及川东北城市群NO2柱浓度则有所下降。2016 -2018年NO2柱浓度上升的原因可能与NO x 排放增加有关。2019年后, 大部分地区NO2柱浓度开始下降, 尤其是2020年, 重庆市和成都市的NO2柱浓度较2019年显著降低。
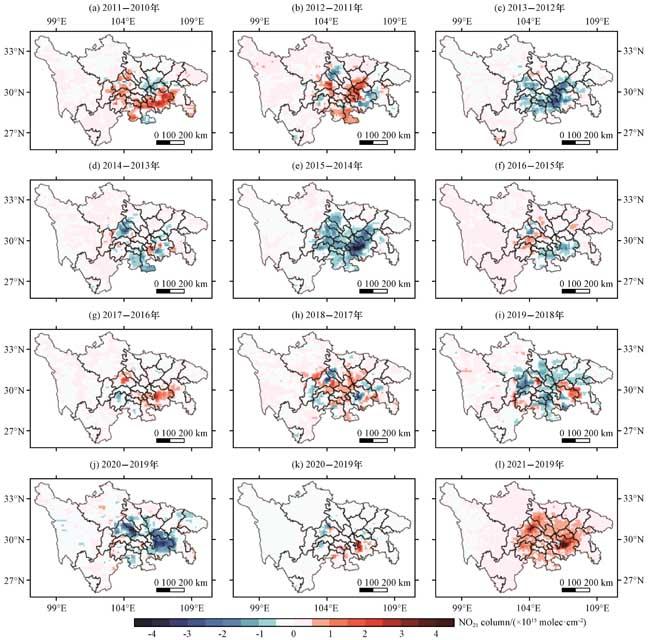
从TROPOMI NO2柱浓度逐年变化[图8(k)~(l)]可见, 2020年相比2019年, 成都平原城市群大部分地区NO2柱浓度有所下降, 但下降幅度并不大。这可能是由于2020年上半年受疫情影响, NO2排放量大幅减少。然而, 重庆南部及川南城市群的NO2柱浓度则有所上升, 部分地区的上升幅度超过了4×10¹⁵ molec·cm-2。这与OMI观测到的NO2柱浓度变化存在显著差异。2021年, 四川盆地内除重庆部分地区外, 其他地区NO2柱浓度均不同程度上升。TROPOMI卫星观测显示成都市与重庆主城区NO2柱浓度均明显上升, 其中成都市区与重庆主城区的NO2柱浓度增幅高达4×10¹⁵ molec·cm-2。此外, NO2柱浓度上升超过0.5×10¹⁵ molec·cm-2的区域主要集中在图2中NO2柱浓度原本大于2×10¹⁵ molec·cm-2的高排放区。值得注意的是, 2021年四川盆地NO2柱浓度较2020年显著升高的主要原因可能是这些高排放地区在疫情期间受到较大影响, 复工复产后生产加速导致NO x 排放量显著增加。
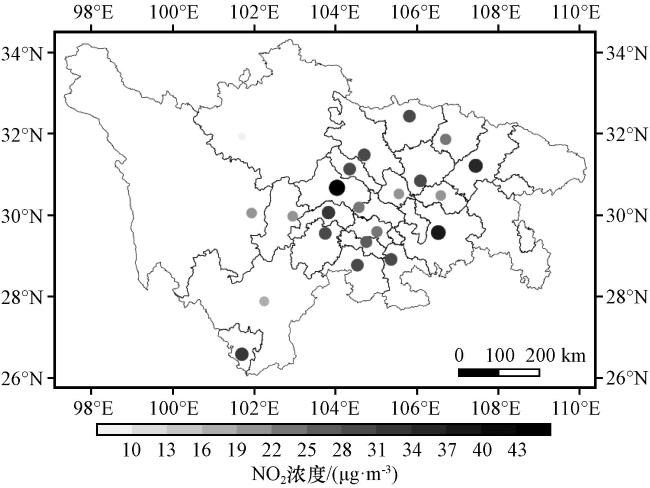
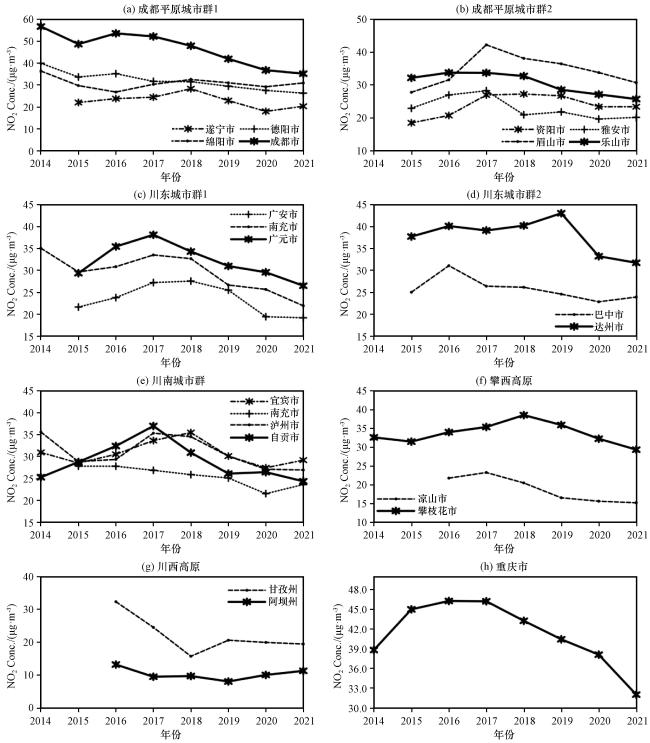
图9为2014 -2021年川渝地区各城市地面环境监测的NO2年均浓度变化趋势。从图9(a)~(b)可以看出, 成都市的NO2浓度最高, 与之前的分析一致。相比2014年, 2015年成都、 绵阳和德阳市的NO2年均浓度有所下降。2016年, 大多数城市的NO2年均浓度较2015年有所上升, 其中雅安市增幅最大, 达到17.9%。成都市2016年NO2年均浓度为53.7 μg·m-3, 比第二位的绵阳市高出18 μg·m-3。2017年, 资阳市和眉山市的NO2年均浓度增幅显著, 分别上升33.86%和30.43%。之后, 大多数城市的NO2年均浓度呈现下降趋势。到2021年, 成都市的NO2年均浓度达到谷值, 较2014年下降了37.85%。总体来看, 成都平原的NO2年均浓度在2015年下降到一个谷值后, 2016年和2017年有所回升, 2017年后保持缓慢下降。与OMI NO2柱浓度的长期变化趋势相比, 地面观测的NO2浓度和卫星观测的NO2柱浓度变化趋势一致性较好。从图9(e)中可以看出, 2015年泸州和宜宾的NO2年均浓度有所下降, 而自贡市的NO2年均浓度有所上升。2015 - 2021年, 除内江市的NO2年均浓度保持稳定外, 其余三个城市的变化趋势与成都平原一致, 呈现先上升后下降的趋势。川东[图9(c)~(d)]、 重庆[图9 (h)]和攀西高原[图9(f)]的城市也表现出相似的变化趋势, 但峰值出现的时间有所不同。大部分城市在2016年或2017年达到峰值, 之后缓慢下降。图9(g)显示, 2016 -2021年阿坝州和甘孜州的NO2浓度总体呈先下降后上升的趋势。甘孜州在2018年NO2浓度达到谷值, 较2016年下降51.4%, 之后浓度有所上升, 但增幅不大。
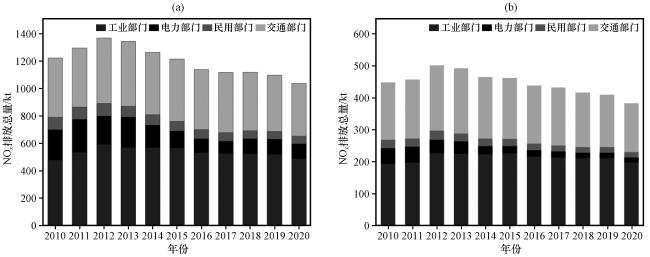
从2010 -2020年川渝地区MEIC排放清单不同部门NO x 年排放总量[图11(a)]中可以看出, 工业部门是川渝地区NO x 主要排放源, 其次是交通部门, 而民用部门的排放量最少。从长期变化趋势来看, 2010 -2012年NO x 排放量逐年增加, 2012年排放量达到1369.8 kt, 较2010年增加12.00%, 其中工业部门的排放量增幅最大, 达到24.10%。自2012年起, NO x 排放量逐渐减少, 到2020年降至1038.4 kt, 相比2012年下降24.20%。在2014 -2017年间, 电力部门的NO x 排放量大幅降低, 2014年相比2013年下降26.19%, 而2017年较2013年下降59.66%, 这与燃煤电厂超低排放改造密切相关(王誉晓等, 2020)。2020年受疫情影响, NO x 排放量下降5.64%, 其中工业部门和交通部门分别降低31.7 kt和25.1 kt。
Silvern et al(2019)指出在NO x 排放量较高的地区, NO2柱浓度能够很好的反映NO x 的变化趋势。从2010 -2020年成都平原地区NO x 年排放量[图11(b)]中可以看出, 成都平原2010 -2020年的NO x 平均排放量为446.5 kt, 占川渝地区NO x 平均排放量的37.12%。由此可见, 成都平原属于NO x 高排放区域, 其NO2柱浓度变化趋势应与NO x 排放量变化趋势相对应。由图6可知, 成都平原地区的NO2年均柱浓度在2016 -2018年均高于2015年, 然而图11(b)中2016年成都平原NO x 排放量明显下降, 之后几年仍维持缓慢下降趋势, 与对流层NO2柱浓度变化趋势不符。这一趋势的不一致可能归因于人为源NO x 排放量迅速减少导致NO2大气寿命有所变化, 但具体成因机制仍有待进一步研究。
4 结论
本文利用OMI和TROPOMI数据分析了川渝地区对流层NO2柱浓度的长期变化趋势和空间分布特征, 并结合地面环境监测站NO2浓度数据和MEIC清单NO x 排放量评估了卫星观测结果的准确性。结果表明:
(1) OMI和TROPOMI卫星能够很好地识别川渝地区的NO x 时空排放特征, 且柱浓度年际变化趋势与MEIC清单NO x 年总排放量整体一致。
(2) 2010 -2020年川渝地区对流层NO2柱浓度总体呈现下降趋势, 卫星观测的NO2柱浓度与地面监测的NO2变化趋势基本一致。
(3) 四川盆地各个地区的NO2柱浓度季节变化明显, 冬季最高, 春秋两季次之, 夏季最低。NO2年均柱浓度降低主要归因于冬季柱浓度的下降, 并主要受人为排放的影响。