扫描多普勒激光测风雷达径向风速质量控制方法优化及验证

  • 马腾 , 1, 2, 5 ,
  • 余晔 , 1, 2, 3, 4 ,
  • 董龙翔 1, 3, 4 ,
  • 赵果 1, 2, 3, 4 ,
  • 张彤 1, 3, 4 ,
  • 王雪薇 1, 2 ,
  • 李江林 1, 3, 4 ,
  • 赵素平 1, 3, 4
展开
  • 1. 中国科学院西北生态环境资源研究院冰冻圈科学与冻土工程重点实验室,甘肃 兰州 730000
  • 2. 中国科学院大学,北京 100049
  • 3. 中国科学院平凉陆面过程与灾害天气观测研究站,甘肃 平凉 744015
  • 4. 甘肃省陆面过程与灾害天气野外科学观测研究站,甘肃 平凉 744015
  • 5. 中国气象局兰州干旱气象研究所甘肃省干旱气候变化与减灾重点实验室,中国气象局干旱气候变化与减灾重点实验室,甘肃 兰州 730020
余晔(1973 -), 女, 甘肃武威人, 研究员, 主要从事大气边界层与城市大气环境研究. E-mail:

马腾(1998 -), 男, 河南郑州人, 硕士研究生, 主要从事大气边界层研究. E-mail:

收稿日期: 2024-01-23

  修回日期: 2025-01-09

  网络出版日期: 2025-07-10

基金资助

国家自然科学基金项目(42375086)

国家自然科学基金项目(42305092)

国家重点研发计划项目(2018YFB1502801)

中国科学院大型仪器功能开发项目(2024g109)

Optimization and Verification of Radial Wind Velocity Quality Control Methods for Scanning Doppler Lidar

  • Teng MA , 1, 2, 5 ,
  • Ye YU , 1, 2, 3, 4 ,
  • Longxiang DONG 1, 3, 4 ,
  • Guo ZHAO 1, 2, 3, 4 ,
  • Tong ZHANG 1, 3, 4 ,
  • Xuewei WANG 1, 2 ,
  • Jianglin LI 1, 3, 4 ,
  • Suping ZHAO 1, 3, 4
Expand
  • 1. Key Laboratory of Cryopsheric Science and Frozen Soil Engineering,Northwest Institute of Eco-Environment and Resources,Chinese Academy of Science,Lanzhou 730000,Gansu,China
  • 2. University of Chinese Academy of Sciences,Beijing 100049,China
  • 3. Pingliang Land Surface Process and Severe Weather Research Station,Pingliang 744015,Gansu,China
  • 4. Gansu Land Surface Process and Severe Weather Observation and Research Station,Pingliang 744015,Gansu,China
  • 5. Key Laboratory for Arid Climate Change and Disaster Reduction of Gansu Province,Lanzhou Institute of Arid Meteorology,Northwestern Regional Center of Numerical Weather Prediction,Key Open Laboratory for Arid Climate Change and Disaster Reduction of the China Meteorological Administration,Lanzhou 730020,Gansu,China

Received date: 2024-01-23

  Revised date: 2025-01-09

  Online published: 2025-07-10

Copyright

© Editorial Department of Plateau Meteorology (CC BY-NC-ND)

摘要

风电场内风廓线的观测对于风机输出功率的预测非常重要。随着风机尺寸的不断增加, 常用的测风塔由于其观测高度有限, 无法得到风电场内完整的风廓线信息。本研究通过对比不同严格程度的数据质量控制和处理方法, 提出了一种基于多普勒激光测风雷达速度方位显示(Velocity Azimuth Display, VAD)扫描方式, 获取边界层内高质量风廓线的质量控制与风速反演结果优化处理流程, 并得到了从近地面到风机叶片影响高度的完整垂直风廓线。与传统的仅用载噪比(Carrier-to-Noise Ratio, CNR)对原始径向风速数据进行质量控制的方法相比, 利用本研究提出的数据质量控制和处理流程可显著提高风速和风向反演的精度, 反演得到的风速与测风塔风速的决定系数从0.826(10 m)和0.926(70 m)提高到0.932和0.958, 偏差从0.500 m∙s-1(10 m)和0.063 m∙s-1(70 m)减少到0.464 m∙s-1和0.034 m∙s-1; 优化方法对风向的反演也有很大改进。使用本研究提出的风场反演优化方法, 可以得到激光雷达多普勒波束摆动(Doppler Beam Swinging, DBS)扫描方法探测盲区至风机叶片影响高度的完整边界层风廓线, 可用于风资源评估、 风功率预测以及风电场参数化方案发展等研究。

本文引用格式

马腾 , 余晔 , 董龙翔 , 赵果 , 张彤 , 王雪薇 , 李江林 , 赵素平 . 扫描多普勒激光测风雷达径向风速质量控制方法优化及验证[J]. 高原气象, 2025 , 44(4) : 1071 -1082 . DOI: 10.7522/j.issn.1000-0534.2025.00002

Abstract

Information on wind profiles within a wind farm is crucial for predicting the output power of wind turbines.As the size of wind turbines continues to increase, commonly used wind towers are unable to obtain complete wind profile information within the wind farm due to their limited observation height.This study proposes an optimized processing procedure for quality control and wind speed inversion of high-quality wind profiles within the boundary layer, based on the Doppler lidar Velocity Azimuth Display (VAD) scanning method, by comparing data quality control and processing methods of varying strictness.The complete vertical wind profile from the near ground to the height affected by the wind turbines is obtained using this method.Compared with the traditional method of only using the Carrier-to-Noise Ratio to control the quality of raw radial wind speed data, the data quality control and processing method proposed in this study can significantly improve the accuracy of wind speed inversion.The correlation coefficients between the inverted wind speed and that observed increase from 0.826 (10 m) and 0.926 (70 m) to 0.932 and 0.958, respectively, while the biases decrease from 0.500 m∙s-1 (10 m) and 0.063 m∙s-1 (70 m) to 0.464 m∙s-1 and 0.034 m∙s-1.Furthermore, by using the optimized inversion method proposed in this study, it is possible to obtain a complete boundary layer wind profile from the blind zone detected by the Doppler Beam Swinging (DBS) scanning method to the height affected by wind turbine blades.This can be used for research on wind resource assessment, wind power prediction, and the development of parameterization schemes for wind farms.

1 引言

风能的利用以风力发电为主要形式。随着风机制造成本的降低和风力发电技术的成熟, 风电已成为新能源行业中最具发展前景与商业优势的发电方式之一(谭忠富和鞠立伟, 2013邱剑洪和林寿南, 2019李耀华和孔力, 2019)。而风机尺寸的不断增加, 也使轮毂高度从40 m增加到100 m以上, 风机叶片直径已接近200 m, 叶片影响高度可达200~300 m(Politis et al, 2012)。风机叶片尺寸的不断增大, 使对距离地表 300~400 m以内风廓线信息的需求增加。而风电场建设规模的不断增大, 也使其对局地乃至区域风场的影响越来越受到关注。大量观测和数值模拟研究表明, 风电场运行使下游地区风速明显减小(Barthelmie et al, 2009), 在风机叶片扫过区域及轮轴高度, 风速降低明显且湍流强度增加(张双益和胡非, 2017夏馨等, 2022)。
目前风电场对风速影响的观测研究大多依赖于测风塔。受限于建设成本, 大多数情况下测风塔的观测范围限制在约100 m的高度, 为了获得100 m以上的风廓线, 常使用数值模拟或用幂指数律进行外推(Gryning et al, 2007惠小英等, 2011李思等, 2020), 但这些方法与观测相比仍有一定不确定性(Cao et al, 2023)。近年来, 多普勒激光测风雷达(Light Detection and Ranging, Lidar)由于其探测精度高、 时间分辨率高等优点, 正在代替高成本的测风塔, 被应用于风资源评估以及风廓线特征的研究中(Huang et al, 2017Dai et al, 2020王国成等, 2015冯长中等, 2018顾桃峰等, 2024)。多普勒激光测风雷达的垂直探测范围从几十米到几百米, 在良好天气条件下可达1 km以上(Emeis et al, 2007), 但在仪器高度与最低有效探测高度(几十米至几百米)之间存在探测盲区(Bianco et al, 2008Srinivasulu et al, 2012), 这妨碍了对风机叶片影响区完整风廓线的探测。
扫描激光测风雷达可以通过低仰角扫描克服雷达垂直探测盲区的限制(Vakkari et al, 2015)。由于激光测风雷达只能测量沿视线方向的风速, 即径向风速, 研究人员在风场均匀的假设下提出了基于不同扫描方式的风速反演方法, 如速度方位显示法(Velocity Azimuth Display, VAD)、 体积速度处理法(Volume Velocity Processing, VVP)以及多普勒波束摆动法(Doppler Beam Swinging, DBS)等(Browning and Wexler, 1968Gao et al, 2022Baidar et al, 2023肖艳姣等, 2015)。不同方法及变体已成功应用于大气边界层风廓线研究中, 如Smith et al(2006)通过对比雷达反演结果与气象梯度塔观测数据验证了垂直高度100 m内雷达反演风速的准确性; Päschke et al(2015)通过对比多普勒激光雷达、 风廓线雷达和探空仪测量结果之间的一致性, 证明了多普勒激光雷达可以用于风速监测; Lundquist et al(2015)量化了风机尾流对DBS扫描结果造成的误差; Lang and McKeogh(2011)通过与传统测风塔对比评估了Lidar和声雷达在观测复杂地形风电场内风速的准确性和可靠性。但大多数研究并未给出在风速反演过程中数据质量控制的细节, 扫描激光雷达可否用于风电场内复杂风场环境仍不清楚。
本研究利用单台扫描多普勒激光测风雷达VAD扫描方式获取的径向风速资料, 通过优化资料控制步骤, 得到从近地面到风机叶片影响高度的完整垂直风廓线, 并用气象梯度塔和测风塔观测数据对反演结果进行验证, 重点对比了不同质量控制方法对有效数据量以及反演精度的影响。使用本研究提出的优化资料处理方法可以得到多普勒激光雷达可用最低高度至风机叶片影响区域的垂直风廓线, 为风资源的评估以及风电场的气候环境效应研究提供数据支撑。

2 数据来源和方法介绍

2.1 数据来源

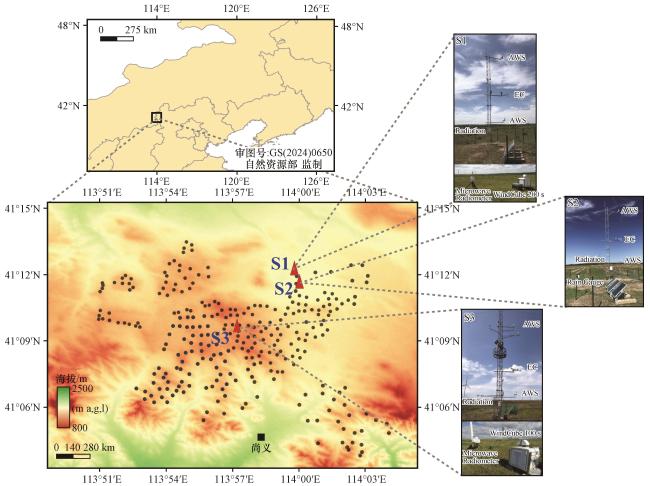
本研究所用数据来自在河北省张家口市某风电场开展的陆面-大气边界层综合观测实验(图1), 研究时段为2020年4月4 -30日。研究区域海拔1400~1600 m, 以农业用地为主。年平均风速为7.60 m∙s-1, 春季(3 -5月)盛行西北风, 风速较大。该风力发电场共有217台额定功率为1.50~2.0 MW、 叶片直径(D)为82~105 m的风机。风机轮毂高度65~80 m, 切入和切出风速分别为3 m∙s-1和20~25 m∙s-1。试验期间在风电场上风方(S1)、 第一排风机后(S2)和风电场内(S3)布设了气象梯度观测塔。每个气象梯度塔均安装有两层一体式自动气象站(MetPak II)(2 m和10 m)、 一层涡动相关系统(Campbell CSAT3+ Li-COR Li7500)(5 m)以及雨量桶等。在S1和S3还布设有多普勒激光测风雷达(Leosphere, Windcube 200 s和100 s)。在S3处激光测风雷达西南方向水平距离64 m处还有一座70 m的测风塔, 该测风塔有5层风速(10, 30, 50, 60, 70 m)、 2层风向(10 m和70 m)和2层温度(8 m和10 m)观测。其风向和风速采样频率均为1 Hz, 精度分别为0.1 m∙s-1和1°。试验期间, 两台激光测风雷达采用相同的扫描策略, 即每30 min依次进行仰角分别为10°和30°的24个方位角的VAD扫描、 75°仰角的5波束DBS扫描、 距离高度(Range Height Indicator, RHI)扫描、 6个不同仰角的平面位置(Plan Position Indicator, PPI)扫描以及大约15 min的固定天顶角(Fixed)扫描, 获得空间分辨率为25 m的径向风速。受气象条件, 如云、 气溶胶、 降水等的影响, 激光雷达最大探测距离为1000~2000 m。本研究只使用了两部激光测风雷达的VAD和DBS径向风速数据以及S1处气象梯度塔和S3处70 m测风塔的风向和风速数据。由于实验期间S3处测风塔30 m、 50 m和60 m的观测设备故障, 故本研究仅使用该测风塔10 m和70 m的数据。文中所用时间均为北京时。
图1 气象梯度塔(红色三角, S1、 S2和S3)、 多普勒激光雷达(S1和S3)和风力涡轮机(黑点)分布

Fig.1 Locations of observation towers (S1, S2, S3, red triangles), Lidar (S1, S3) and wind turbines (black dots)

2.2 方法

2.2.1 风场反演

在水平均匀的风场中, VAD径向风速随方位角的变化遵循正弦曲线(裴丽丝和邱崇践, 2013)。通过对每个高度VAD中径向风速和方位角进行正弦拟合可以得到水平风矢量的垂直廓线(Browning and Wexler, 1968)。具体公式如下(Weitkamp, 2005):
v r = a + b · c o s   θ - θ m a x
u h o r = u 2 + v 2 = b c o s   φ
d i r = θ m a x ( b < 0 ) θ m a x + π ( b 0 )
式中, v r为径向风速; a为偏移量; b为振幅; θ m a x为相移; θ为方位角; φ为雷达仰角; u h o r为水平风速; d i r为水平风向。
在DBS扫描模式中, 激光光束沿着北、 东、 南、 西和垂直五个方向发射, 分别用 V N V E V S V W表示四个方向的径向风速, 并定义风朝向激光雷达时为负。在均匀大气假设下, 水平风场计算公式为(Lundquist et al, 2015):
u = V E - V W 2 c o s   φ
v = V N - V S 2 c o s   φ
u h o r = u 2 + v 2
式中: φ为雷达仰角[单位: (°)]; u h o r为水平风速(单位: m∙s-1
此外, 为了消除风向跨零的影响, 在对比反演得到的风向( D l i d a r)与测风塔观测的风向( D t o w e r)时, 对反演得到的风向进行了处理(Jiménez and Dudhia, 2013Xing et al, 2016)。具体方法如下:
D l i d a r   = D l i d a r i f    | D t o w e r - D l i d a r | 180 ° 360 ° - D l i d a r i f    D t o w e r - D l i d a r   < - 180 ° 360 ° + D l i d a r i f    D t o w e r - D l i d a r   > 180 °

2.2.2 统计量

在本研究中使用偏差(Bias)、 均方根误差(Root Mean Square Error, RMSE)、 拟合优度(Goodness of Fit, GOF)、 相对绝对误差(Relative Absolute Error, RAE)和决定系数(Coefficient of Determination, R2)评估优化方法反演的风速、 风向的准确性, 并利用Kolmogorov-Smirnov(K-S)检验确定相对于传统方法的反演结果, 优化方法的反演结果是否有显著提升。
偏差表示模拟值与观测值之间差异的平均值, 可以用于反映反演结果平均值与观测值相比偏大或者偏小的依据。其计算公式如下:
B i a s = 1 m i = 1 m ( V l i d a r , i - V t o w e r , i )
式中: V l i d a r为利用雷达数据反演得到的风速值; V t o w e r为测风塔观测的风速值; m为样本数。若Bias为正值, 则反演的风速高估于观测值, 若Bias为负值, 则反演的风速低估于观测值, 并且Bias的值越大说明反演结果偏离观测值的程度越大。
均方根误差是衡量预测值与实际值偏差的常用指标之一。本文用RMSE来表示反演得到的风速风向与测风塔观测值之间的差异。RMSE的取值范围为0到正无穷, 其值越接近于零, 表示反演结果和实际观测之间的偏差越小。RMSE计算公式如下:
R M S E = 1 m i = 1 m V l i d a r , i - V t o w e r , i 2
拟合优度通常用于表征拟合值与观测值的接近程度, 相对绝对误差(Relative Absolute Error, RAE)是统计学中用于衡量计算结果准确性的指标, 二者的计算公式如下:
G O F = i = 1 n V f i t , i - V 0 ¯ 2 i = 1 n V 0 i - V 0 ¯ 2
R A E = V l i d a r - V t o w e r V t o w e r
式中: V 0 i是观测到的第i方位的径向风速; V f i t , i是对应方位角i的风速拟合值; V 0 ¯是一次VAD扫描中24个方位径向风速的平均值。GOF的取值范围为(0, 1), GOF越接近于1, 拟合风速与测风雷达径向风速越接近, 拟合结果越好; 反之, 表明拟合效果越差。RAE的值越接近于零, 表示反演风速与测风塔观测值之间的差异越小, 反演结果越准确。
决定系数(Coefficient of Determination, R2)在统计学中被广泛应用于确定预测值与实际值之间的相关性。R 2的取值范围介于0~1之间, 值越高表示预测值与实际值之间的相关性越好。本文使用R 2来表示反演结果与实际观测值之间的线性相关程度。R 2的计算公式如下:
R 2 = 1 - i = 1 m V t o w e r , i - V l i d a r , i 2 i = 1 m V t o w e r , i - V t o w e r , i ¯ 2

3 数据质量控制方法的优化

3.1 径向风速数据的质量控制

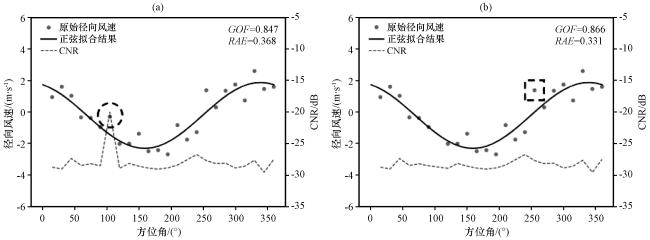
在使用第2.2节中方法反演水平风速和风向之前, 需要对原始径向风速数据进行质量控制。Lidar记录的原始数据不仅包括瞬时径向风速, 还包括指示数据可靠性的置信指数(Confident Index, CI), 在使用中通常将CI=0的数据舍弃。由于降水对激光雷达性能有较大影响, 还舍弃了半小时累计降水量大于1 mm时次的数据。在实际观测中, 受云或降水的影响以及某些径向可能会被风机或测风塔等障碍物完全或部分遮挡, 特定VAD 扫描中有些径向风速的载噪比(Carrier-to-Noise Ratio, CNR)会出现异常值[如图2(a)中圆圈所示]。为了对雷达探测的原始径向风速数据进行质量控制, 以往研究中常设置 C N R - 27 dB为阈值, 剔除 C N R < - 27   d B的数据(Vanderwende et al, 2015Bodini et al, 2017)。这种方法虽然操作简单, 但因CNR还会受噪声水平、 大气条件、 目标表面反射特性等环境因素的影响, 导致仅使用CNR阈值对数据进行过滤有可能会剔除部分质量良好的数据点。为此, 本研究通过计算每个高度一个完整VAD中CNR的标准差 σ C N R, 对径向风速数据进行质量控制。计算公式如下:
C N R ¯ = 1 n i = 1 n C N R i
σ C N R = 1 n i = 1 n C N R i - C N R ¯ 2
式中: C N R ¯为某高度所有方位CNR的平均值; C N R i为某高度第i方位的CNR值, i=1, …, nn=24)。本研究将 C N R i - C N R ¯>1.2 σ C N R的数据作为异常值剔除。
图2 2020年4月4日23:30径向距离为13 m处的径向风速随方位角的变化(灰色点)及正弦拟合结果(实线)

(a)使用 C N R < - 27   d B过滤, (b)使用 C N R i - C N R ¯>1.2 σ C N R过滤, 虚线为数据点对应的CNR值, 圆圈标记为CNR异常值, 方框标记为CNR值正常但离散较大的数据点

Fig.2 Radial wind speed variation with azimuth angle (gray dots) and the fitting results (solid line) at 23:30 on April 4, 2020 at radial distance of 13 m.(a) Filtering using CNR< -27 dB, (b) Filtering using C N R i - C N R ¯> 1.2 σ C N R​.The dashed line represents CNR values, the circle indicates the abnormal CNR, and the box marker indicates data points with normal CNR but high dispersion

对比图2(a)和图2(b)可以发现, 此方法可以有效地去除CNR异常的数据点[图2(a)中圆圈所示异常值在图2(b)中已被剔除], 进而提升了拟合的效果。拟合优度(Goodness of Fit, GOF)从图2(a)的0.847增加到图2(b)的0.866, 相对绝对误差(Relative Absolute Error, RAE)从0.368减小到0.331。
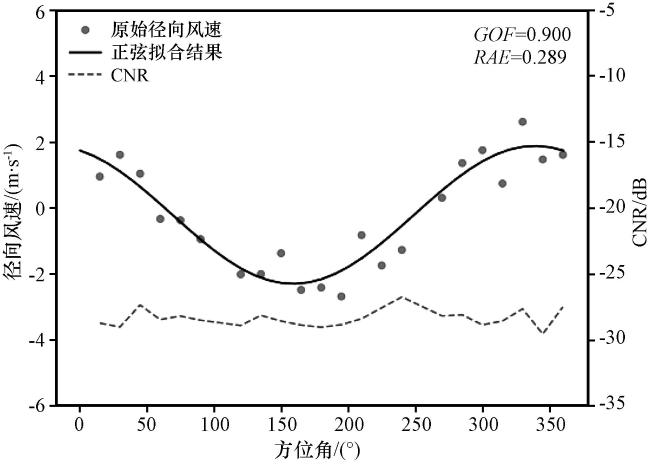
激光雷达获取的径向风速数据是否可用还受大气条件的影响, 在进行正弦拟合时, 如果某高度的数据经上述质量控制后, 单次VAD扫描中的有效数据点不少于10个, 即数据点的覆盖范围不少于150°, 则对该高度的径向风速进行拟合求解(一次拟合), 否则认为该高度的数据缺失(Yamada and Chong, 1999)。在实际计算中我们发现, 经过CNR阈值控制后某些时次仍存在一些离散点[如图2(b)中正方形所示], 径向风速随方位角的变化偏离正弦曲线。为了检出这些离散点, 计算第一次拟合结果的标准化残差( Z e), 舍去 Z e i >  2的数据点。具体计算方法如下:
σ = 1 n i = 1 n V 0 i - V 0 ¯ 2
V 0 ¯ = 1 n i = 1 n V 0 i
Z e i = V f i t , i - V 0 i σ
式中: σ为观测径向风速的标准差; V f i t , i为第i方位的拟合风速; V 0 i为第i方位的Lidar径向风速; V 0 ¯为所有方位径向风速的平均值。从采用Ze 方法去除离散点后再次拟合的结果(图3)可以看出离散较大的点已被剔除, 拟合优度从0.866提高到0.900, 相对绝对误差从0.331降至0.289。
图3 2020年4月4日23:30径向距离为13 m处的径向风速经过 C N R i - C N R ¯ > 1.2 σ C N R Z e i >  2过滤后随方位角的变化(灰色点)及正弦拟合结果(实线)

Fig.3 Radial wind speed variation with azimuth angle (gray dots) and the fitting results (solid line) at 23:30 on April 4, 2020 at radial distance of 13 m after using C N R i - C N R ¯> 1.2 σ C N R and Z e i >2 filters

3.2 反演结果的质量控制

GOF通常用于表征拟合曲线与观测值的拟合程度, 在本研究中, 使用GOF对拟合结果进行进一步的优化。图4显示了三种不同拟合优度下的拟合曲线。当GOF接近1时[图4(a)], 数据点遵循正弦曲线变化, 拟合结果很好, 且CNR值较大; 当GOF较小时[图4(b)], 数据点分布于拟合曲线附近, 拟合效果一般; 当GOF的值很小时[图4(c)], 数据点较离散, 拟合效果差, 且CNR值波动大。
图4 经过质量控制后不同GOF值个例的拟合图

(a) GOF = 0.980, (b) GOF = 0.792, (c) GOF = 0.504

Fig.4 Fitting results with different GOF after quality control.(a) GOF = 0.980, (b) GOF = 0.792, (c) GOF = 0504

G O F的取值没有固定标准, 以往研究中常用GOF接近于1的程度来说明拟合结果的好坏(Singh et al, 2019)。本研究通过分析GOF随拟合风速RAE的变化来确定适用于本研究观测环境的 G O F临界值。图5为10 m高度拟合风速与测风塔实测风速之间的RAE随拟合优度的变化。从图5中可以看出,随着GOF的增加RAE降低, 相应的可用数据量也减少。在风电场内部(S3), GOF<0.65时相对绝对误差超过50%, 滤除GOF<0.65的拟合结果后, 仍可保留大于90%的数据。因此本文仅保留>0.65的拟合结果作为最终结果。
图5 相对绝对误差和可用数据量百分率随 拟合 优度的变化

(a)风电场内(S3), (b)风电场外(S1)。黑色线和阴影区域分别表示0.05 GOF区间RAE的平均值和RAE的标准差范围, 灰色线表示可用数据量百分率

Fig.5 Variation of RAE and percentage of available data with GOF.Within the wind farm (S3), (b) outside the wind farm (S1).The black line and shaded area represent the RAE averaged within the 0.05 GOF interval and the range of RAE standard deviation, respectively, the gray line represents the percentage of available data

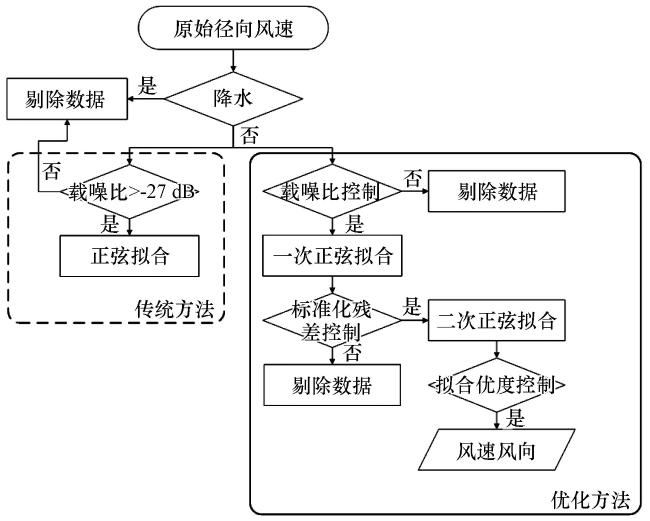
本研究提出的原始数据质量控制流程如图6所示, 图6中同时给出了文献中(Bodini et al, 2017Debnath et al, 2017)常用的数据质量控制流程(图6中虚线框)。首先去除受降水影响的数据, 然后利用 C N R i - C N R ¯ > 1.2 σ C N R剔除CNR异常偏大或偏小的数据。接下来进行第一次正弦拟合, 计算拟合结果的标准化残差( Z e), 剔除 | Z e i | > 2的数据点, 进行第二次VAD拟合, 并计算GOF值, 保留 G O F  > 0.65的拟合结果。
图6 质量控制流程图

Fig.6 The flowchart of quality control

4 反演结果验证

4.1 风速和风向验证

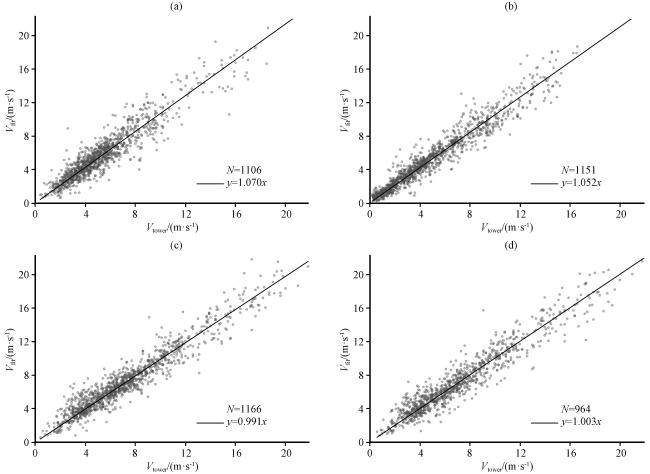
图7给出了利用优化方法和两个不同仰角(10°和30°)VAD径向风速资料反演得到的不同高度(10 m和70 m)风速( V f i t )与测风塔观测风速( V t o w e r )对比的散点图, 其中N为对比样本数。从图7中可以看出, 利用优化方法得到的结果很好, V f i t V 0非常接近, 风速线性回归的斜率在1.070和0.991之间, 决定系数大于0.932, 有效数据量大于75%(研究期间, 共获得1296个VAD扫描数据, 经过质量控制后, 保留了1277个)。
图7 反演风速 V f i t与观测风速 V t o w e r的对比

(a)S3处10°仰角VAD反演的10 m风速, (b)S1处10°仰角VAD 反演的 10 m风速, (c)S3处10°仰角VAD 反演的 70 m风速, (d)S3处30°仰角VAD反演的 70 m风速

Fig.7 Comparison of inversed wind speed V f i t with the observations V t o w e r.(a) 10 m wind speed inversed using VAD scans with 10° elevation angle at S3, (b) 10 m wind speed inversed using VAD scans with 10° elevation angle at S1, (c) 70 m wind speed inversed using VAD scans with 10° elevation angle at S3, (d) 70 m wind speed inversed using VAD scans with 30° elevation angle at S3

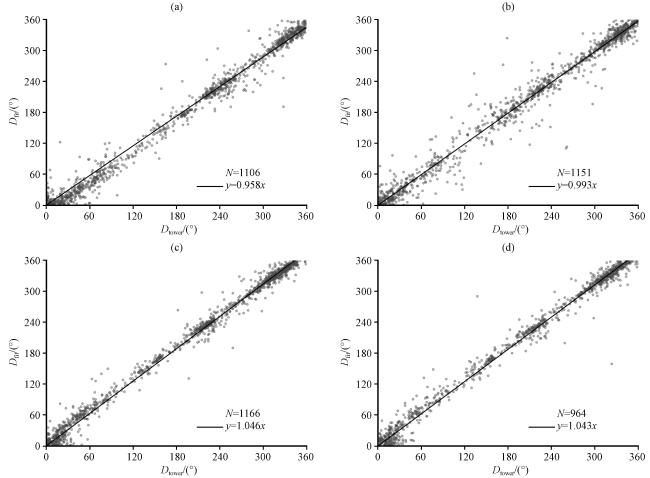
与风速的分析类似, 图8给出了利用优化方法和不同仰角(10°和30°)VAD径向风速反演得到的不同高度(10 m和70 m)的风向( D f i t)与测风塔实测风向( D t o w e r)进行预处理后对比的散点图[风向预处理方法见式(7)]。由于风向的过零特性, 没有对反演结果与观测值的偏差进行统计。在表2列出了决定系数对比的统计结果, 并进行了差异显著性检验。从表2图8可以看出, 与传统方法相比, 优化方法对风向的反演也有很大改进, 特别是在风电场内部, 优化方法的决定系数显著提高。
图8 反演风向 D f i t与观测风向 D t o w e r的对比

(a)S3处10°仰角VAD反演的10 m风向, (b)S1处10°仰角VAD 反演的 10 m风向, (c)S3处10°仰角VAD 反演的70 m风向, (d)S3处30°仰角VAD反演的 70 m风向

Fig.8 Comparison of inversed wind direction D f i t with observation D t o w e r.(a) 10 m wind direction inversed using VAD scans with 10° elevation angle at S3, (b) 10 m wind direction inversed using VAD scans with 10° elevation angle at S1, (c) 70 m wind direction inversed using VAD scans with 10° elevation angle at S3, (d) 70 m wind direction inversed using VAD scans with 30° elevation angle at S3

表1 10°仰角VAD反演风速与测风塔观测风速的比较

Table 1 Comparison between 10 m wind speed inversed using VAD scans with 10° elevation angle and tower measurements

观测点 高度/m 方法 决定系数 偏差/(m∙s-1 均方根误差/(m∙s-1 有效数据量/%
S1 10 优化 0.965 0.356 1.029 90.3
传统 0.934 0.399 1.433 96.4
S3 10 * 优化 0.932 0.454 1.240 86.3
传统 0.826 0.500 2.116 90.4
70 * 优化 0.958 0.034 1.102 91.3
传统 0.926 0.063 1.470 97.3

*表示优化方法反演结果与传统方法反演结果之间的差异通过了α = 0.05的显著性检验(indicate the difference between the inversion results of the optimized method and the traditional method has passed the significance test at α = 0.05)

表2 10°仰角VAD反演风向与测风塔观测风向的比较

Table 2 Comparison between 10 m wind direction inversed using VAD scans with 10° elevation angle and tower measurements

站点 高度/m 方法 斜率 决定系数
S1 10 优化 0.993 0.987
传统 0.990 0.977
S3 10 * 优化 0.958 0.992
传统 0.918 0.978
70* 优化 1.046 0.995
传统 1.044 0.983

*表示优化方法反演结果与传统方法反演结果的差异通过了α = 0.05的显著性检验(indicates the difference between the inversion results of the optimized method and the traditional method has passed the significance test at α = 0.05)

4.2 风廓线验证

结合激光雷达10°和30°仰角VAD扫描的反演结果, 可以得到垂直高度8~850 m的风廓线。本研究所用激光测风雷达可以输出DBS扫描模式下各高度层的风速和风向, 但在垂直高度50 m范围内存在盲区(Lane et al, 2013)。利用低仰角VAD扫描能够反演得到低层风场信息, 但随着探测高度的增加, 水平扫描范围增加, 反演算法中的水平均匀假设可能无法满足, 从而影响高层反演结果的准确性。DBS扫描模式得到的风廓线已被验证与风杯和超声风速计有良好的一致性(Dai et al, 2020夏俊荣等, 2011)。因此, 本节利用DBS扫描重构的50~1000 m的风廓线作为参考, 评估优化方法在提高高空反演结果准确性方面的效果。
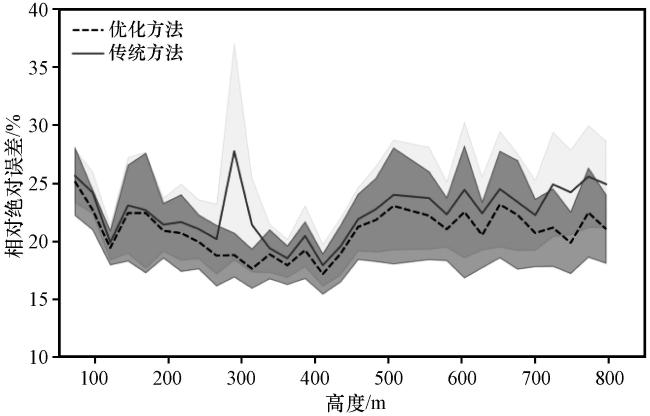
图9给出了在风电场内部(S3)用传统方法和优化方法反演得到的风速与DBS重构数据在各垂直高度上的相对绝对误差(RAE)。从图9中可以看出, 传统方法的RAE始终大于优化方法, 且波动较大, 某些高度RAE值异常大, 说明仅使用CNR作为数据质量控制标准会保留部分异常值, 导致反演结果误差偏大。优化方法的RAE主要分布在15%~23%, 且波动较小。整体而言, 在高度850 m以内, 优化方法反演得到的风速与DBS重构风速之间的RAE低于23%, 而传统方法反演得到的风速与DBS重构风速之间的RAE在500 m高度以上大于23%并随高度的增加而增加, 标准偏差也较大。上述对比表明, 与传统方法相比, 利用本研究提出的优化方法反演得到的风速与DBS重构的风速具有更好的一致性, 可以用于获得雷达探测盲区至850 m的风廓线信息。
图9 风电场内部(S3)优化(虚线)和传统方法(实线)反演的风速与DBS重构风速之间的RAE随垂直高度的变化

阴影区域为两种方法在95%置信区间内的标准偏差

Fig.9 RAE between the wind speeds inversed using the traditional method and the optimized method at S3 and those reconstructed by DBS.The shaded area represents the standard deviation with 95% confidence interval

5 结论

本研究利用单台扫描多普勒激光测风雷达获取的径向风速资料, 通过对比不同严格程度数据质量控制和优化方法反演得到的风速和风向的准确性, 提出了利用激光测风雷达VAD扫描方式获取的径向风速数据反演水平风速和风向所需的数据质量控制和优化方法: 首先利用 σ C N R剔除CNR异常偏大或偏小的数据后进行第一次正弦拟合, 然后剔除一次拟合结果中标准化残差绝对值 | Z e i |  > 2的数据点并进行第二次VAD拟合, 最终保留拟合优度大于0.65的反演结果, 得到以下结论:
(1) 本研究提出的优化方法反演结果的风速和风向与测风塔观测结果有很好的一致性, 利用该优化方法可以得到从近地面到风机叶片影响高度的完整垂直风廓线。
(2) 与传统的仅使用CNR阈值检测数据异常点(如剔除CNR < - 27   d B的数据)的方法相比, 利用 σ C N R对数据进行质量控制(剔除 C N R i - C N R ¯ > 1.2 σ C N R 的数 )可以改进拟合优度, 减小相对绝对误差; 进一步剔除经 σ C N R控制后 | Z e i |>2的数据点, 即可以在保留足够多的数据的同时(可用数据量大于90%), 提高拟合优度, 减小相对绝对误差。
(3) 利用优化方法反演得到的风速与测风塔观测风速之间的决定系数(R 2)高于传统方法, 均方根误差(RMSE)和偏差(Bias)均低于传统方法: 对于10 m风速, R 2由0.826提升至0.932, Bias从0.500 m∙s-1降低至0.454 m∙s-1; 对于10 m风向, R 2由0.978提升至0.992。说明优化方法提升了反演结果的准确性, 特别是在受风电场影响、 风场较复杂的风电场内, 优化方法的改进效果更加明显。
考虑到激光雷达DBS扫描模式在近地面存在探测盲区, 在实际应用中可以采用低仰角VAD扫描, 利用本研究提出的数据质量控制和优化反演方法得到DBS扫描模式盲区内的风场信息, 以获得从近地面到风机叶片影响区完整的风廓线。本研究为深入分析风机运行对风场的影响, 研究低空急流、 湍流和风特性等提供了数据方法, 未来还需利用不同气候背景、 不同地形区的数据验证和完善本研究提出的方法。

感谢龙源(北京)风电工程咨询有限公司为本次实验提供的现场支持。

Baidar S Wagner T J Turner D D, et al, 2023.Using optimal estimation to retrieve winds from velocity-azimuth display (VAD) scans by a Doppler lidar[J].Atmospheric Measurement Techniques16(15): 3715-3726.

Barthelmie R J Hansen K Frandsen S T, et al, 2009.Modelling and measuring flow and wind turbine wakes in large wind farms offshore[J].Wind Energy12(5): 431-444.

Bianco L James M W Banta R M2008.Convective boundary layer depth estimation from wind profilers statistical comparison between an automated algorithm and expert estimations[J].Journal of Atmospheric & Oceanic Technology25(8): 1397-1413.DOI: 10.1175/2008JTECHA981.1 .

Bodini N Zardi D Lundquist J K2017.Three-dimensional structure of wind turbine wakes as measured by scanning lidar[J].Atmospheric Measurement Techniques, 10: 2881-2896.DOI: 10. 5194/amt-10-2881-2017 .

Browning K A Wexler R1968.The determination of kinematic properties of a wind field using Doppler radar[J].Journal of Applied Meteorology7(1): 105-113.

Cao J Xue W Mao R, et al, 2023.Wind power in forested regions: power law extrapolation vs.lidar observation[J].Journal of Wind Engineering and Industrial Aerodynamics, 232: 105281.

Dai L Xin J Zuo H, et al, 2020.Multilevel validation of Doppler wind Lidar by the 325 m meteorological tower in the planetary boundary layer of Beijing[J].Atmosphere, 11: 1051.DOI: 10. 3390/atmos11101051 .

Debnath M Iungo G V Brewer W A, et al, 2017.Assessment of virtual towers performed with scanning wind lidars and Ka-band radars during the XPIA experiment[J].Atmospheric Measurement Techniques10(3): 1215-1227.

Emeis S Harris M Banta R M2007.Boundary-layer anemometry by optical remote sensing for wind energy applications[J].Meteorologische Zeitschrift16(4): 337-347.

Gao H Shen C Zhou Y, et al, 2022.A spatio-temporal neural network for fine-scale wind field nowcasting based on Lidar observation[J].IEEE Journal of Selected Topics in Applied Earth Observations and Remote Sensing, 15: 5596-5606.

Gryning S E Batchvarova E Brümmer B, et al, 2007.On the extension of the wind profile over homogeneous terrain beyond the surface boundary layer[J].Boundary-Layer Meteorology124(2): 251-268.

Huang M Gao Z Miao S, et al, 2017.Estimate of boundary-layer depth over Beijing, China, using Doppler Lidar data during SURF-2015[J].Boundary-Layer Meteorology, 162: 503-522.DOI: 10.1007/s10546-016-0205-2 .

Jiménez P A Dudhia J2013.On the ability of the WRF model to reproduce the surface wind direction over complex terrain[J].Journal of Applied Meteorology and Climatology52(7): 1610-1617.

Lane S E Barlow J F Wood C R2013.An assessment of a three-beam Doppler lidar wind profiling method for use in urban areas[J].Journal of Wind Engineering and Industrial Aerodynamics, 119: 53-59.DOI: 10.1016/j.jweia.2013.05.010 .

Lang S McKeogh E2011.LIDAR and SODAR measurements of wind speed and direction in upland terrain for wind energy purposes[J].Remote Sensing3(9): 1871-1901.

Lundquist J K Churchfield M J Lee S, et al, 2015.Quantifying error of lidar and sodar Doppler beam swinging measurements of wind turbine wakes using computational fluid dynamics[J].Atmospheric Measurement Techniques8(2): 907-920.

Päschke E Leinweber R Lehmann V2015.An assessment of the performance of a 1.5 μm Doppler lidar for operational vertical wind profiling based on a 1-year trial[J].Atmospheric Measurement Techniques8(6): 2251-2266.

Politis E S Prospathopoulos J Cabezon D, et al, 2012.Modeling wake effects in large wind farms in complex terrain: the problem, the methods and the issues[J].Wind Energy15(1): 161-182.

Singh K Bule L, Khan, M, et al, 2019.Wind energy resource assessment for Vanuatu with accurate estimation of Weibull parameters[J].Energy Exploration & Exploitation37(6), 1804-1833.

Smith D A Harris M Coffey A S, et al, 2006.Wind lidar evaluation at the Danish wind test site in Høvsøre[J].Wind Energy9(1/2): 87-93.

Srinivasulu, P, Yasodha, P, Kamaraj P, et al, 2012.1280-MHz active array radar wind profiler for lower atmosphere system description and data validation[J].Journal of Atmospheric and Oceanic Technology, 29: 1455-1470.

Vakkari V O’Connor E J Nisantzi A, et al, 2015.Low-level mixing height detection in coastal locations with a scanning Doppler lidar[J].Atmospheric Measurement Techniques8(4): 1875-1885.

Vanderwende B J Lundquist J K Rhodes M E, et al, 2015.Observing and simulating the summertime Low-Level Jet in Central Iowa[J].Monthly Weather Review143(6): 2319-2336.

Weitkamp C2005.Lidar, Range-Resolved optical remote sensing of the atmosphere[M].Lidar: Range-Resolved Optical Remote Sensing of the Atmosphere, 102.DOI: 10.1007/B106786 .

Xing J Shi J Lei Y, et al, 2016.Evaluation of HY-2A Scatterometer wind vectors using data from buoys, ERA-Interim and ASCAT during 2012-2014[J].Remote Sensing8(5): 390.

Yamada Y Chong M1999.Vad-based determination of the Nyquist internal number of Doppler velocity aliasing without wind information[J].Journal of the Meteorological Society of Japan77(2): 447-457.

冯长中, 吴松华, 刘秉义, 2018.相干多普勒激光雷达风场反演方法研究与实验印证[J].中国激光45(4): 309-317.

Feng C Z Wu S H Liu B Y2018.Research on wind retrieval method of coherent Doppler Lidar and experimental verification[J].Chinese Journal of Lasers45(4): 309-317.

顾桃峰, 岳海燕, 王四化, 等, 2024.一种基于多普勒原理的相干测风激光雷达及其外场应用[J].大气与环境光学学报19(01): 22-37.

Gu T F Yue H Y Wang S H, et al, 2024.A coherent wind lidar based on Doppler principle and its field application[J].Journal of Atmospheric and Environmental Optics19(1): 22-37.

惠小英, 高晓清, 桂俊祥, 等, 2011.酒泉风电基地高分辨率风能资源的数值模拟[J].高原气象30(2): 538-544.

Hui X Y Gao X Q Gui J X, et al, 2011.Numerical simulation of high resolution wind power resource in Jiuquan wind power base area[J].Plateau Meteorology30(2): 538-544.

李思, 章晓冬, 尕藏程林, 等, 2020.大型风力发电场对华北地区大气影响的数值模拟研究[J].高原气象39(2): 437-444.DOI:10.7522/j.issn.1000-0534.2019.00112.Li S

Zhang X D Ga Z C L, et al, 2019.Numerical simulations of the influence of Large-scale wind farms on meteorological conditions in North China[J].Plateau Meteorology39(2): 437-444.DOI:10.7522/j.issn.1000-0534.2019.00112 .

李耀华, 孔力, 2019.发展太阳能和风能发电技术加速推进我国能源转型[J].中国科学院院刊34(4): 426-433.DOI: 10.16418/j.issn.1000-3045.2019.04.007.Li Y H

Kong L2019.Developing solar and wind power generation technology to accelerate China's energy transformation[J].Bulletin of Chinese Academy of Sciences34(4): 426-433.DOI: 10.16418/j.issn.1000-3045.2019.04.007 .

裴丽丝, 邱崇践, 2013.多普勒雷达VAD风廓线资料的质量评估[J].热带气象学报29(4): 597-606.

Pei L S Qiu C J2013.The Assessment of velocity azimuth display technique of Doppler weather radar[J].Journal of Tropical Meteorology29(4): 597-606.

邱剑洪, 林寿南, 2019.海上风电发展现状及大规模接入对电网影响分析[J].电工电气, (12): 74-76.Qiu J H, Lin S N, 2019.Analysis of the development status of offshore wind power and the impact of large-scale access on the power grid[J].Electrotechnics Electric (12): 74-76.

谭忠富, 鞠立伟, 2013.中国风电发展综述: 历史、 现状、 趋势及政策[J].华北电力大学学报(社会科学版), (2): 1-7.Tan Z F, Ju L W, 2013.Review of China's wind power development: history, current status, trends and policy[J].Journal of North China Electric Power University(Social Sciences) (2): 1-7.

王国成, 孙东松, 段连飞, 等, 2015.多普勒测风激光雷达风场数据影响因素分析[J].光学学报35(9): 18-24.Wang G C, Sun D S, Duan L F, et al, 2015.Wang G C, Sun D S, Duan L F, et al, 2015.Analysis of factors affecting the data accuracy of Doppler Wind Lidar[J].Acta Optica Sinica, 35(9): 0901003.

夏俊荣, 王普才, 闵敏, 2011.新型多普勒测风激光雷达Windcube的风参数观测与验证[J].气候与环境研究16 (6), 733-741.Xia J R, Wang P C, Min M, 2011.Observation and validation of wind parameters measured by Doppler Wind Lidar Windcube[J].Climatic and Environmental Research, 16(6): 733-741.DOI: 10.3878/j.issn.1006-9585.2011.06.07 .

夏馨, 余晔, 董龙翔, 等, 2022.风电场建设前后近地面湍流强度变化特征[J].高原气象41(4): 1062-1073.DOI: 10.7522/j.issn.1000-0534.2021.00005.Xia X

Yu, Y, Dong L X, et al, 2020.Characteristics of near surface turbulence intensity before and after wind farm construction[J].Plateau Meteorology41(4): 1062-1073.DOI: 10.7522/j.issn.1000-0534.2021.00005 .

肖艳姣, 万玉发, 吴涛, 等, 2015.基于多普勒天气雷达的两种垂直风廓线反演方法的对比分析[J].高原气象34(1): 288-297.DOI: 10.7522/j.issn.1000-0534.2013.00136.Xiao Y J

Wan Y F Wu T, et al, 2015.Intercomparison of vertical wind profiles retrieved using two techniques from Doppler weather radar[J].Plateau Meteorology34(1): 288-297.DOI: 10.7522/j.issn.1000-0534.2013.00136 .

张双益, 胡非, 2017.大气边界层与风力发电的相互作用研究综述[J].高原气象36(4): 1127-1137.DOI: 10.7522/j.issn.1000-0534.2016.00095.Zhang S Y

Hu F2017.Review on study of atmospheric boundary layer and wind power generation interaction[J].Plateau Meteorology36(4): 1127-1137.DOI: 10.7522/j.issn.1000-0534.2016.00095 .

文章导航

/