
1 引 言
2 数据来源与方法介绍
2.1 数据来源
2.1.1 观测数据
2.1.2 模式数据
表1 本研究使用的8个地球-气候系统模式基本信息Table 1 Basic information on the 8 Earth-Climate System Models in this study |
| 序号 | 模式 | 所属国家 | 研发机构 |
|---|---|---|---|
| A | CNRM-ESM2-1 | 法国 | CNRM-CERFACS |
| B | GFDL-ESM4 | 美国 | NOAA-GFDL |
| C | IITM-ESM | 印度 | CCCR-IITM |
| D | INM-CM4-8 | 俄罗斯 | INM |
| E | INM-CM5-0 | 俄罗斯 | INM |
| F | IPSL-CM6A-LR | 法国 | IPSL |
| G | MIROC-ES2L | 日本 | MIROC |
| H | NESM3 | 中国 | NUIST |
表2 NEX-GDDP-CMIP6情景比较计划-核心试验情景的基本信息Table 2 Basic information about core experiments in ScenarioMIP in NEX-GDDP-CMIP6 |
| 情景 | 辐射强迫类型 | 2100年辐射强迫/(W·m-2) | 共享社会经济路径 | 情景描述 |
|---|---|---|---|---|
| SSP1-2.6 | 低 | 2.6 | SSP 1(可持续发展) | 低脆弱性、 低减缓压力和低辐射强迫的综合影响 |
| SSP2-4.5 | 中 | 4.5 | SSP 2(中等发展) | 中等社会脆弱性与中等辐射强迫的组合 |
| SSP3-7.0 | 高 | 7.0 | SSP 3(局部发展) | 高社会脆弱性与相对高的人为辐射强迫的组合 |
| SSP5-8.5 | 高 | 8.5 | SSP 5(常规发展) | 高排放、 高强迫组合的发展路径 |
2.2 研究方法
2.2.1 空间相关系数
2.2.2 泰勒图
2.2.3 一元线性回归
2.2.4 研究时段和海拔范围划分
3 结果分析
3.1 模式对秦岭气温变化的模拟能力评估
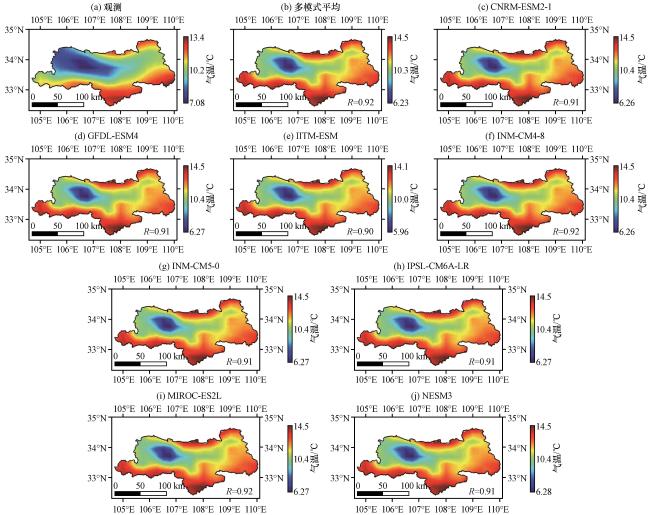
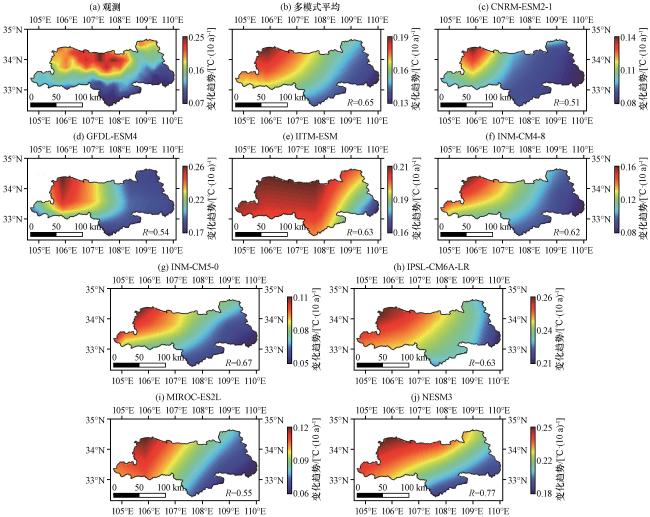

图4 1961 -2014年观测和模拟的秦岭年平均气温的时间序列与时间尺度泰勒图 每个字母代表一个模式, 参见表1, REF代表观测, I代表多模式平均Fig.4 Time series of annual mean air temperature in observation and model simulation over Qinling Mountains for 1961 -2014 and Taylor diagrams for temporal scale.Each letter represents a model, see Table 1; Irepresent the MME, and REF represents the observations |
3.2 2015 -2100年秦岭气温变化特征
3.2.1 气温年际变化特征
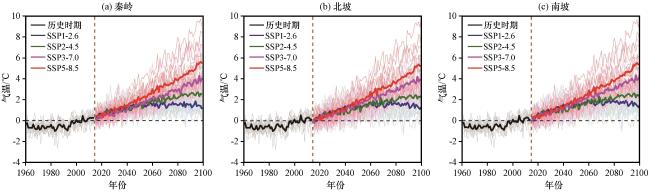
图5 1961 -2100年不同情景下8个NEX-GDDP-CMIP6模式与多模式集合平均模拟的秦岭(a)、 北坡(b)、 南坡(c)年平均气温相对于1995 -2014年的变化Fig.5 Changes of annual mean air temperature over Qinling Mountains (a) and its North Slope (b) and South Slope (c) during 1961 -2100 relative to 1995 -2014 from 8 NEX-GDDP-CMIP6 models and multi-model ensemble means under different SSP scenarios |
3.2.2 气温变化趋势的空间特征
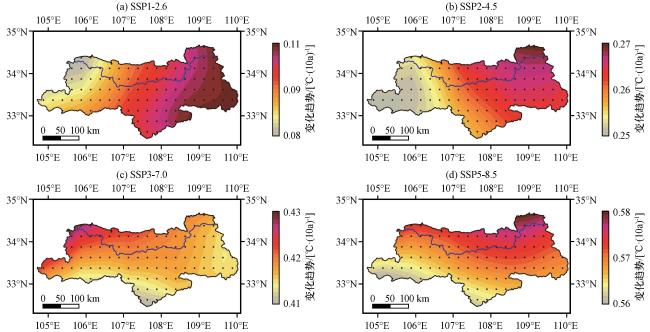
图6 2015 -2100年不同情景下多模式集合平均的秦岭气温线性变化趋势[单位: ℃·(10a)-1]黑点代表趋势通过了95%的可信度检验Fig.6 Linear trends of annual mean air temperature from multi-model ensemble mean over Qinling Mountains for 2015 -2100 under different SSP scenarios.Unit: ℃·(10a)-1.Black dot represents individual grid box with significant trends at the 95% confidence level |
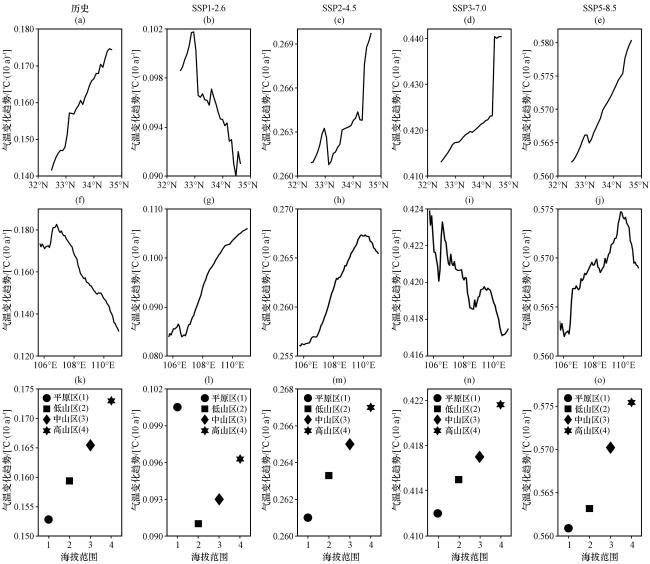
图7 秦岭历史时期(1961 -2014年)和未来(2015 -2100年)不同情景下多模式集合平均的气温变化趋势随纬度(上)、 经度(中)和海拔范围(下)的变化Fig.7 The trend variations of annual mean air temperature from multi-model ensemble mean over the Qinling Mountains under different SSP scenarios for historical (1961 -2014) and future (2015 -2100) periods across latitude (up), longitude (middle), and elevation (down) ranges |
3.3 21世纪不同时期秦岭气温的变化幅度
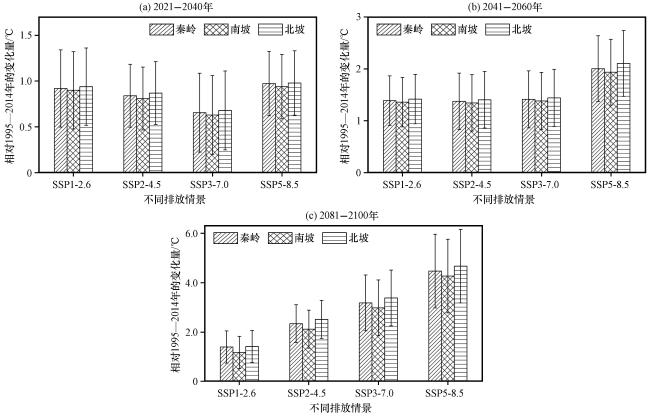
图9 4种排放情景下秦岭地区、 南坡和北坡不同时期年平均气温相对1995 -2014年的变化 误差棒代表1.5倍标准差范围(单位: ℃)Fig.9 Changes of annual mean air temperature over Qinling Mountains, and its South and North slope during different periods relative to 1995 -2014 under the four SSP scenarios.The errorbar indicates ±1.5 standard deviation (unit: ℃) |