
1 引言
2 资料来源与方法介绍
2.1 个例简介
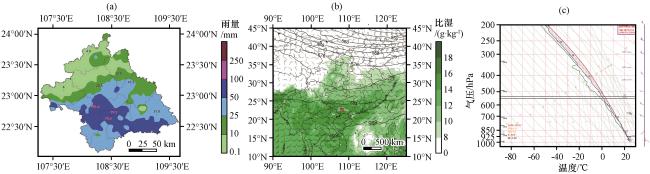
图1 2022年5月12日03:00 -09:00南宁市6 h累计雨量(a, 单位: mm), 5月11日20:00的500 hPa位势高度场(黑线, 单位: dagpm)和700 hPa垂直速度(白线, 单位: Pa·s-1)、 850 hPa风场(凤羽, 单位: m·s-1)和比湿(填色, 单位: g·kg-1)(b)以及5月11日20:00南宁站探空资料(c)图(b)中红点位置为南宁 Fig.1 6 h accumulated precipitation in Nanning from 03:00 to 09:00 on May 12th (a, unit: mm), 500 hPa geopotential height field (black line, unit: dagpm) and 700 hPa vertical velocity (white line, unit: Pa·s-1), 850 hPa wind field (windbarb, unit: m·s-1) and specific humidity (contour filling, unit: g·kg-1) at 20:00 on May 11, 2022 (b), and sounding data at Nanning station at 20:00 on May 11, 2022 (c).In Fig.1(b), the location of the red dot is Nanning |
2.2 数据与方法
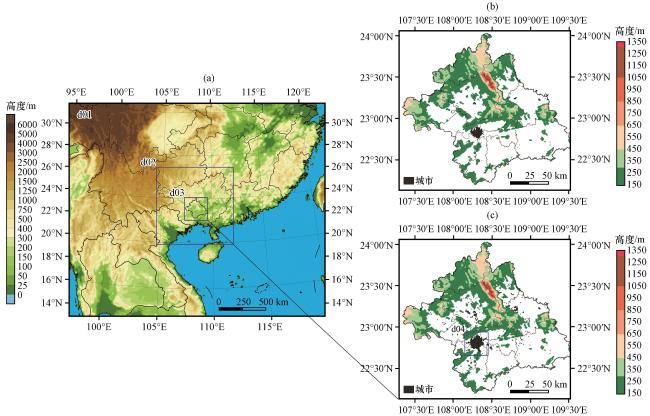
图2 WRF模式嵌套区域范围及海拔分布(a, 单位: m), 南宁市海拔(单位: m)及2000年(b)和2020年(c) do3区域城市地表分布图(c)中d04区域为南宁主城区 Fig.2 Nested region coordinates range and altitude distribution of the WRF model (a, unit: m), altitude distribution (unit: m) and urban ground at Nanning City in d03 area in 2000 (b) and 2020 (c).In Fig.(c), d04 area is the urban area of Nanning |
3 数值试验结果
3.1 模拟的降水
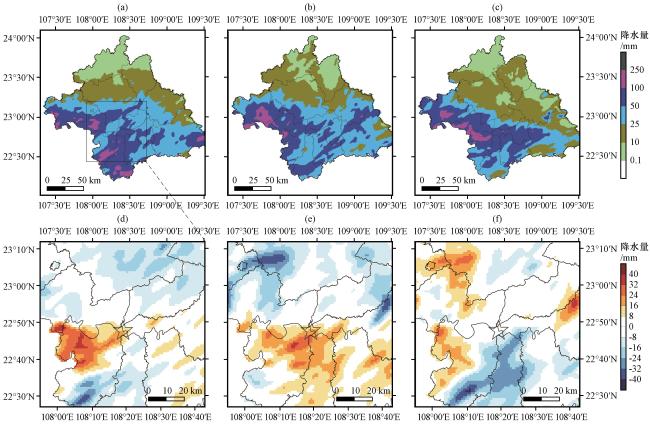
图3 各组试验方案模拟得到的5月12日03:00 -09:00累计降雨量和差值(单位: mm)(a)Old, (b)New, (c)UCM, (d)UCM与Old相减, (e)UCM与New相减, (f)New与Old相减; 五角星的位置为南宁城区中心22.8°N, 108.3°E Fig.3 Accumulated precipitation and difference from 03:00 to 09:00 on May 12th (unit: mm)(a) Old; (b) New; (c) UCM; (d) UCM.minus.Old; (e) UCM.minus.New; (f) New.minus.Old.The location of the star is the center of Nanning urban, 22.8°N, 108.3°E |
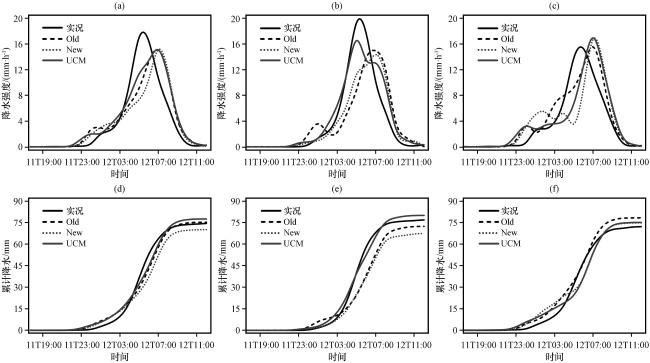
图4 5月11日17:00至12日12:00南宁城市降水强度(a~c)和累计降水(d~f)演变(a, d)主城区和郊区, (b, e)主城区(d04), (c, f)郊区 Fig.4 The evolution of precipitation rate (a~c) and accumulated precipitation (d~f) in Nanning city from 11:00 on May 11th to 11:00 on May 12th.(a, d) Urban and suburban, (b, e) Urban (d04 area), (c, f) Suburban |
表1 各组试验方案模拟的5月11日17:00至12日12:00的南宁城市降水峰值和累计雨量与实况观测对比Table 1 The comparison of the precipitation peaks and cumulative rainfall simulated by each experimental scheme with observations in Nanning City from May 11, 17:00 to May 12, 12:00 |
| 区域 | Old试验 | New试验 | UCM试验 | |
|---|---|---|---|---|
| 降水峰值 | 市区 | -13% | -10% | -12% |
| 主城区 | -27% | -29% | -16% | |
| 郊区 | -1% | +15% | +15% | |
| 累计雨量 | 市区 | +1% | -6% | +4% |
| 主城区 | -6% | -11% | +4% | |
| 郊区 | +7% | +4% | +4% |
“+”表示模拟结果多于观测; “-”表示模拟结果少于观测 ("+" means that the simulation results are more than the observations; "-" indicates that the simulation result is less than the observation) |
3.2 模拟的对流降水回波

图5 5月12日05:00和08:00组合反射率(单位: dBZ)和10 m风场(单位: m·s-1), 以及组合反射率与u、 w×5合成风(单位: m·s-1)通过南宁城区中心(22.8°N, 108.3°E)的垂直剖面(a~d)Old, (e~h)New, (i~l)UCM Fig.5 The combined reflectivity (unit: dBZ) and 10 m wind field (unit: m·s-1) at 05:00 and 08:00 on May 12th, vertical profile of the combined reflectivity and u, w×5 synthetic wind (unit: m·s-1) passing through (22.8°N, 108.3°E).(a~d) Old, (e~h) New, (i~l) UCM |
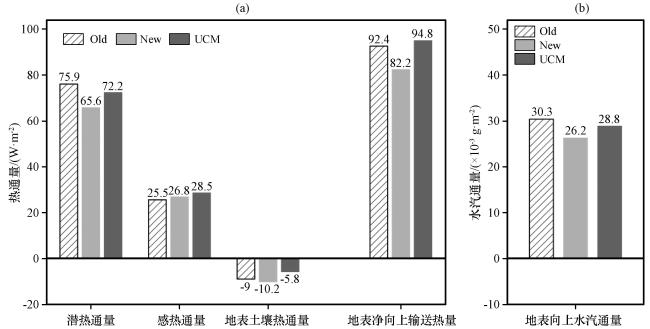
3.3 城市地表热量的垂直输送
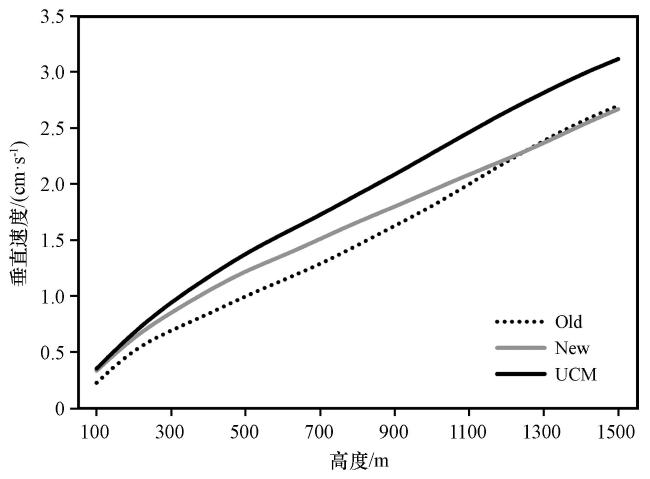
3.4 边界层大气
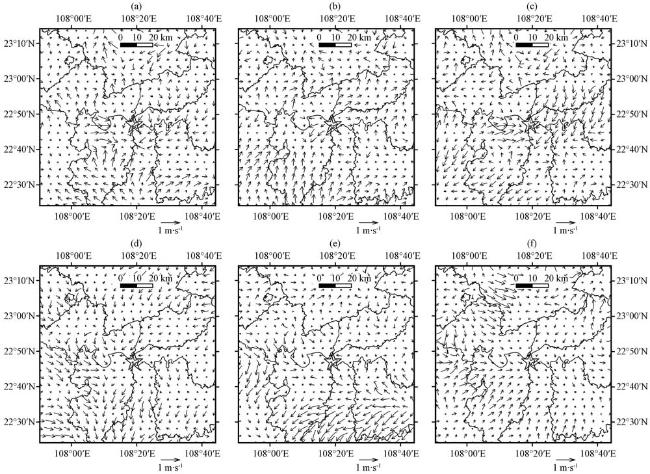
图7 10 m平均风场差异(单位: m·s-1)降水前期(a~c)和降水发展阶段(d~f)(a, d)UCM与Old相减, (b, e)UCM与New相减, (c, f)New与Old相减 Fig.7 Average wind field at 10 meters (unit: m·s-1) during the early stage (a~c) and the development stage (d~f) of rainfall periods.(a, d) UCM minus Old, (b, e) UCM minus New; (c, f) New minus Old |

图8 5月11日21:00至12日12:00南宁城市(a~c)下风区、 (d~f)主城区、 (g~i)上风区的水平风速平均散度时空变化(单位: ×10-5 s-1)(a, d, g) Old, (b, e, h) New, (c, f, i) UCM Fig.8 The average divergence of horizontal wind speed (unit: ×10-5 s-1) in the downwind (a~c), urban (d~f), and upwind (g~i) of Nanning city from 21:00 on May 11th to 12:00 on May 12th.(a, d, g) Old, (b, e, h) New, (c, f, i) UCM |
3.5 能量条件
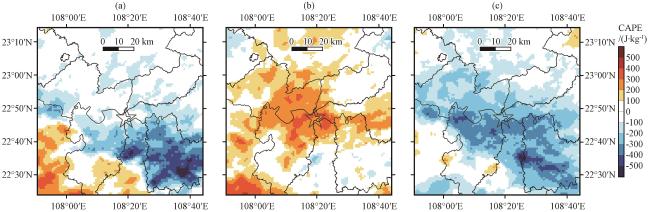
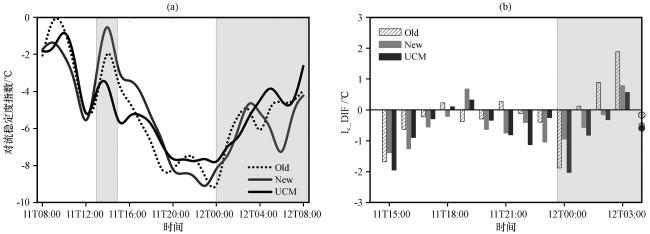
图11 5月11日08:00至12日08:00的对流稳定度指数(Ic, 单位: ℃)(a)时间序列(d04区域); (b)城区与郊区相减(圆圈代表平均值; 阴影部分为降雨时段) Fig.11 Convection stability index from 08:00 on May 11th to 08:00 on May 12th.(Ic, unit: ℃).(a) Time series (d04 area); (b) Urban minus Suburban (circles represent the average value, and shaded represent rainfall periods) |
3.6 低涡-降水-凝结潜热的正反馈
3.7 云物理过程
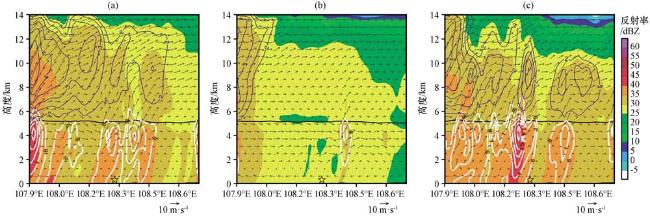
图13 5月12日05:00组合反射率(单位: dBZ)、 u、 w×10合成风(单位: m·s-1)、 液态与冰相粒子混合比(单位: g·kg-1; 白线表示液相物, 蓝线表示冰相物, 黑线为0 ℃层高度)通过(22.8°N, 108.3°E)的垂直剖面(a)Old, (b)New, (c)UCM Fig.13 Vertical profiles of combined reflectivity (unit: dBZ), u, w×10 synthetic wind (unit: m·s-1), liquid and ice phase particle mixing ratio (unit: g·kg-1; white line represents liquid phase material, blue line represents ice phase material, black line is the height of the 0 ℃ layer) passing through (22.8°N, 108.3°E) at 05:00 on May 12th.(a) Old, (b) New, (c) UCM |
