
1 引言
2 强降水天气个例和资料
2.1 个例简介
2.2 数值预报产品资料
2.3 再分析资料
3 方法和试验方案
3.1 ANO方法
3.2 订正试验方案
4 预报环流场订正
4.1 位势高度

图1 2019年6月20 -22日SWMS模式预报和ANO订正的500 hPa(上)、 700 hPa(中)、 850 hPa(下)位势高度场平均距平相关系数(左)和均方根误差(右, 单位: gpm)的时间演变Fig.1 Temporal evolution of the mean ACC (left) and RMSE (right, unit: gpm) for the 500 hPa (top), 700 hPa (middle), and 850 hPa (bottom) geopotential height from the SWMS model forecast and ANO correction, initiated on June 20-22, 2019 |
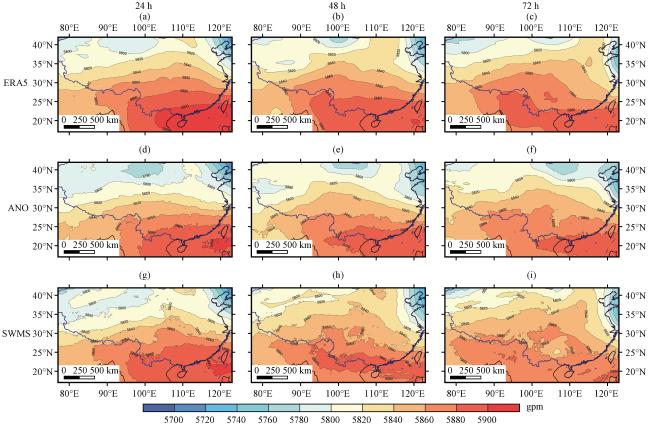
图2 2019年6月20日24 h(左)、 48 h(中)和72 h(右)500 hPa位势高度的ERA5再分析场(a、 b、 c)、 ANO订正(d、 e、 f)和SWMS模式预报(g、 h、 i)对比(单位: gpm)Fig.2 Comparison of the ERA5 reanalysis data (a, b, c), ANO correction (d, e, f), and SWMS model forecast (g, h, i) for the 500 hPa geopotential height at 24-hour (left), 48-hour (middle), and 72 hour (right) initiated on June 20, 2019.Unit: gpm |
4.2 比湿
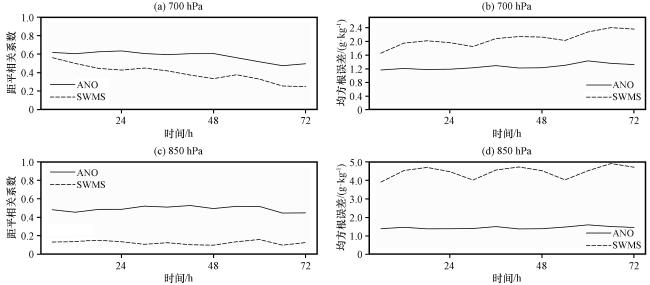
图3 2019年6月20 -22日SWMS模式预报和ANO订正的700 hPa(上)和850 hPa(下)比湿平均距平相关系数(左)、 均方根误差(右、 单位: g·kg-1)的时间演变Fig.3 Temporal evolution of the mean ACC (left) and RMSE (right, unit: g·kg-1) for the 700 hPa (top) and 850 hPa (bottom) specific humidity from the SWMS model forecast and ANO correction, initiated on June 20 -22, 2019 |
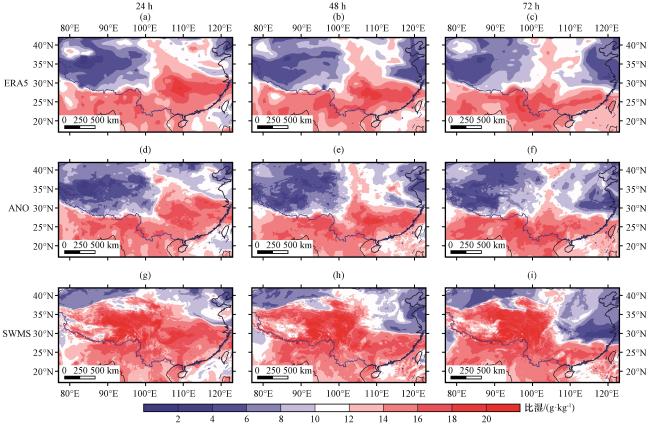
图4 2019年6月20日24 h(左)、 48 h(中)和72 h(右)850 hPa比湿的ERA5再分析场(a、 b、 c)、 ANO订正(d、 e、 f)和SWMS模式预报(g、 h、 i)对比(单位: g·kg-1)Fig.4 Comparison of the ERA5 reanalysis data (a, b, c), ANO correction (d, e, f), and SWMS model forecast (g, h, i) for the 850 hPa specific humidity (unit: g·kg-1) at 24-hour (left), 48-hour (middle), and 72-hour (right) initiated on June 20, 2019 |
4.3 温度场
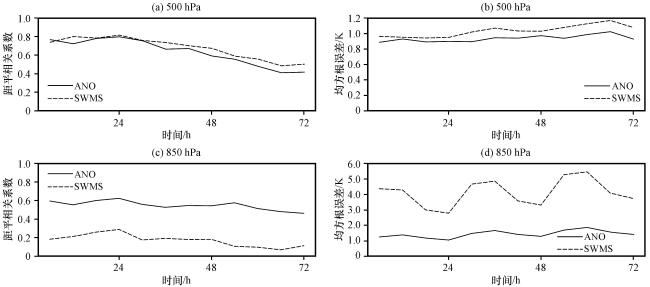
图5 2019年6月20 -22日SWMS模式预报和ANO订正的500 hPa(上)、 850 hPa(下)温度平均距平相关系数(左)和均方根误差(右, 单位: K)的时间演变Fig.5 Temporal evolution of the mean ACC (left) and RMSE (right, unit: K) for the 500 hPa (top) and 850 hPa (bottom) temperature from the SWMS model forecast and ANO correction, initiated on June 20 -22, 2019 |
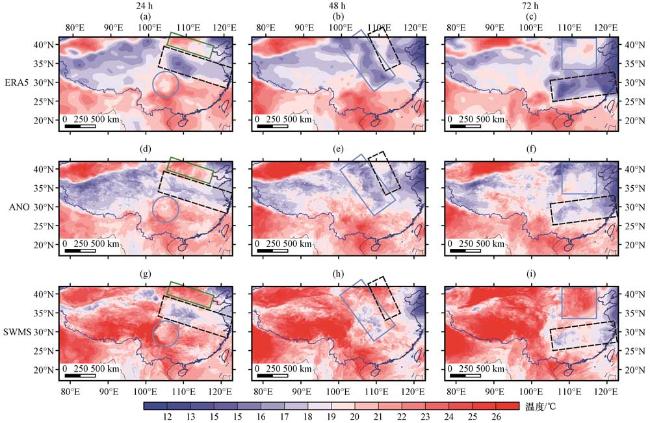
图6 2019年6月20日24 h(左)、 48 h(中)和72 h(右)850 hPa温度场的ERA5再分析场(a、 b、 c)、 ANO订正(d、 e、 f)和SWMS模式预报(g、 h、 i)对比(单位: ℃)Fig.6 Comparison of the ERA5 reanalysis data (a, b, c), ANO correction (d, e, f), and SWMS model forecast (g, h, i) for the 850 hPa temperature (unit: ℃) at 24-hour (left), 48-hour (middle), and 72-hour (right) initiated on June 20, 2019 |
4.4 水平风场
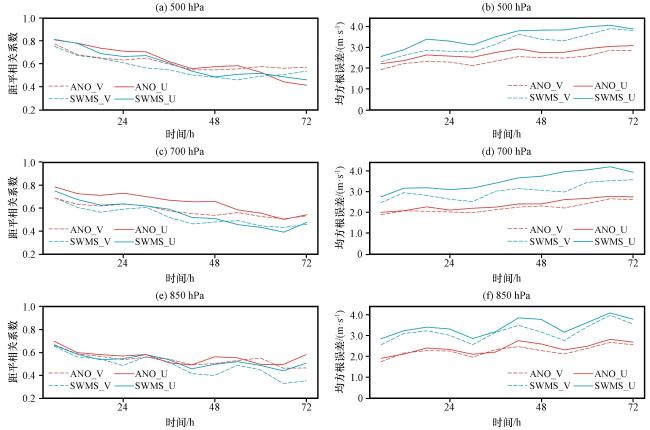
图7 2019年6月20 -22日SWMS模式预报和ANO订正的500 hPa(上)、 700 hPa(中)、 850 hPa(下) 水平风u分量(实线)及v分量(虚线)平均距平相关系数(左)和均方根误差(右, 单位: m·s-1)的时间演变Fig.7 Temporal evolution of the mean ACC (left) and RMSE (right, unit: m·s-1) for the u-component (solid line) and v-component (dashed line) of the horizontal wind at 500 hPa (top), 700 hPa (middle), and 850 hPa (bottom) from the SWMS model forecast and ANO correction, initiated on June 20 -22, 2019 |
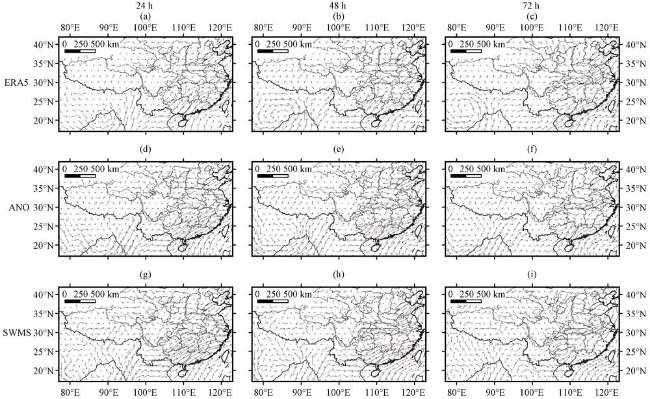
图8 2019年6月20日24 h(左)、 48 h(中)和72 h(右)850 hPa水平风场的ERA5再分析场(a、 b、 c)、 ANO订正(d、 e、 f)和SWMS模式预报(g、 h、 i)对比(单位: m·s-1)Fig.8 Comparison of the ERA5 reanalysis data (a, b, c), ANO correction (d, e, f), and SWMS model forecast (g, h, i) for the 850 hPa horizontal wind (unit: m·s-1) at 24-hour (left), 48-hour (middle), and 72-hour (right) initiated on June 20, 2019 |