
1 引言
2 资料来源与方法介绍
2.1 资料来源
表1 本文所用数据列表Table 1 List of data used in this article |
| 数据来源 | 时间段 | 所用主要参数 | 水平分辨率 | 垂直分辨率 | 用途 | |
|---|---|---|---|---|---|---|
| GPM | PF数据集 | 2014年3月至2023年7月 | 年、 月、 日、 时、 经度、 纬度、 像元数、 30 dBZ最大回波高度、 对流性降水像元数 | - | - | 降水云体时空分布的统计分析 |
| 2ADPR | 2022年6 -8月 | 经度、 维度、 风暴顶高度、 近地面反射率因子、 粒子谱、 近地面雨强、 降水类型 | 5 km | 125 m | 中尺度系统个例的垂直结构及微物理过程分析 | |
| S波段雷达 | 基数据 | 2022年6 -8月 | 反射率因子 | - | - | 判别对流的发展阶段 |
2.2 方法
3 中尺度对流系统的时空分布特征
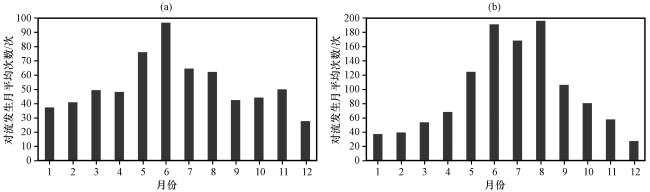
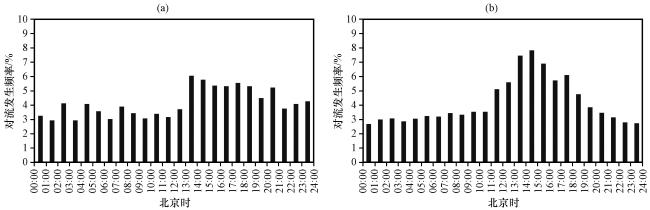
3.1 季节变化与日变化
表2 2014年3月至2023年2月华东地区对流系统发生数量季节分布Table 2 The amount of convective systems occurring in different seasons in East China from March 2014 to February 2023 |
| 类型 | 对流系统发生数量/次 | |||
|---|---|---|---|---|
| 春季 | 夏季 | 秋季 | 冬季 | |
| 所有对流系统 | 3851 | 7076 | 3439 | 1893 |
| MCSs | 1596 | 2010 | 1233 | 955 |
| sub-MCSs | 2255 | 5066 | 2206 | 938 |
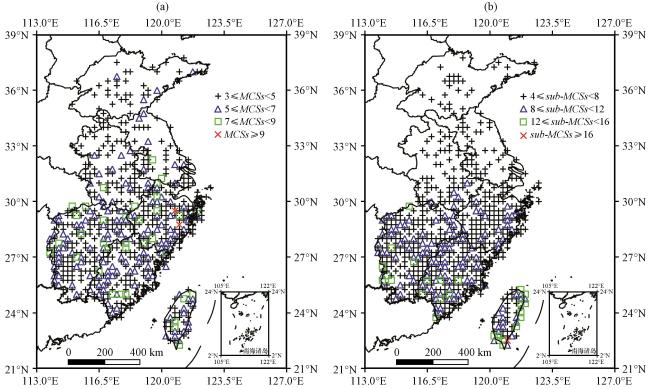
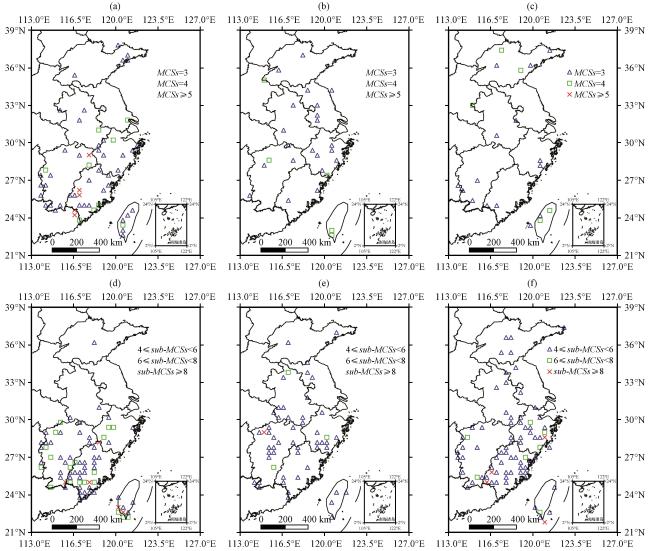
3.2 地理分布
4 中尺度对流系统的宏微观结构特征
4.1 MCSs的雷达回波演变
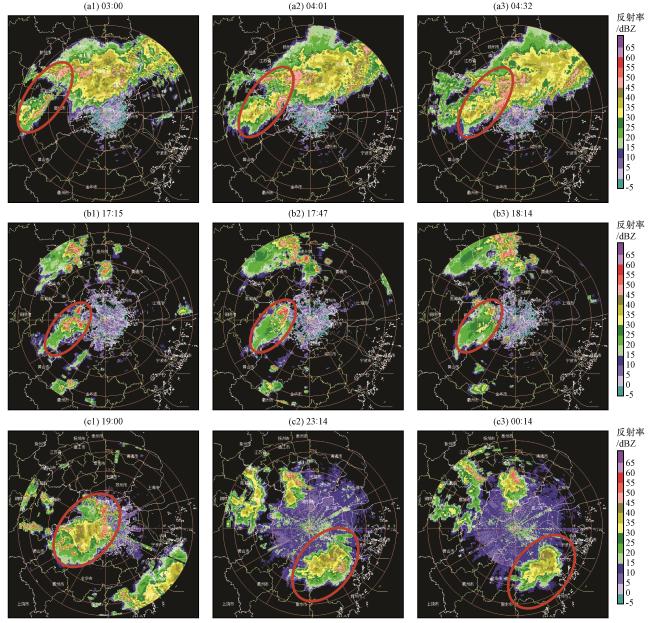
图5 2022年6月24日(a1~a3)、 7月28日(b1~b3)湖州多普勒雷达和8月26日(c1~c3)杭州多普勒雷达不同时次的组合反射率(单位:dBZ)红色椭圆为所关注的MCSs Fig.5 Different time of composite reflectivity (unit: dBZ) by Huzhou Doppler radar on 24 June 2022 (a1~a3), 28 July 2022 (b1~b3) and composite reflectivity (unit: dBZ) by Hangzhou Doppler radar on 26 August 2022 (c1~c3).The red ellipse represents the MCSs of interest |
4.2 MCSs水平分布特征
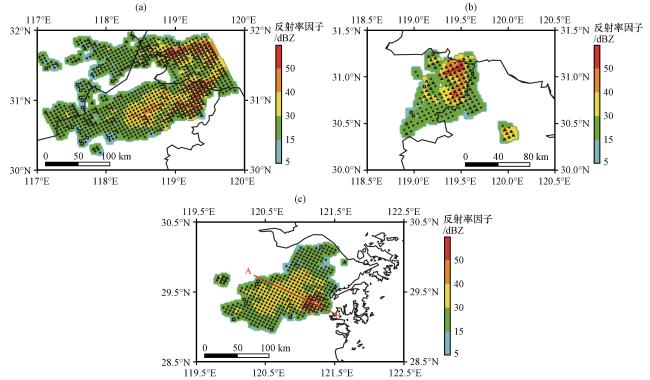
图6 6月24日(a)、 7月28日(b)和8月26日(c)MCSs的近地面反射率因子(彩色区, 单位: dBZ)及不同降水类型分布△表示对流性降水, +表示层云性降水, □表示其他降水 Fig.6 Reflectivity factor at near surface (color area, unit: dBZ) and distribution of different precipitation types of MCSs on 24 June (a), 28 July (b) and 26 August (c).Triangle marks represent convective precipitation, cross marks represent stratiform precipitation, and square marks represent other precipitation |
表3 不同MCSs云系的特征Table 3 Cloud characteristics of different MCSs |
| MCSs个例 | 降水类型 | 平均近地面雨强/(mm·h-1) | 不同强度雨强占比 | 平均回波顶高/km | ||
|---|---|---|---|---|---|---|
| 1 mm·h-1 | 1~5 mm·h-1 | 5 mm·h-1 | ||||
| 20220624 | 层云性降水 | 2.4 | 43.9% | 43.2% | 12.9% | 7.6 |
| 对流性降水 | 12.0 | 20.0% | 35.0% | 45.0% | 9.2 | |
| 20220728 | 层云性降水 | 1.1 | 78.1% | 20.5% | 1.4% | 11.5 |
| 对流性降水 | 5.8 | 32.1% | 39.7% | 28.2% | 12.8 | |
| 20220826 | 层云性降水 | 2.4 | 52.6% | 35.4% | 12.0% | 9.3 |
| 对流性降水 | 10.5 | 23.8% | 33.5% | 42.7% | 10.4 | |
4.3 MCSs垂直结构特征
4.3.1 反射率因子的垂直分布
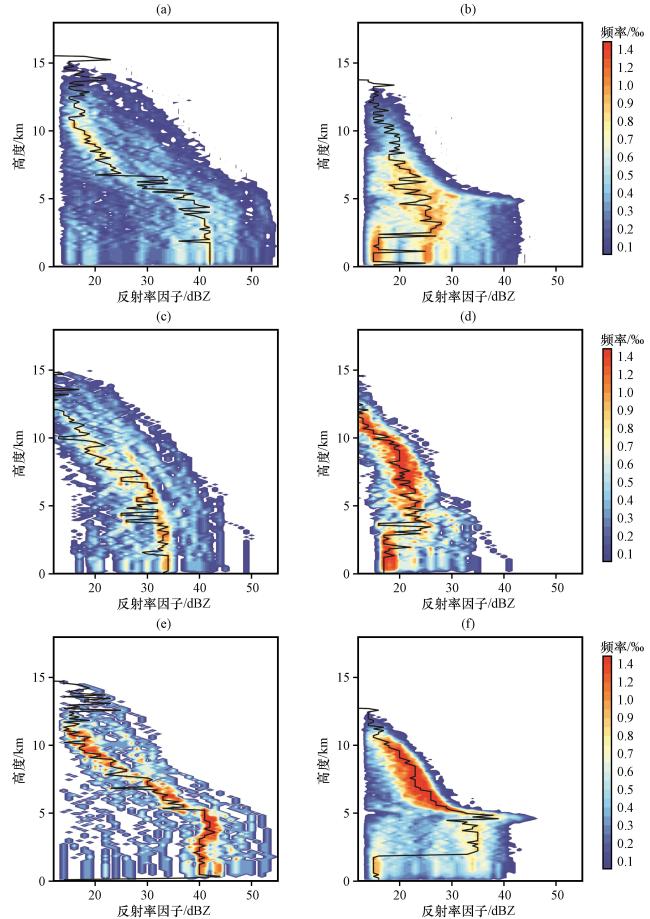
图8 6月24日(a~b)、 7月28日(c~d)和8月26日(e~f) MCSs中对流性降水(左)与层云性降水(右)的反射率因子归一化等高频率(单位: ‰)分布黑色实线为反射率因子最大频率廓线 Fig.8 Normalized contoured frequency by altitude diagrams (unit: ‰) of reflectivity factor for MCSs on 24 June (a~b), 28 July (c~d) and 26 August (e~f).The left three subgraphs represent convective precipitation and the right three subgraphs represent stratiform precipitation.The black solid line indicate maximum frequency profile of reflectivity factor |
4.3.2 降水粒子的垂直分布
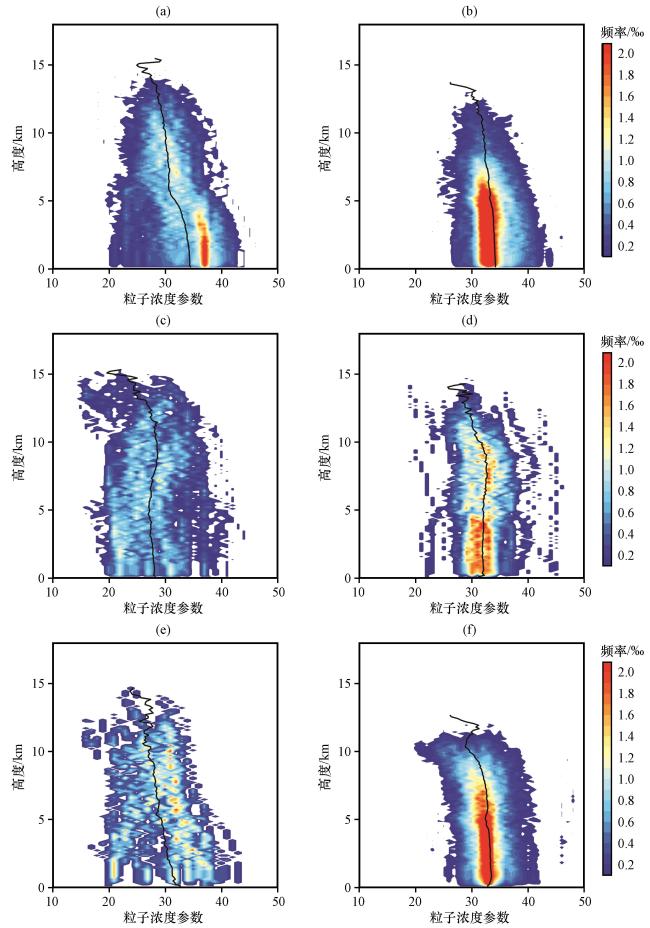
图9 6月24日(a~b)、 7月28日(c~d)和8月26日(e~f) MCSs中对流性降水(左)与层云性降水(右)的dBNw归一化等高频率(单位: ‰)分布黑色实线为dBNw平均值廓线 Fig.9 Normalized contoured frequency by altitude diagrams (unit: ‰) of dBNw for MCSs on 24 June (a~b), 28 July (c~d) and 26 August (e~f).The left three subgraphs represent convective precipitation and the right three subgraphs represent stratiform precipitation.The black solid line indicate mean frequency profile of dBNw |
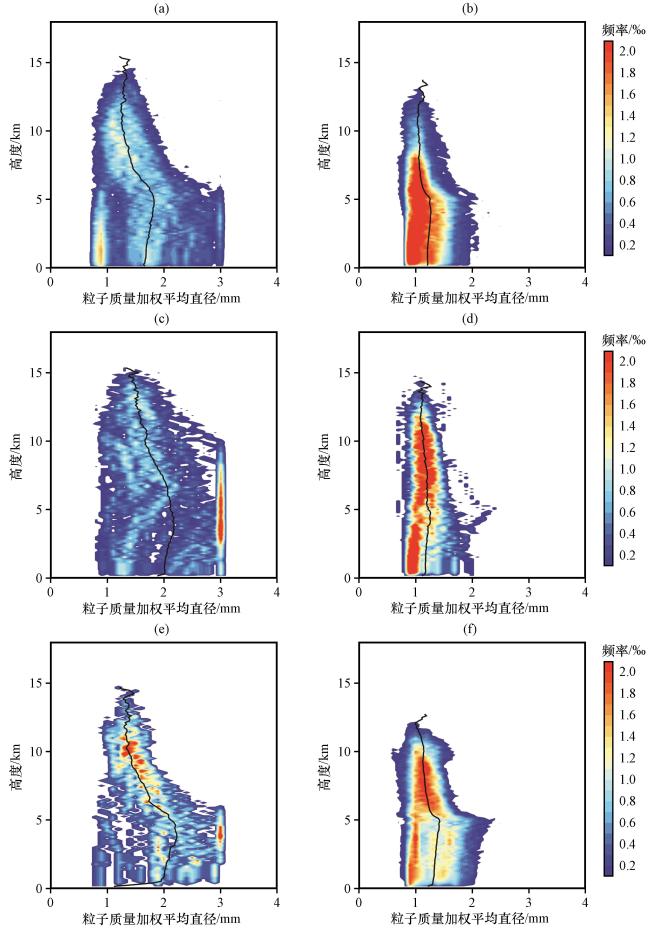
图10 6月24日(a~b)、 7月28日(c~d)和8月26日(e~f) MCSs中对流性降水(左)与层云性降水(右)的Dm归一化等高频率(单位: ‰)分布黑色实线为Dm平均值廓线 Fig.10 Normalized contoured frequency by altitude diagrams (unit: ‰) of Dm for MCSs on 24 June (a~b), 28 July (c~d) and 26 August (e~f).The left three subgraphs represent convective precipitation and the right three subgraphs represent stratiform precipitation.The black solid line indicate mean frequency profile of Dm |
4.4 sub-MCSs的云系特征
表4 不同sub-MCSs个例的云系特征Table 4 Cloud characteristics of different sub-MCSs |
| sub-MCSs个例 | 平均近地面雨强/(mm·h-1) | 平均回波顶高/km | 最大回波顶高/km | 平均dBNw | 平均Dm/mm |
|---|---|---|---|---|---|
| 20220628 | 1.6 | 9.9 | 16.8 | 27.5 | 1.7 |
| 20220725 | 1.5 | 11.8 | 15.7 | 26.8 | 1.8 |
| 20220824 | 2.0 | 8.6 | 12.6 | 26.7 | 1.7 |