
1 引言
2 仪器和数据处理
2.1 观测仪器
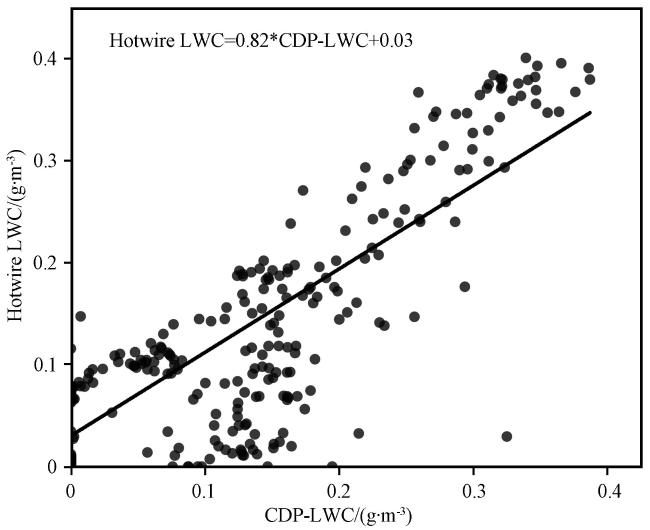
图1 CDP-LWC和Hotwire LWC的比较黑线代表最佳拟合线 Fig.1 Comparison of the CDP-LWC and Hotwire LWC.The black line is the linear best fit line |
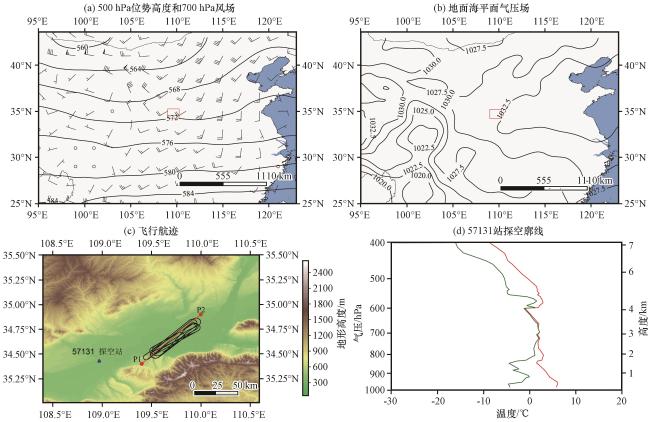
图2 2021年12月8日08:00 500 hPa位势高度(等值线, 单位: dagpm)、 700 hPa风场(单位: m·s-1)(a)和海平面气压场(等值线, 单位: hPa)(b)(红色矩形表示飞机观测区域), 观测区地形和飞行航迹(黑线表示航迹, 蓝色三角形表示探空站点, 沿P1和P2连线对卫星数据进行了插值)(c), 57131站08:00探空廓线(红线表示温度, 绿线表示露点温度)(d)Fig.2 500 hPa geopotential height (the contour, unit: dagpm), 700 hPa wind field (unit: m·s-1) (a)and sea level pressure (the contour, unit: hPa) at 08:00 on 8 December 2021 (b)(the red rectangle indicating the aircraft observation area), the topography of the observation area and flight track (black lines denote the track, blue triangles indicating the sounding stations, and the satellite data interpolated along the line P1 and P2)(c), the sounding at 57131 station at 08:00 on 8 December 2021(the red line indicating temperature and the green line indicating dew-point temperature) (d) |

图3 2021年12月8日10:50 Himawari-8卫星的可见光通道(0.47 μm)反照率(单位: %)(a)、 云顶温度(单位: ℃)(b)、 云光学厚度(c)、 云有效半径(单位: μm)(d)(红色矩形为飞行区域)、 反照率和云顶温度沿P1-P2沿线的剖面(e)及云光学厚度和云有效半径沿P1-P2沿线的剖面(GH为飞机航线)(f)Fig.3 Visible channel (0.47 μm) albedo(unit: %) (a), CTT (unit: ℃) (b), COT (c), CER (unit: μm) (d) (the red rectangles indicating the flight area), albedo with CTT profiles along P1-P2 (e), and COT with CER profiles along P1-P2 (GH is the flight path) of the Himawari-8 satellite cloud products at 10:50 on 8 December 2021 (f) |
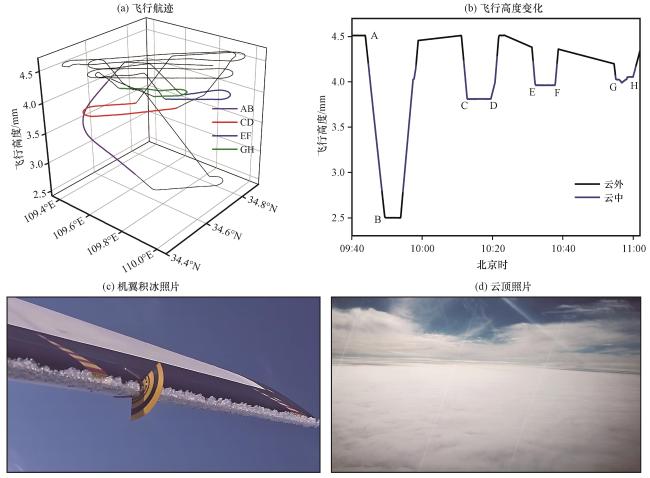
图4 研究飞机的飞行航迹(a)、 飞行高度随时间变化(b)、 积冰测量标尺和机翼积冰照片(c)及云顶观测照片(d)Fig.4 Research aircraft flight track(a), flight altitude variations with time(b), photographs of the ice measuring tape and airfoil ice accumulation(c) and photographs taken at the top of the observed clouds(d) |
表1 机载测量设备功能Table 1 Overview of the airborne instruments |
| 仪器名称 | 设备功能 | 测量范围 | 分辨率 |
|---|---|---|---|
| CDP | 测量云滴粒子 | 2~50 μm | 1~12档: 1 μm, 13~30档: 2 μm |
| CIP | 测量大云滴、 冰晶 | 25~1550 μm | 25 μm |
| Hotwire LWC | 测量液态水 | 0~3 g·m-3 | - |
| 标尺 | 测量积冰厚度 | 0~8.89 cm (3.5英寸) | - |
| 高清相机 | 拍摄影像 | - | - |
-表示无数据(- indicates on data) |
2.2 中值体积直径计算
2.3 液态水含量的计算
2.4 实况数据和再分析数据
3 天气背景和观测概况
3.1 天气形势
3.2 卫星观测特征
3.3 飞机观测概况
4 观测结果与分析
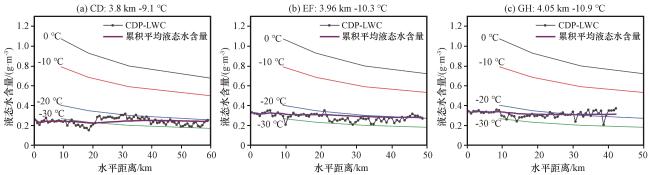
4.1 积冰云层的微物理特征
表2 不同高度层物理量均值统计Table 2 The statistics of physical quantities at different altitudes |
| 飞行航段 | CD | EF | GH |
|---|---|---|---|
| 时间 | 10:12:50 -10:19:36 | 10:32:11 -10:37:45 | 10:55:05 -10:59:58 |
| 高度/km | 3.8 | 3.96 | 4.05 |
| T/℃ | -9.1 | -10.3 | -10.9 |
| CDP-N/cm-3 | 433 | 388 | 338 |
| CIP-N/cm-3 | 0.08 | 0.12 | 0.14 |
| CDP-MVD/μm | 12.2 | 12.9 | 13.5 |
| CDP-LWC/(g·m-3) | 0.24 | 0.28 | 0.31 |
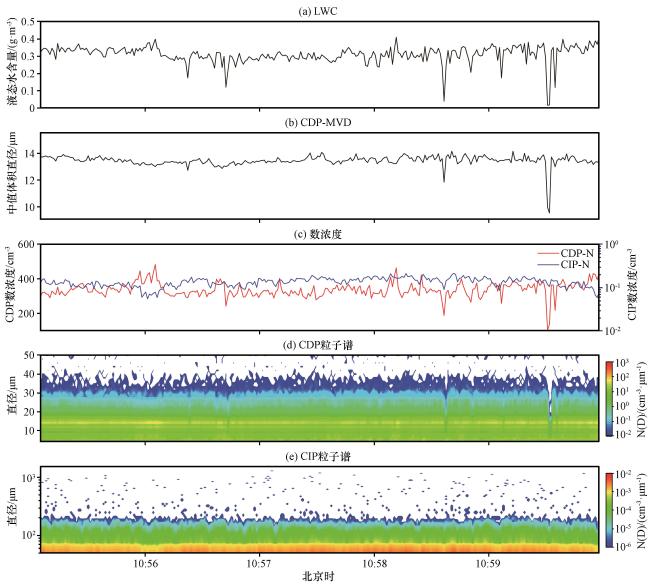
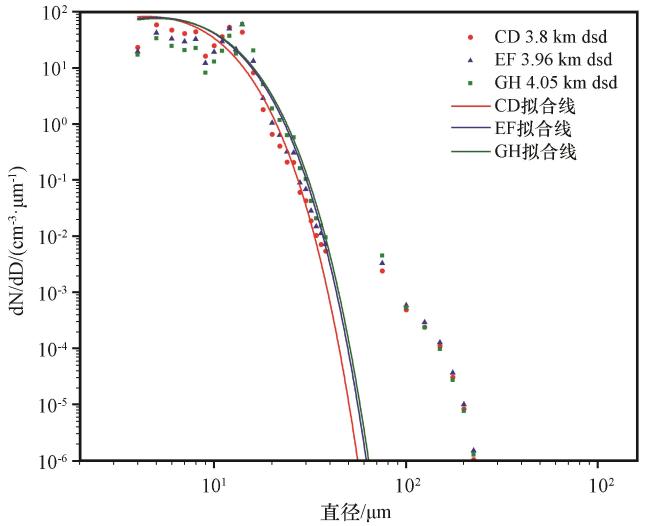
表3 CD、 EF和GH段粒子谱拟合结果Table 3 Fitting results of particle spectra in the CD, EF and GH legs |
| 高度/km | N 0 | Λ | R 2 |
|---|---|---|---|
| 3.8 | 31.357 | 0.453 | 0.99 |
| 3.96 | 24.318 | 0.407 | 0.99 |
| 4.05 | 22.068 | 0.395 | 0.99 |
4.2 积冰强度
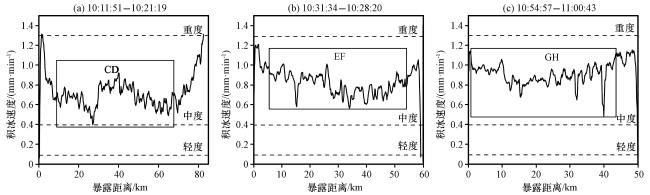
图8 10:11:51 -10:21:19 (a)、 10:31:34 -10:38:20 (b)和10:54:57 -11:00:43(c)期间的积冰速率(单位: mm·min-1) 虚线表示不同的积冰强度, 矩形框表示水平飞行航段Fig.8 Ice accumulation rates (unit: mm·min-1) during 10:11:51 -10:21:19(a), 10:31:34 -10:38:20(b) and 10:54:57 -11:00:43 (c).The dashed lines indicate different icing intensities, and the rectangular boxes denote level flight legs |