
1 引言
2 数据来源和方法介绍
2.1 无线电探空仪观测资料
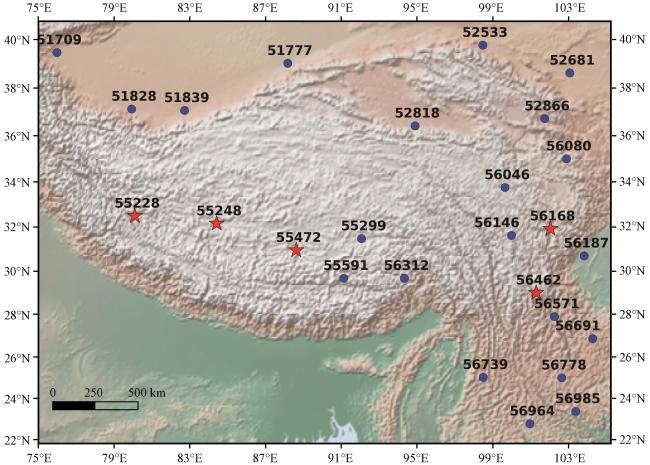
图1 青藏高原及周边地区探空站点分布红色五角星为第三次青藏高原试验探空站, 蓝色圆点为业务探空站 Fig.1 Radiosonde station over the Qinghai-Xizang Plateau.Red pentagram is the radiosonde station of the 3rd Qinghai-Xizang Plateau atmospheric scientific experiment, blue point is the operational radiosonde station |
表1 加密探空观测数据概况Table 1 Basic information for the intensive radiosonde observations |
| 站名 | 站号 | 时间范围 | 廓线数量/个 | |||
|---|---|---|---|---|---|---|
| 00:00 | 06:00 | 12:00 | 18:00 | |||
| 狮泉河 | 55228 | 7月6日至8月31日 | 38 | 40 | 52 | 0 |
| 改则 | 55248 | 7月8日至8月31日 | 40 | 36 | 36 | 0 |
| 申扎 | 55472 | 6月23日至8月31日 | 69 | 0 | 68 | 0 |
| 金川 | 56168 | 6月23日至7月31日 | 38 | 39 | 39 | 38 |
| 九龙 | 56462 | 6月23日至7月31日 | 38 | 38 | 39 | 38 |
2.2 大气再分析产品
2.3 分析方法
3 结果分析
3.1 非独立检验
3.2 独立检验
3.2.1 温度
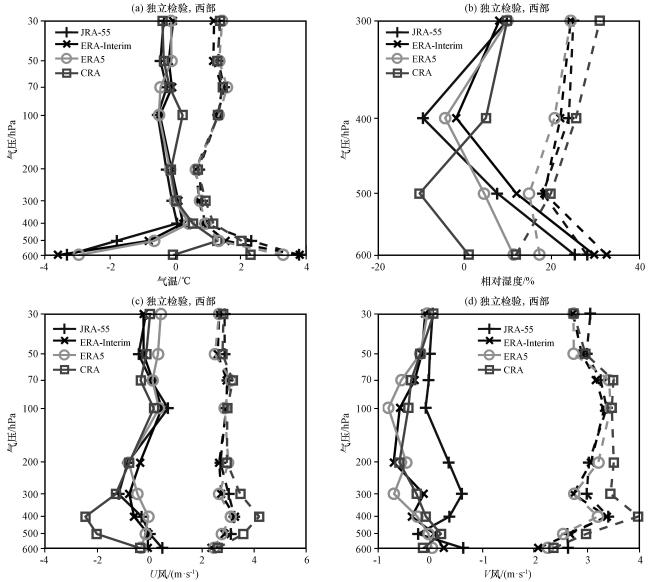
图3 四套再分析产品相对于高原西部加密探空观测的Bias(实线)和RMSE(虚线)(a)气温, (b)相对湿度, (c)U风, (d)V风 Fig.3 Comparison of Bias (solid line) and RMSE (dashed line) between four reanalysis products and intensive radiosonde observations over the Western Qinghai-Xizang Plateau.(a) temperature, (b) relative humidity, (c) U wind, (d) V wind |
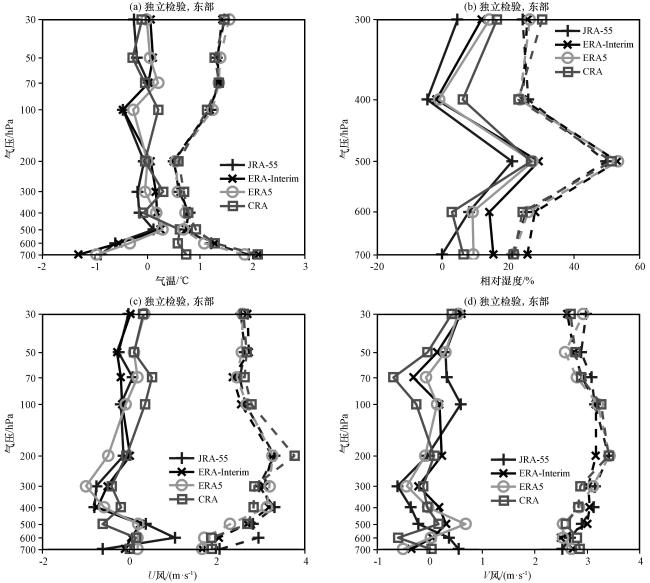
图4 四套再分析产品相对于高原东部加密探空观测的Bias(实线)和RMSE(虚线)(a)气温, (b)相对湿度, (c)U风, (d)V风 Fig.4 Comparison of Bias (solid line) and RMSE (dashed line) between four reanalysis products and intensive radiosonde observations over the Eastern Qinghai-Xizang Plateau.(a) temperature, (b) relative humidity, (c) U wind, (d) V wind |
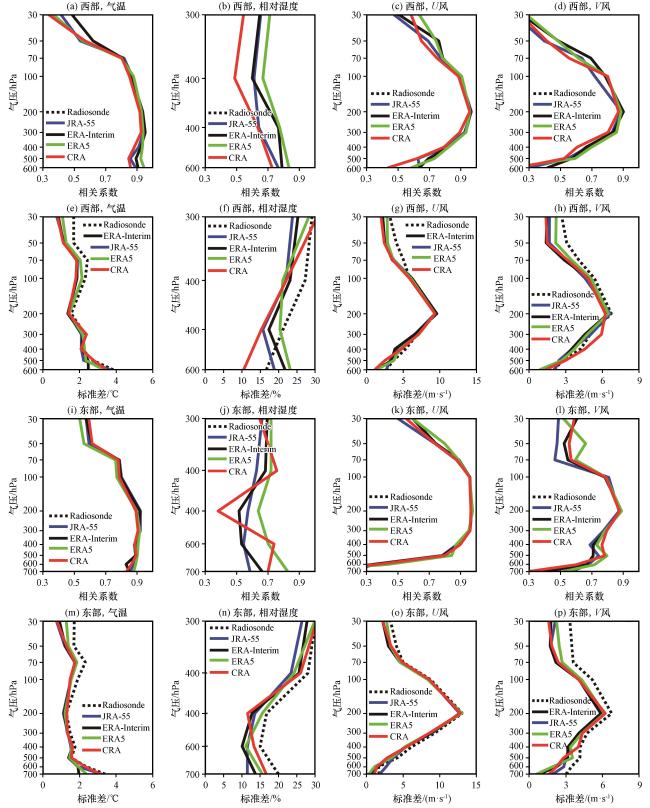
图5 四套再分析产品与加密探空观测的相关系数和标准差 图(a)~(h)为高原西部, 图(i)~(p)为高原东部。从左往右, 分别为气温、 相对湿度、 U风和V风的统计结果。从上往下, 第一行和第三行为再分析产品与探空的相关系数; 第二行和第四行为探空观测和再分析产品的标准差Fig.5 Correlation coefficients and standard deviations of reanalysis and intensive radiosonde observations.(a)~(h) represent the Western Plateau, (i)~(p) represent the Eastern Plateau.From left to right, the statistical results are for temperature, relative humidity, U-wind, and V-wind.From top to bottom, the first and third rows show the correlation coefficients; the second and fourth rows show the standard deviations of radiosonde observations and reanalysis products |
3.2.2 相对湿度
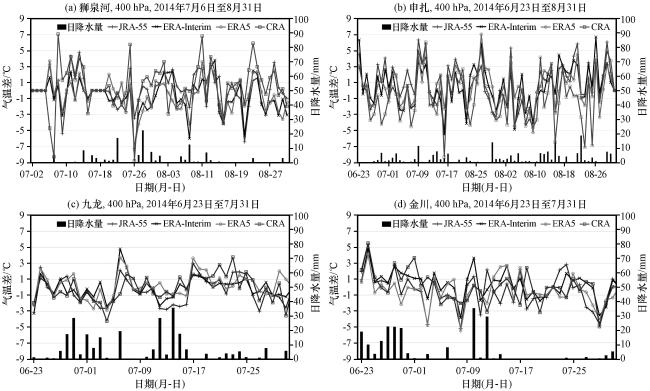
3.2.3 风
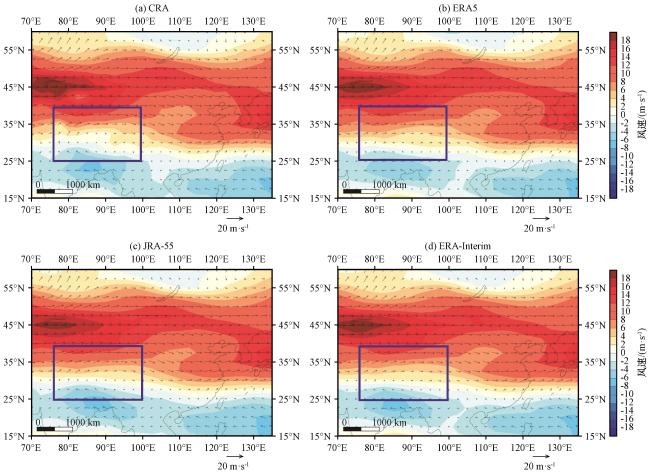
图7 2014年7月四套再分析产品的400 hPa风矢量和纬向风速(填色阴影, 单位: m·s-1)(a) CRA, (b) ERA5, (c) JRA-55, (d) ERA-Interim。蓝色框为CRA模拟的反气旋位置Fig.7 Wind vector and U wind (shading, unit: m·s-1) field at 400 hPa in July 2014.(a) CRA, (b) ERA5, (c) JRA-55, (d) ERA-Interim.The blue box shows the anticyclone position simulated by CRA |
3.3 均方根误差和偏差的日变化
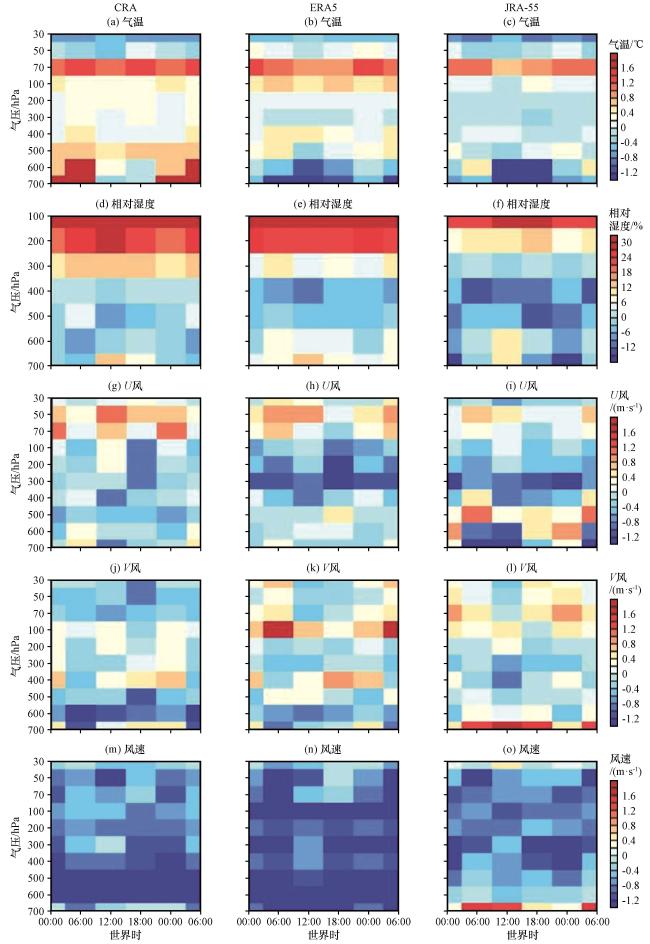
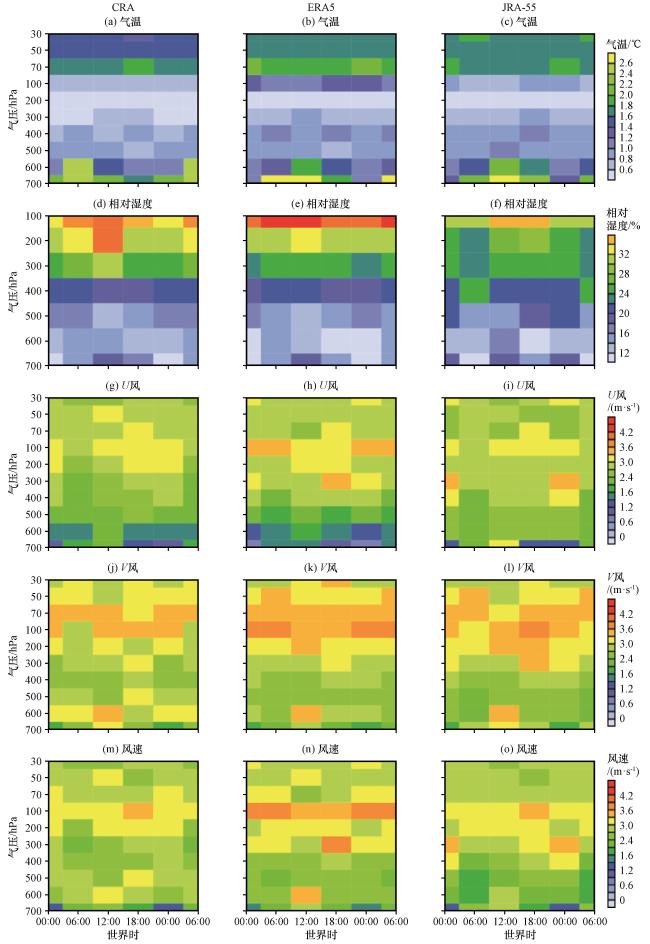
图8 三套再分析产品CRA (左), ERA5 (中)和JRA-55 (右)在青藏高原东部地区相对于探空观测Bias的日变化 (a)~(c)气温, (d)~(f)相对湿度, (g)~(i)U风, (j)~(l)V风, (m)~(o)风速Fig.8 The diurnal variations of the mean biases of CRA (left), ERA5 (medium), and JRA-55 (right) at different pressure levels validated against the soundings for the Eastern of Qinghai-Xizang Plateau.(a)~(c) air temperature, (d)~(f) relative humidity, (g)~(i) U wind, (j)~(l) V wind, (m)~(o) wind speed |
图9 三套再分析产品CRA (左), ERA5 (中)和JRA-55 (右)在青藏高原东部地区相对于探空观测RMSE的日变化 (a)~(c)气温, (d)~(f)相对湿度, (g)~(i)U风, (j)~(l)V风, (m)~(o)风速FIG.9 The diurnal variations of the mean biases of CRA (left), ERA5 (medium), and JRA-55 (right) at different pressure levels validated against the soundings for the Eastern of Qinghai-Xizang Plateau(a)~(c) air temperature, (d)~(f) relative humidity, (g)~(i) U wind, (j)~(l) V wind, (m)~(o) wind speed |