
1 引言
2 材料来源与方法介绍
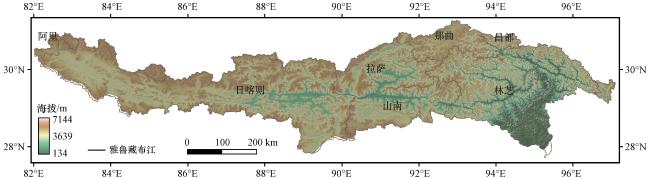
2.1 研究区概况
2.2 数据介绍及处理
2.3 分析方法
3 结果与分析
3.1 风光资源时空格局
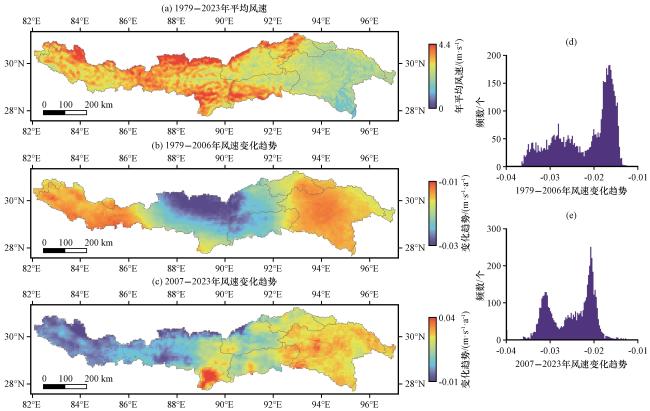
图2 雅鲁藏布江流域风速时空特征 (a) 1979 -2023年流域平均风速; (b~c) 不同阶段流域风速变化趋势; (d~e) 不同阶段流域风速变化趋势统计分布Fig.2 Spatiotemporal characteristics of wind speed in the Yarlung Zangbo River Basin (YZRB).(a) average wind speed of the YZRB during 1979 -2023; (b~c) the trend of wind speed of the YZRB at different periods; (d~e) statistical distribution of wind speed changes of the YZRB at different periods |
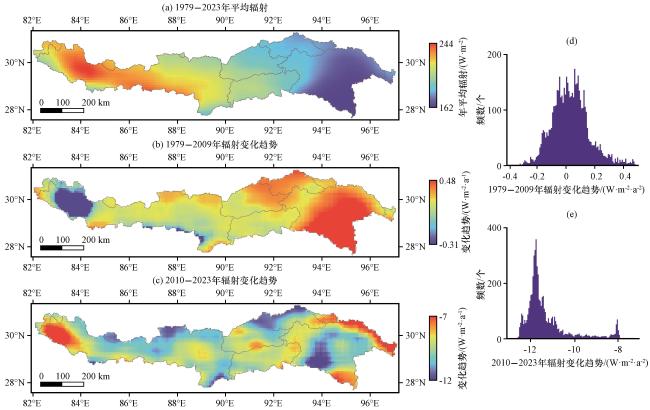
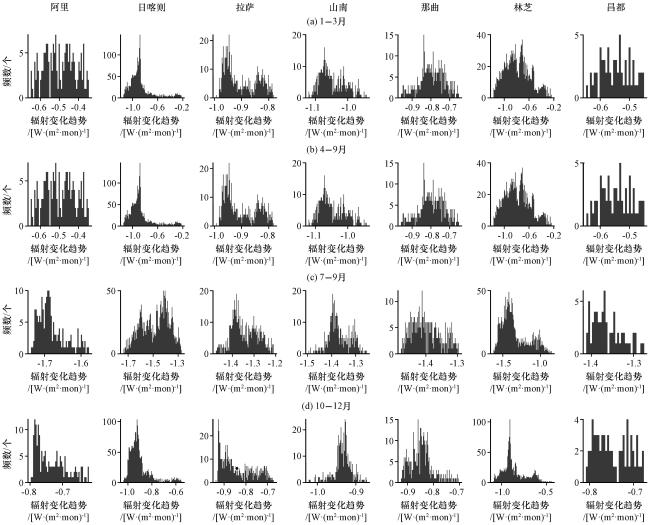
图3 雅鲁藏布江流域辐射时空特征 (a) 1979 -2023年流域平均辐射(单位: W·m-2); (b~c) 不同阶段流域辐射变化趋势[单位: W·(m2·a)-1]; (d~e) 不同阶段流域辐射变化趋势统计分布Fig.3 Spatiotemporal characteristics of radiation in the Yarlung Zangbo River Basin (YZRB).(a) Average radiation (unit: W·m-2)of the YZRB during 1979 -2023; (b~c) the trend of radiation [unit: W·(m2·a)-1] of the YZRB at different periods; (d~e) statistical distribution of radiation changes of the YZRB at different periods |
3.2 风光资源长期变化趋势及驱动因子
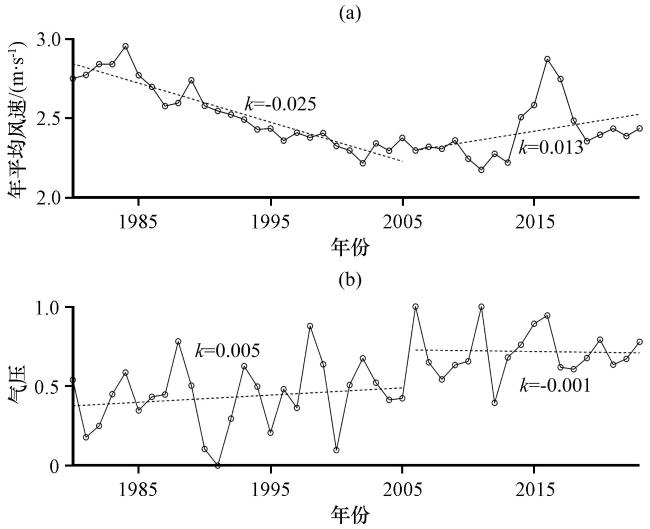
表1 流域内不同区域风速变化趋势Table 1 Changes of regional wind speed in the Yarlung Zangbo River Basin |
| 城市 | 季节变化/[m·(s·mon)-1] | |||
|---|---|---|---|---|
| 1 -3月 | 4 -6月 | 7 -9月 | 10 -12月 | |
| 阿里 | -0.017 | -0.015 | -0.017 | -0.007 |
| 日喀则 | -0.015 | -0.015 | -0.009 | -0.006 |
| 拉萨 | -0.01 | -0.015 | -0.013 | -0.002 |
| 山南 | -0.013 | -0.017 | -0.011 | -0.005 |
| 那曲 | -0.006 | -0.015 | -0.008 | -0.003 |
| 昌都 | -0.006 | -0.008 | -0.004 | -0.004 |
| 林芝 | -0.007 | -0.009 | -0.008 | -0.005 |
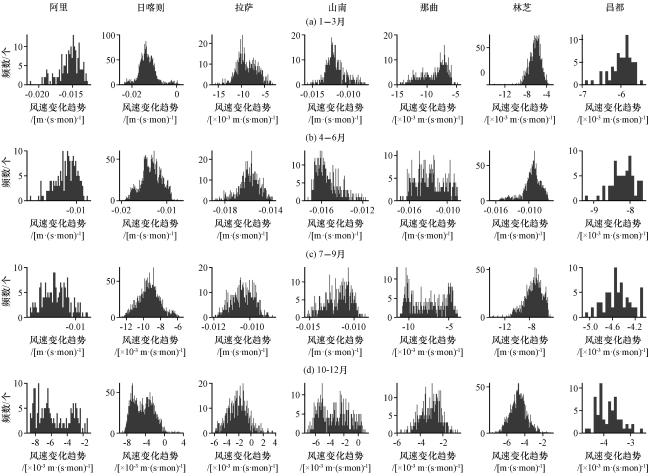
表2 流域内不同区域辐射变化趋势Table 2 Changes of regional radiation in the Yarlung Zangbo River Basin |
| 城市 | 季节变化/[W·(m2·mon)-1] | |||
|---|---|---|---|---|
| 1 -3月 | 4 -6月 | 7 -9月 | 10 -12月 | |
| 阿里 | -0.54 | -0.52 | -1.73 | -0.78 |
| 日喀则 | -0.93 | -0.82 | -1.68 | -0.95 |
| 拉萨 | -0.95 | -0.96 | -1.38 | -0.85 |
| 山南 | -1.17 | -1.17 | -1.38 | -0.93 |
| 那曲 | -0.85 | -0.86 | -1.46 | -0.85 |
| 昌都 | -0.55 | -0.54 | -1.38 | -0.77 |
| 林芝 | -0.77 | -0.78 | -1.38 | -0.77 |