
1 引言
2 资料来源和方法介绍
2.1 资料来源
2.2 方法介绍
3 新疆冬季降水时空分布特征
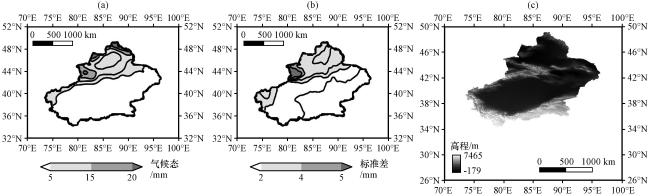
3.1 新疆冬季降水气候特征
3.2 新疆冬季区域平均降水异常特征
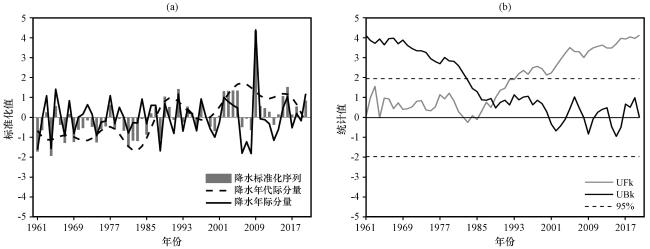
图2 1961 -2020年新疆区域平均冬季降水标准化序列, 其年际和年代际分量(a)及其M-K突变性检验(b)图(b)中两条虚线为置信水平95%显著性检验线 Fig.2 Regional mean winter precipitation standardized series for Xinjiang from 1961 to 2020, with interannual and interdecadal components (a) and their Mann-Kendall tests (b).In Fig.2(b), two dashed lines are 95% significance test lines at confidence level |
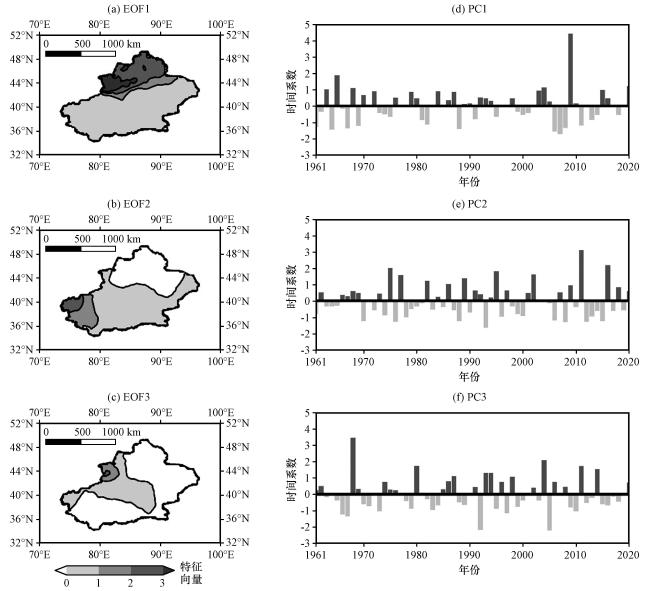
3.3 新疆冬季降水年际异常主要模态特征
4 中纬度海温年际异常对新疆冬季降水的影响
4.1 PC1与中纬度SSTA的时滞相关关系
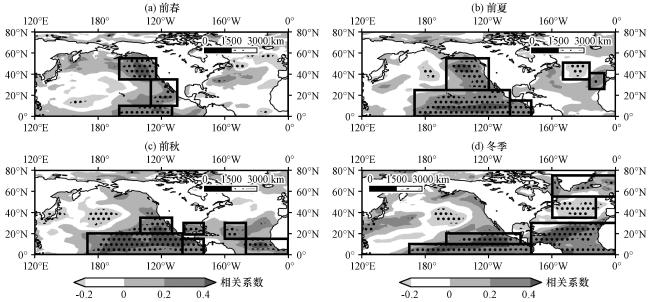
图4 前春(a)、 前夏(b)、 前秋(c)、 冬季(d)中纬度海温异常与新疆冬季降水年际异常PC1的时滞相关系数分布黑色打点区通过置信水平95%的显著性检验, 黑框区域为海温关键区 Fig.4 Distribution of time-lag correlation coefficients between mid-latitude SSTA and interannual precipitation anomalies PC1 in Xinjiang during pre-spring (a), pre-summer (b), pre-autumn (c), and winter (d), with the dotted area passing the significance test of 95% at the confidence level, and the black box area is the key area of SSTA |
表1 各季节 IPA 和 IATL 分别与PC1的Pearson相关系数和偏相关系数Table 1 Pearson correlation coefficients and partial correlation coefficients of IPA and IATL with PC1 for each season, respectively |
| 类别 | IPA | IATL | |||||
|---|---|---|---|---|---|---|---|
| 前春 | 前夏 | 前秋 | 冬季 | 前夏 | 前秋 | 冬季 | |
| Pearson相关系数 | 0.50** | 0.52** | 0.49** | 0.43** | 0.38** | 0.39** | 0.49** |
| 偏相关系数 | - | 0.46** | 0.42** | 0.21 | 0.28 | 0.28 | 0.34* |
*和**分别表示通过95%和99%置信水平显著性检验(* and ** indicates passing 95% and 99% confidence level significance tests, respectivey) |
4.2 关键区SST年际异常对冬季大气环流及水汽输送的影响
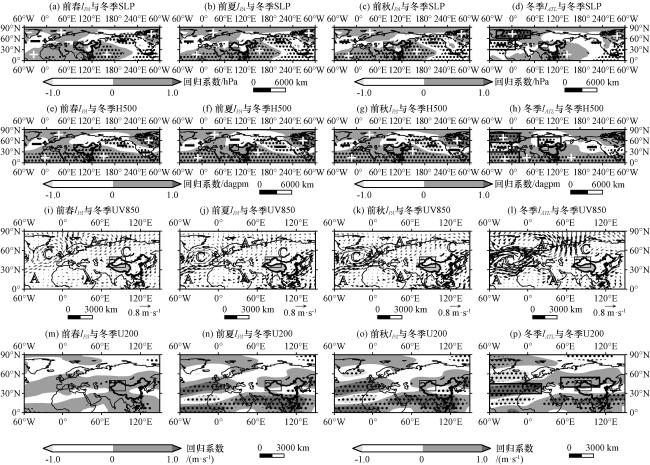
图5 前春、 前夏、 前秋IPA 及冬季IATL 分别与冬季SLP场(a~d, 单位: hPa)、 H500 (e~h, 单位: dagpm)、 UV850 (i~l, 矢量, 单位: m·s-1)、 U200 (m~p, 单位: m·s-1)的一元线性回归系数黑色打点区域及黑色粗矢量箭头通过置信水平95%的显著性检验, 黑色框为新疆地区, 黑色粗框为环流关键区, “A”“C”分别代表反气旋和气旋性环流异常中心, “+”“-”号分别代表各个要素场的正负异常中心 Fig.5 Univariate linear regression coefficients of pre-spring, pre-summer, pre-autumn IPA and winter IATL with winter SLP field (a~d, unit: hPa), H500 (e~h, unit: dagpm), UV850 (i~l, vectors, unit: m·s-1) and U200 (m~p, unit: m·s-1), respectively.The dotted area and black bold vector arrows pass the 95% significance test at the confidence level, the black box is Xinjiang region, the black bold box is the key area of the circulation, and “A” and “C” represent the centers of the anomalous anticyclonic and cyclonic circulation, respectively |
表2 冬季 IATL 和PC1分别与各环流指数的相关系数Table 2 Correlation coefficients of each circulation index with winter IATL and PC1 |
| -NAO指数 | +SCA指数 | TPI | SWJI | |
|---|---|---|---|---|
| IATL | 0.47** | 0.46** | 0.65** | 0.56** |
| PC1 | 0.48** | 0.50** | 0.55** | 0.68** |
**表示通过置信水平99%的显著性检验(** indicates passing the 99% confidence level significance test) |
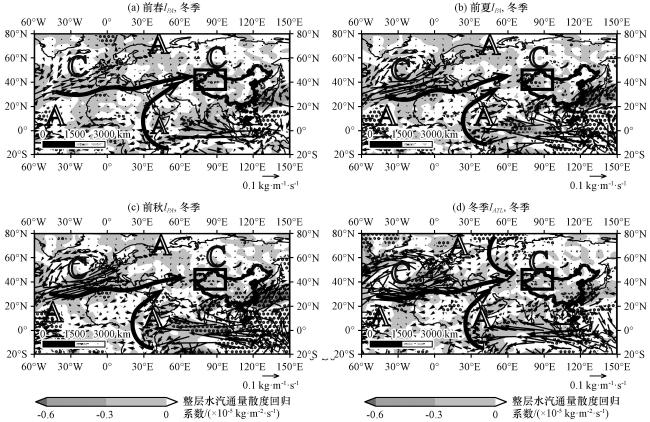
图6 前春(a)、 前夏(b)、 前秋(c) IPA 及冬季IATL (d)分别与冬季整层水汽通量(矢量, 单位: kg·m-1·s-1)及其散度(阴影, 单位: ×10-5 kg·m-2·s-1)的一元线性回归系数黑色打点区域通过置信水平95%的显著性检验, 黑色框为新疆地区, “A”“C”分别代表反气旋和气旋性水汽环流异常中心, 黑色粗矢量箭头代表水汽传播方向 Fig.6 Univariate linear regression coefficients of IPA (a~c) in pre-spring, pre-summer, pre-autumn, and IATL (d) in winter, respectively, with winter whole-layer water vapor fluxes (vectors, unit: kg·m-1·s-1) and their divergence (shading, unit: ×10-5kg·m-2·s-1), respectively, the dotted area passes the 95% significance test at confidence level, the black box is Xinjiang region, “A” and “C” represent the anomalous centers of anticyclonic and cyclonic water vapor circulation, respectively, and the thick black bold vector arrows represent the direction of water vapor propagation |
4.3 北太平洋和北大西洋SST协同影响新疆冬季降水的可能机制
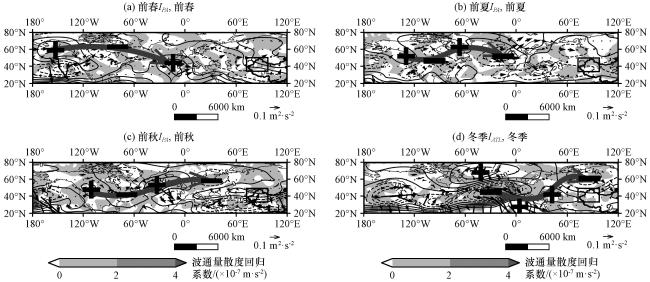
图7 前春(a)、 前夏(b)、 前秋(c) IPA 和冬季IATL (d)分别与对应季节250 hPa T-N波通量(矢量, 单位: m2·s-2)及其散度(阴影, 单位: ×10-7 m·s-2)、 流函数(等值线, 单位: ×105 m2·s-1)异常场的一元线性回归系数黑色框为新疆地区, “+” “-”号分别代表流函数的正负异常中心, 粗灰色矢量箭头表示波能量传播方向 Fig.7 Univariate linear regression coefficients of the pre-spring(a), pre-summer(b), pre-autumn(c) IPA and winter IATL (d) with the corresponding seasonal 250 hPa T-N wave fluxes (vectors, unit: m2·s-2) and their dispersion (shadows, unit: ×10-7 m·s-2), flow function (contours, unit: ×105 m2·s-1) anomaly fields, respectively, the black box shows the Xinjiang region, the “+” and “-” signs represent the positive and negative anomaly centers of the stream function, and the thick gray vector arrows indicate the direction of wave energy propagation |
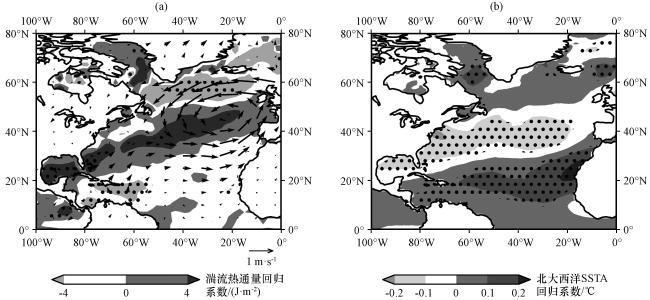
图8 冬季IATL 分别与海表面异常风场(矢量, 单位: m·s-1)和湍流热通量(阴影, 单位: J·m-2) (a), 冬季-NAO指数与北大西洋SSTA (b, 单位: ℃)的一元线性回归系数分布黑色打点区域通过置信水平95%的显著性检验 Fig.8 Distribution of univariate linear regression coefficients of winter IATL with sea surface anomalous wind field and turbulent heat flux (a, vector: wind field, unit: m·s-1; shading: heat flux, unit: J·m-2), and univariate linear regression coefficients of the winter-NAO index with the North Atlantic SSTA (b, unit: ℃), with the dotted area passing the significance test at the confidence level of 95% |