
1 引 言
2 资料来源与方法介绍
2.1 资料来源
2.2 短历时降水事件提取和分档
3 降水实况对比
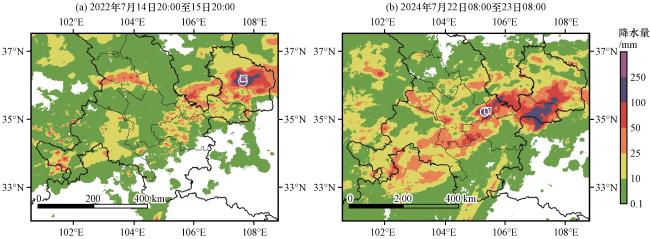
图1 累积降水量分布(单位: mm)(a)2022年7月14日20:00至15日20:00; (b)2024年7月22日08:00至23日08:00; 圆圈代表过程中累积降水最大站点(翟家河站和陇阳车岔站), 方框代表过程中1 h降水最大站点(马岭站和陇山站)Fig.1 Cumulative precipitation distribution.Unit: mm.(a) 20:00 on July 14, 2022 to 20:00 on July 15, 2022; (b) 08:00 on July 22, 2024 to 08:00 on July 23, 2024.The circle represents the stations with the highest accumulated precipitation during the process (Zhaijiahe Station and Longyang Checha Station), and the box represents the stations with the highest precipitation within 1 hour during the process (Maling Station and Longshan Station) |
4 极端性和短历时降水事件对比
4.1 极端性对比分析
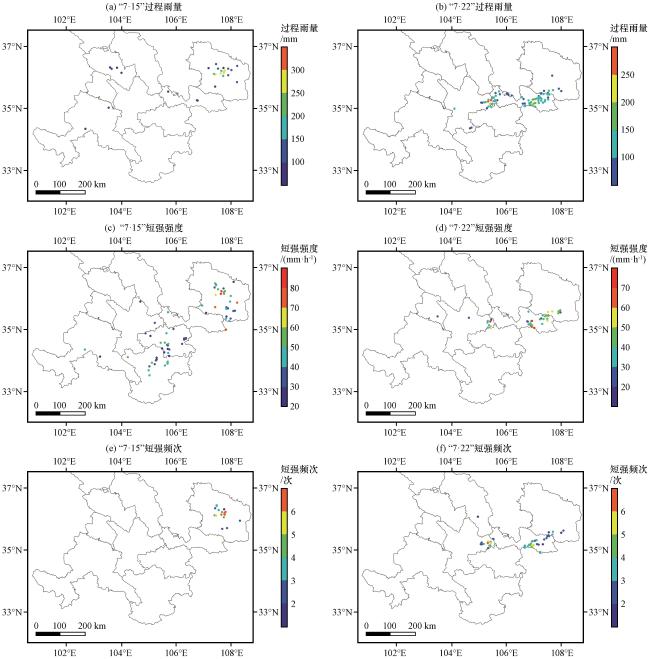
图4 超过建站以来历史极值的站点分布(a)“7·15”过程雨量(单位: mm), (b)“7·22”过程雨量(单位: mm), (c)“7·15”短强强度(单位: mm·h-1), (d)“7·22”短强强度(单位: mm·h-1), (e)“7·15”短强频次(单位: 次), (f)“7·22”短强频次(单位: 次)Fig.4 Distribution of stations exceeding historical extreme values since site establishment.(a) rainfall during the “July 15" process (unit: mm), (b) rainfall during the “July 22” process (unit: mm), (c) short Intensity during the “July 15” process (unit: mm·h-1), (d) short Intensity during the “July 22” process (unit: mm·h-1), (e) short intensity frequency during the “July 15” process (unit: time), (f) short intensity frequency during the “July 22” process (unit: time) |
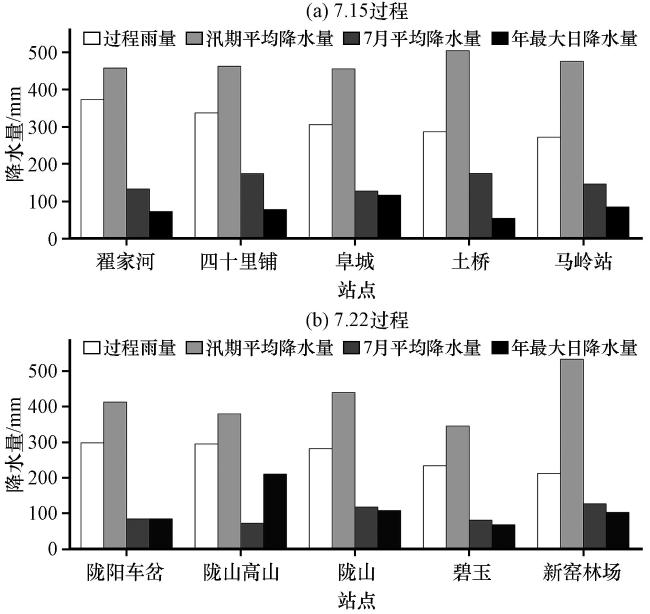
图5 “7·15”(a)和“7·22”(b)过程降水量排名前5站点的过程雨量与历年汛期平均降水量、 历年7月平均降水量、 历年最大日降水量Fig.5 Shows the process rainfall of the top 5 stations with precipitation ranking in “July 15” and “July 22”, along with the average precipitation during flood season, average precipitation in July, and maximum daily precipitation over the years |
4.2 短历时降水事件对比
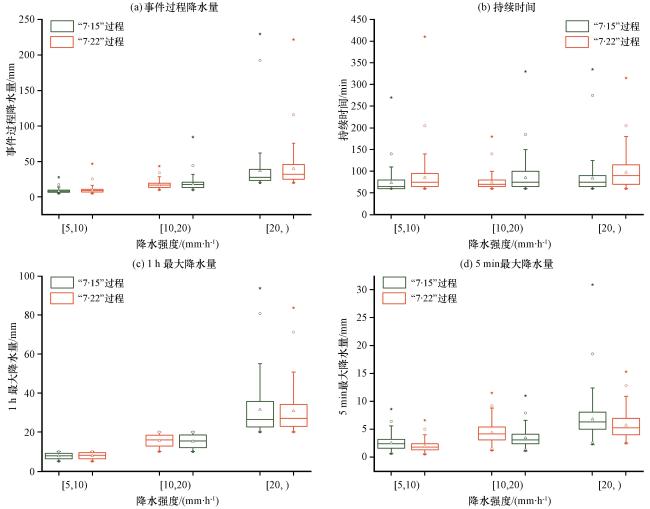
表1 两次特大暴雨过程不同强度等级短历时降水事件Table 1 Short duration precipitation events of different intensity levels in two extremely heavy rainstorm processes |
| 不同强度等级 | 过程 | [5, 10) | [10, 20) | [20,∞) | [50,∞) |
|---|---|---|---|---|---|
| 事件平均降水量/mm | “7·15” | 8.33 | 13.07 | 36.79 | 78.11 |
| “7·22” | 9.75 | 18.19 | 39.56 | 73.39 | |
| 事件最大降水量/mm | “7·15” | 27.7 | 43.2 | 229.5 | 222.8 |
| “7·22” | 46.7 | 83.4 | 221.6 | 177.4 | |
| 事件平均持续时间/min | “7·15” | 73.23 | 73.96 | 84.05 | 90.54 |
| “7·22” | 85.51 | 85.25 | 97.2 | 88.57 | |
| 事件最长持续时间/min | “7·15” | 270 | 205 | 335 | 235 |
| “7·22” | 410 | 330 | 315 | 175 | |
| 站点数量占比/% | “7·15” | 44.55% | 44.55% | 10.68% | 1.10% |
| “7·22” | 60.70% | 30.63% | 8.68% | 0.74% |
5 环流特征及环境条件对比
5.1 环流特征
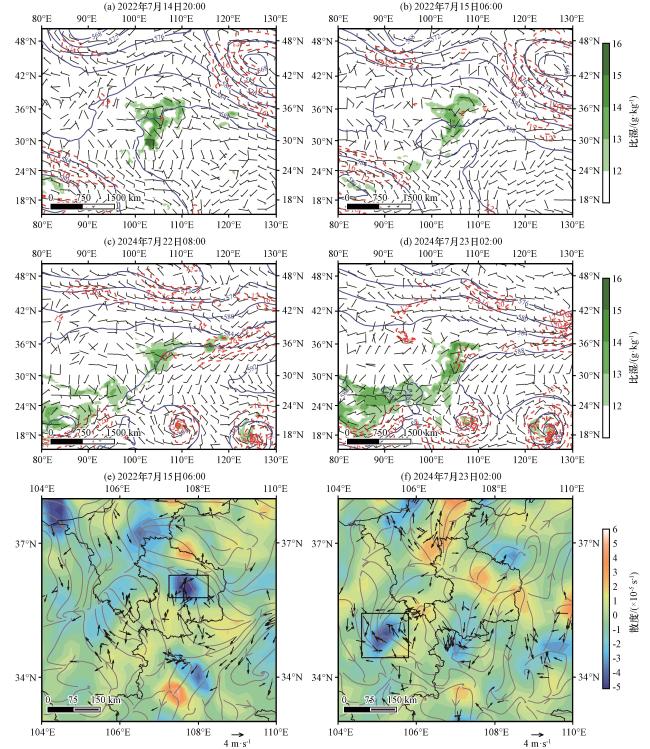
图7 两次特大暴雨过程500 hPa位势高度(蓝色等值线, 单位: dagpm)、 700 hPa风场(风羽, 单位: m·s-1)、 风速(红色虚线,单位: m·s-1)、 比湿(彩色阴影, 单位: g·kg-1)(a~d)及地面流场(流线)和散度(彩色阴影, 单位: ×10-5 s-1), 黑色箭头为地面风场(单位: m·s-1), 方框分别为两次特大暴雨中心(e~f)(a)2022年7月14日20:00, (b)2022年7月15日06:00, (c)2024年7月22日08:00, (d)2024年7月23日02:00,(e)2022年7月15日06:00, (f)2024年7月23日02:00Fig.7 500 hPa geopotential height (blue contour, unit: dagpm), 700 hPa wind field ( wind barbs, unit: m·s-1)、 wind speed (red dashed line, unit: m·s-1)、 specific humidity (colored shading, unit: g·kg-1) (a~d) and ground flow field (streamlines)and divergence (colored shading, unit: ×10-5 s-1) Black arrows illustrate surface wind vectors (unit: m·s-1).Two separates are extreme torrential rainfall episodes (e~f).(a) 20:00 on July 14, 2022, (b) 06:00 on July 15, 2022, (c) 08:00 on July 22, 2024, (d) 02:00 on July 23, 2024, (e) 06:00 on July 15, 2022, (f) 02:00 on July 23, 2024 |
5.2 水汽输送及辐合
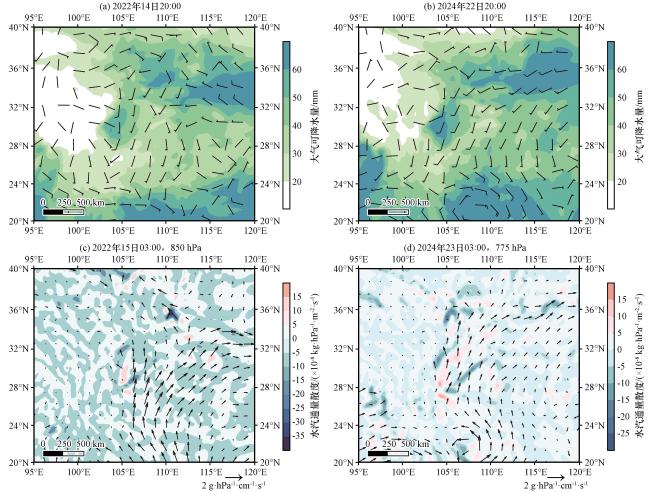
图8 两次特大暴雨过程大气可降水量(填色, 单位: mm)与700 hPa风场(单位: m·s-1)(a~b)及水汽通量(矢量, 单位: g·hPa-1·cm-1·s-1)与水汽通量散度(填色, 单位: ×10-8 kg·hPa-1·m-2·s-1)(c~d)(a)2022年14日20:00, (b)2024年22日20:00, (c)2022年15日03:00 850 hPa, (d)2024年23日03:00 775 hPaFig.8 Two extreme heavy rainfall events: precipitable water (shading, unit: mm) and 700 hPa wind (unit: m·s-1)(a~b), as water vapor flux (vector, unit: g·hPa-1·cm-1·s-1) and water vapor flux divergence (shaded, unit: ×10-8 kg·hPa-1·m-2·s-1) (c~d).(a) 20:00 on, 2022, (b) 20:00 on 22, 2024, (c) 03:00 on 15, 2022 at 850 hPa, (d) 03:00 on 23, 2024 at 775 hPa |
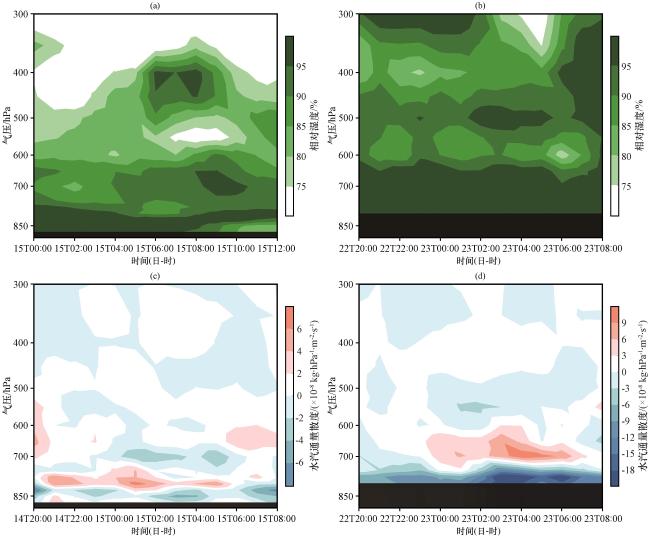
图9 两次特大暴雨过程翟家河站(左列, 2022年14日20:00至15日12:00)和陇阳车岔站(右列, 2024年22日20:00至23日08:00)时间-高度剖面(a, b)相对湿度(单位: %); (c, d)水汽通量散度(单位: ×10-8 kg·hPa-1·m-2·s-1), 黑阴影区为站点海拔Fig.9 Time-height cross-sections at Zhaijiahe station (left column: 20:00 on 14 July to 12: 00 on 15 July 2022) and Longyang checha Station (right column: 20:00 on 22 July to 08:00 on 23 July 2024) during the two extreme heavy rainfall events.(a, b) relative humidity (unit: %); (c, d) moisture flux divergence (unit: ×10-8 kg·hPa-1·m-2·s-1).Black shaded areas indicate station elevation |
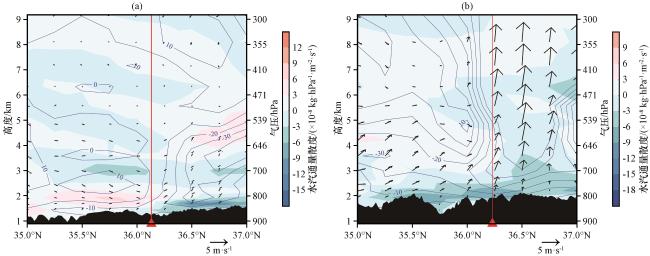
图10 “7·15”过程15日04:00经过翟家河站(红色三角和直线)(a)和“7·22”过程23日03:00经过陇阳车岔站(红色三角和直线)(b)水汽通量散度(彩色区, 单位: ×10-8 kg·hPa-1·m-2·s-1)、 风矢量(箭头, 单位: m·s-1)及垂直上升速度(等值线, 单位: ×10-2 Pa·s-1)的经向-高度分布黑阴影区为地形 Fig.10 Meridional-height distributions of moisture flux divergence (color area, unit: ×10-8 kg·hPa-1·m-2·s-1), wind vectors (arrows, unit:m·s-1), and vertical velocity (contour line, unit: ×10-2 Pa·s-1) at Zhaijiahe station (red triangle and line) at 04:00 on 15 July during the '7·15' event (a), and Longyang Checha Station (red triangle and line) at 03:00 on 23 July during the '7·22' event (b).Black shaded areas indicate terrain height |
5.3 热力条件对比
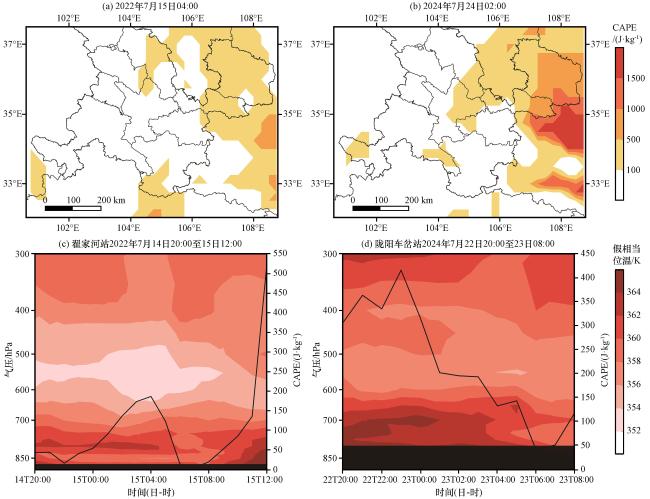
图11 两次特大暴雨过程西北地区东部CAPE(a, b, 单位: J·kg-1)分布及单站假相当位温(阴影, 单位: K)和CAPE(折线, 单位: J·kg-1)(c, d)随时间变化(a)2022年7月15日04:00, (b)2024年7月23日02:00, (c)翟家河站2022年7月14日20:00至15日12:00, (d)陇阳车岔站2024年7月22日20:00至23日08:00。(c)和(d)中黑色阴影为站点海拔Fig.11 Distribution of CAPE (a, b, unit: J·kg-1) over the eastern part of Northwest China during two extreme heavy rainfall events, along with the time series of pseudo-equivalent potential temperature (shaded, unit: K) and CAPE (line, unit: J·kg-1) at individual stations (c, d).(a) 04:00 on 15 July 2022, (b) 02:00 on 23 July 2024, (c) Zhaijiahe station from 20:00 on 14 July to 12:00 on 15 July 2022, (d) Longyang Checha station from 20:00 on 22 July to 08:00 on 23 July 2024.Black shading indicates station elevation in (c) and (d) |
5.4 动力条件
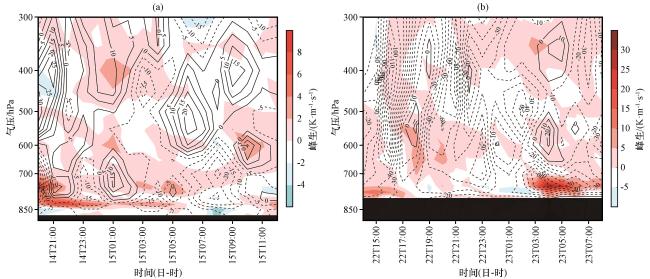
图12 “7·15”过程翟家河站14日20:00至15日12:00(a)及“7·22”过程陇阳车岔站22日14:00至23日08:00(b)锋生(填色, 单位: K·m-1·s-1)和垂直速度(黑色等值线, 单位: ×10-2 Pa·s-1)的时间-高度剖面黑色阴影为海拔 Fig.12 Time-height cross sections of the ‘7·15’ event at Zhaijiahe station from 20:00 on 14 to 12:00 on 15 (a) and the ‘7·22’ event at Longyang Checha station from 14:00 on 22 to 08:00 on 23 (b), frontogenesis (shading, unit: K·m-1·s-1) and vertical velocity (black contours, unit: ×10-2 Pa·s-1).Black shading indicates station elevation |