
1 引言
2 数据集构建
2.1 数据来源
表1 XPOL与SAD主要性能参数Table 1 Main performance parameters of the XPOL and SAD |
| 工作参数 | XPOL | SAD |
|---|---|---|
| 雷达体制 | 速调管 | 速调管 |
| 工作频率/GHz | 9.3~9.5 | 2.7~3.0 |
| 峰值/kW | 70 | 750 |
| 极化方向 | 线性水平、 线性垂直 | 线性水平、 线性垂直 |
| 天线直径/m | 2.4 | 8.6 |
| 波束宽度/(˚) | ≤1.0 | ≤1.0 |
| 探测距离/km | 150 | 460 |
| 距离分辨率/m | 75 | 250 |
| 扫描模式及用时 | VCP21/3min | VCP21/6min |
2.2 数据预处理
2.3 构建训练数据集
表2 各参数标准化的最大、 最小值设置Table2 Configuration of maximum and minimum values for parameter normalization |
| 参数 | ||
|---|---|---|
|
| -20 dBZ -2 dB -1˚ km-1 | 70 dBZ 6 dB 6˚ km-1 |
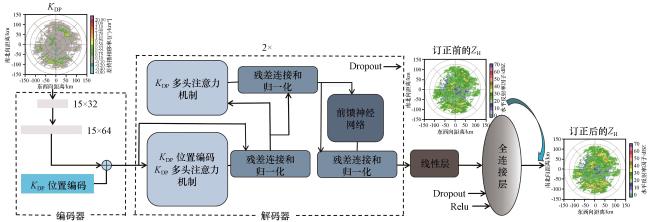
3 XCORnet网络架构设计
3.1 Transformer架构
3.2 XCORnet网络架构
4 模型训练
4.1 超参设置及模型训练
4.2 评价指标
4.3 模型测试
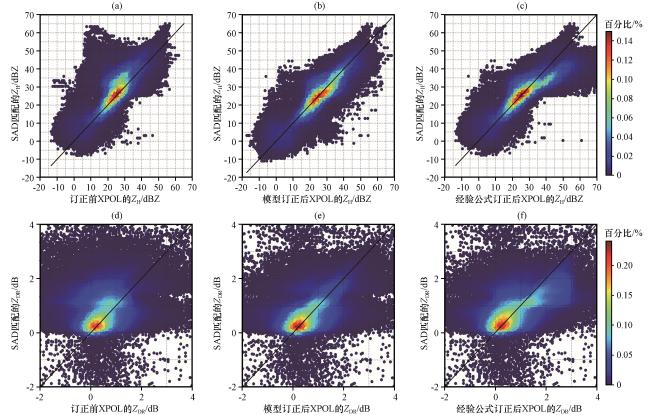
图2 XPOL衰减订正前后散点分布 (a、 d)订正前的Z H、 Z DR; (b、 e)基于XCORnet模型订正后的Z H、 Z DR; (c、 f)基于经验公式订正后的Z H、 Z DRFig.2 Scatter plots of XPOL attenuation correction before and after correction.(a, d) Z H and Z DR before correction, (b, e) Z H and Z DR after correction based on XCORnet model, (c, f) Z H and Z DR after correction based on empirical formula |
表3 Z H 和 Z DR 订正前后评价结果Table 3 Evaluation metrics results before and after correction of Z H and Z DR |
| 指标 | 订正前 Z H | XCORnet 订正后Z H | 经验公式 订正后Z H | 订正前 Z DR | XCORnet 订正后Z DR | 经验公式 订正后Z DR |
|---|---|---|---|---|---|---|
| BIAS | 0.875 | 0.972 | 0.901 | 0.862 | 1.141 | 1.273 |
| RMSE/dB | 8.693 | 5.811 | 6.820 | 1.679 | 0.972 | 1.382 |
| MAE/dB | 6.292 | 4.222 | 5.113 | 1.271 | 0.697 | 1.008 |
5 模型应用
5.1 2023年7月30日个例
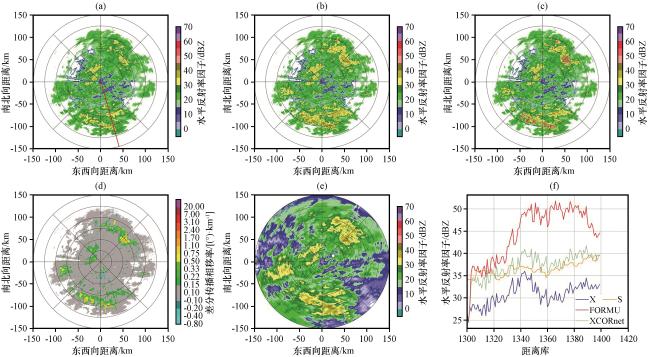
图3 2023年7月30日00:00雷达2.4°仰角Z H、 K DP PPI图及168°径向Z H变化曲线 (a)XPOL订正前的Z H; (b) 基于XCORnet模型订正后的Z H; (c) 基于经验公式订正的Z H; (d) K DP; (e) SAD雷达匹配的Z H; (f) 图(a)红色直线所处径向订正前后的Z H变化曲线Fig.3 2.4° elevation Z H and K DP PPI plots, and the Z H variation curve along the 168° radial at 00:00 on July 30, 2023.(a) Z H before XPOL correction, (b) Z H corrected by the XCORnet model, (c) Z H corrected by the empirical formula, (d) K DP, (e) Z H matched by the SAD radar, (f) Z H variation curves along the radial marked by the red line in figure (a) before and after correction |
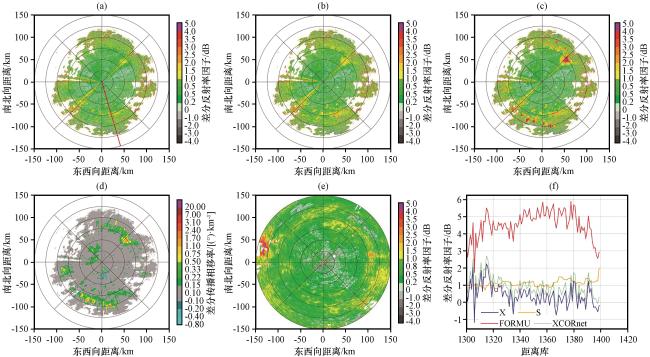
图4 2023年7月30日00:00雷达2.4°仰角Z DR、 K DP PPI图及168°径向Z DR变化曲线 (a)XPOL订正前的Z DR; (b) 基于XCORnet模型订正后的Z DR; (c) 基于经验公式订正的Z DR; (d) K DP; (e) SAD雷达匹配的Z DR; (f) 图(a)红色直线所处径向订正前后的Z DR变化曲线Fig.4 2.4° elevation Z DR and K DP PPI plots, and the Z DR variation curve along the 168° radial at 00:00 on July 30, 2023.(a) Z DR before XPOL correction, (b) Z DR corrected by the XCORnet model, (c) Z DR corrected by the empirical formula, (d) K DP, (e) Z DR matched by the SAD radar, (f) Z DR variation curves along the radial marked by the red line in figure (a) before and after correction |
5.2 2024年6月13日个例
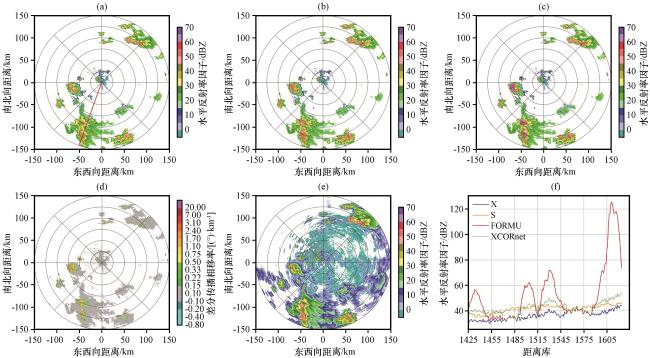
图5 2024年6月13日10:00雷达1.5°仰角Z H、 K DP PPI图及203°径向Z H变化曲线 (a)XPOL订正前的Z H; (b) 基于XCORnet模型订正后的Z H; (c) 基于经验公式订正的Z H; (d) K DP; (e) SAD雷达匹配的Z H; (f) 图(a)红色直线所处径向订正前后的Z H变化曲线Fig.5 1.5° elevation Z H and K DP PPI plots, and the Z H variation curve along the 203° radial at 10:00 on June 13, 2024.(a) Z H before XPOL correction, (b) Z H corrected by the XCORnet model, (c) Z H corrected by the empirical formula, (d) K DP, (e) Z H matched by the SAD radar, (f) Z H variation curves along the radial marked by the red line in figure (a) before and after correction |
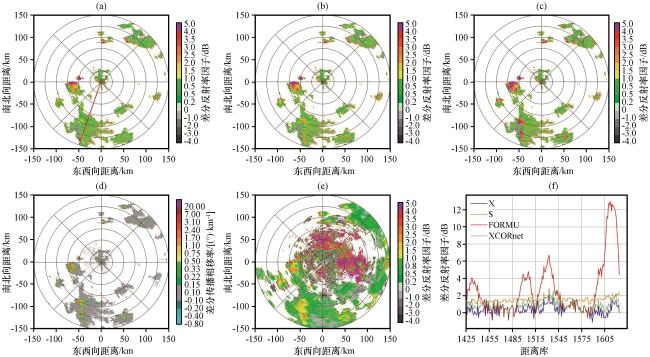
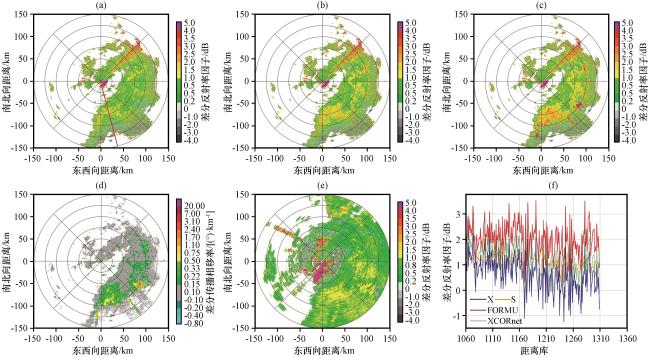
图6 2024年6月13日10:00雷达1.5°仰角Z DR、 K DP PPI图及203°径向Z DR变化曲线 (a)XPOL订正前的Z DR; (b) 基于XCORnet模型订正后的Z DR; (c) 基于经验公式订正的Z DR; (d) K DP; (e) SAD雷达匹配的Z DR; (f) 图(a)红色直线所处径向订正前后的Z DR变化曲线Fig.6 1.5° elevation Z DR and K DP PPI plots, and the Z DR variation curve along the 203° radial at 10:00 on June 13, 2024.(a) Z DR before XPOL correction, (b) Z DR corrected by the XCORnet model, (c) Z DR corrected by the empirical formula, (d) K DP, (e) Z DR matched by the SAD radar, (f) Z DR variation curves along the radial marked by the red line in figure (a) before and after correction |
5.3 2023年7月21日个例
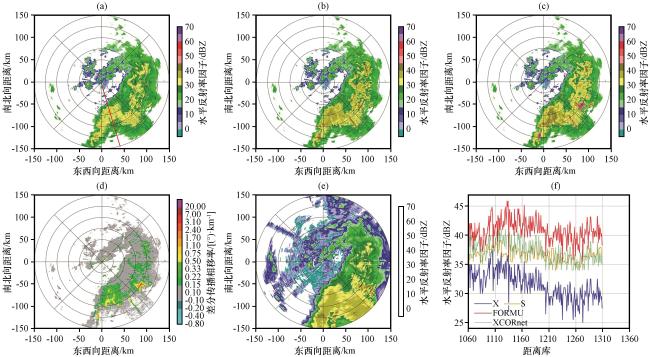
图7 2023年7月21日00:06雷达1.5°仰角Z H、 K DP PPI图及164°径向Z H变化曲线 (a)XPOL订正前的Z H; (b) 基于XCORnet模型订正后的Z H; (c) 基于经验公式订正的Z H; (d) K DP; (e) SAD雷达匹配的Z H; (f) 图(a)红色直线所处径向订正前后的Z H变化曲线Fig.7 1.5° elevation Z H and K DP PPI plots, and the Z H variation curve along the 164° radial at 00:06 on July 21, 2023.(a) Z H before XPOL correction, (b) Z H corrected by the XCORnet model, (c) Z H corrected by the empirical formula, (d) K DP, (e) Z H matched by the SAD radar, (f) Z H variation curves along the radial marked by the red line in figure (a) before and after correction |
图8 2023年7月21日00:06雷达1.5°仰角Z DR、 K DP PPI图及164°径向Z DR变化曲线 (a)XPOL订正前的Z DR; (b) 基于XCORnet模型订正后的Z DR; (c) 基于经验公式订正的Z DR; (d) K DP; (e) SAD雷达匹配的Z DR; (f) 图(a)红色直线所处径向订正前后的Z DR变化曲线Fig.8 1.5° elevation Z DR and K DP PPI plots, and the Z DR variation curve along the 164° radial at 00:06 on July 21, 2023.(a) Z DR before XPOL correction, (b) Z DR corrected by the XCORnet model, (c) Z DR corrected by the empirical formula, (d) K DP, (e) Z DR matched by the SAD radar, (f) Z DR variation curves along the radial marked by the red line in figure (a) before and after correction |