
1 引言
2 研究区域与数据来源
2.1 研究区域
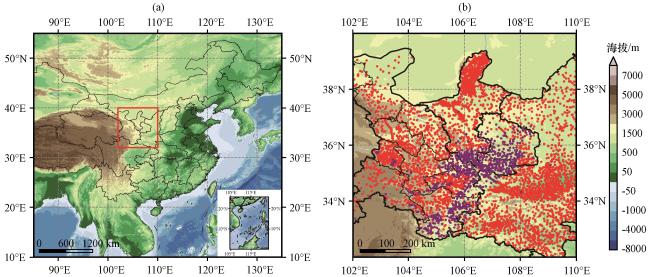
图1 中国行政区划(a, 红框区域为研究区域), 研究区域内地面自动观测站点分布(b, 紫色站点为降水核心区)填色为海拔(单位: m) Fig.1 Administrative zoning map of China (a, red areas are research areas), and distribution of automatic weather stations in the study area (b, purple stations are the precipitation core area).The shading is altitude (unit: m) |
2.2 数据来源
2.3 方法介绍
2.3.1 数据预处理
2.3.2 评估指标
3 结果
3.1 空间分布特征
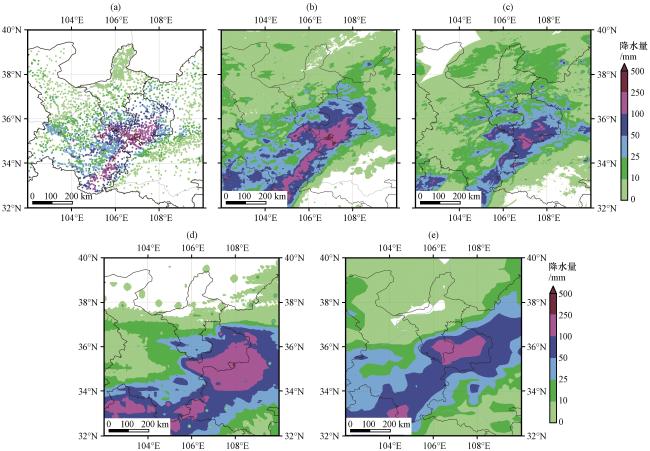
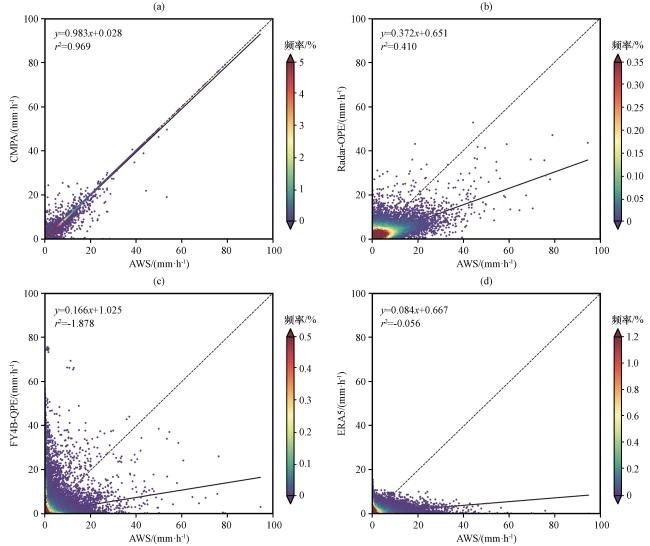
图3 研究区暴雨期间小时降水量的散点图及其线性拟合、 核密度估计(a) CMPA, (b) Radar-QPE, (c) FY4B-QPE, (d) ERA5.红线为线性拟合; 填色为核密度估计(单位: %)Fig.3 Scatter plots of hourly rainfall during heavy rain in the study area and their linear fitting, as well as kernel density estimation.(a) CMPA, (b) Radar-QPE, (c) FY4B-QPE, (d) ERA5.Red line is linear fitting, coloring is kernel density estimation (unit: %) |
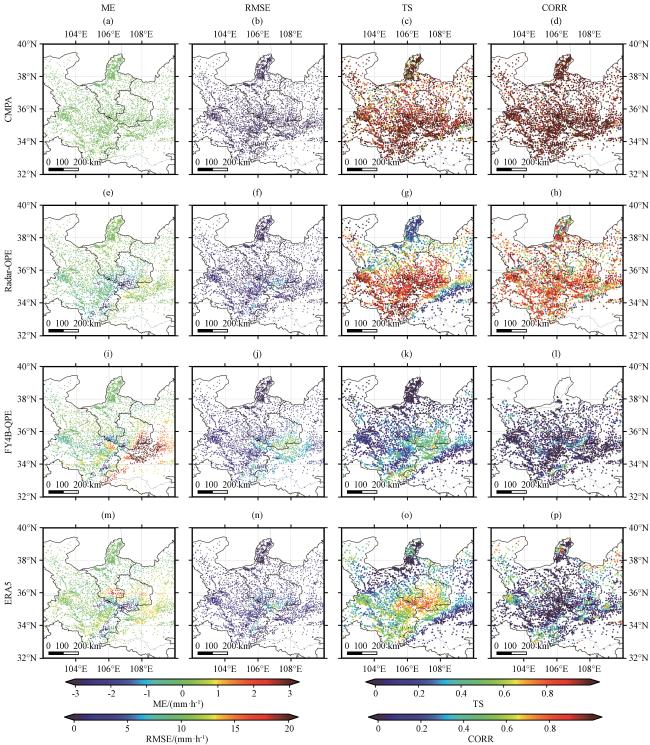
图4 暴雨期间各类降水产品小时降水量的ME(单位: mm·h-1)、 RMSE(单位: mm·h-1)、 TS及CORR分布(a)~(d)为CMPA, (e)~(h)为Radar-QPE, (i)~(l)为FY4B-QPE, (m)~(p)为ERA5Fig.4 ME (unit: mm·h-1), RMSE (unit: mm·h-1), TS and CORR distribution of hourly various precipitation products during heavy rainfall.(a)~(d) CMPA, (e)~(h) Radar-QPE, (i)~(l) FY4B-QPE, (m)~(p) ERA5 |
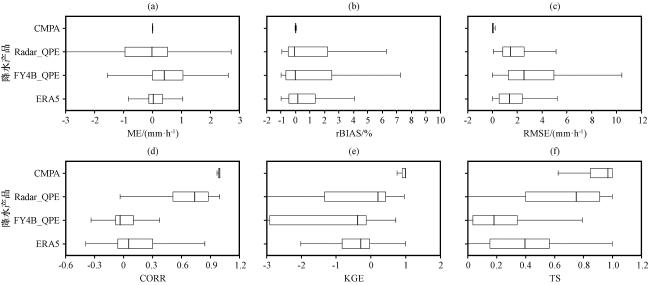
图5 暴雨期间各类降水产品评估指标箱线图箱线图中黑线为中位数, 左右边界线为第25和75分位数 Fig.5 Box plot of evaluation indicators of various precipitation products during rainstorm.The black line in the box plot is the median, and the left and right boundary lines are the 25th and 75th quantiles |
表1 各降水产品评估指标平均值Table 1 Average value of each precipitation product evaluation index |
| 降水产品 | ME/(mm·h-1) | rBIAS/% | RMSE/(mm·h-1) | CORR | KGE | β | RV | TS |
|---|---|---|---|---|---|---|---|---|
| CMPA | 0.002 | 0.73 | 0.033 | 0.996 | 0.965 | 1.007 | 0.992 | 0.939 |
| Radar_QPE | -0.151 | 54.92 | 1.610 | 0.712 | -0.232 | 1.550 | 0.778 | 0.688 |
| FY4B_QPE | 0.192 | 60.55 | 2.749 | -0.002 | -1.141 | 2.187 | 1.061 | 0.187 |
| ERA5 | 0.080 | 35.13 | 1.439 | 0.101 | -0.382 | 1.427 | 0.558 | 0.372 |
3.2 时间变化特征
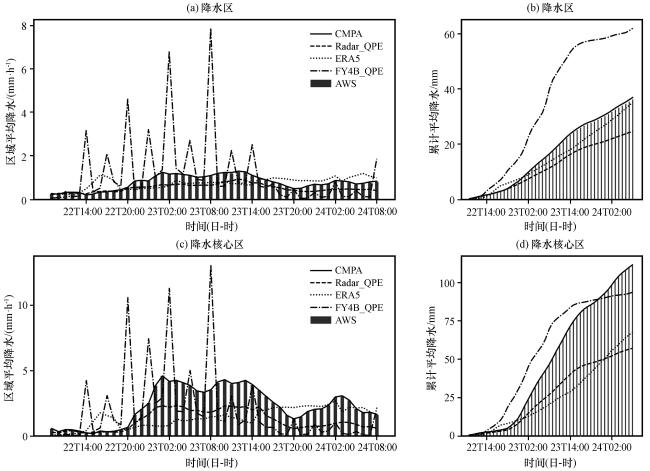
图6 暴雨期间各降水产品和AWS的区域平均降水(a, c)及累积平均降水(b, d)的时间演变(a)、 (b)降水区, (c)、 (d)降水核心区Fig.6 Temporal evolution of regional mean precipitation (a, c) and cumulative mean precipitation (b, d) of each precipitation product and AWS during heavy rainfall.(a, b) rainfall area, (c, d) the precipitation core region |
表2 各降水产品在核心降水区小时平均CORR和RMSETable 2 Hourly average CORR and RMSE of each precipitation product in the core precipitation area |
| CMPA | Radar-QPE | FY4B-QPE | ERA5 | |
|---|---|---|---|---|
| CORR | 0.999 | 0.960 | 0.242 | 0.221 |
| RMSE/(mm·h-1) | 0.038 | 1.329 | 2.928 | 1.685 |
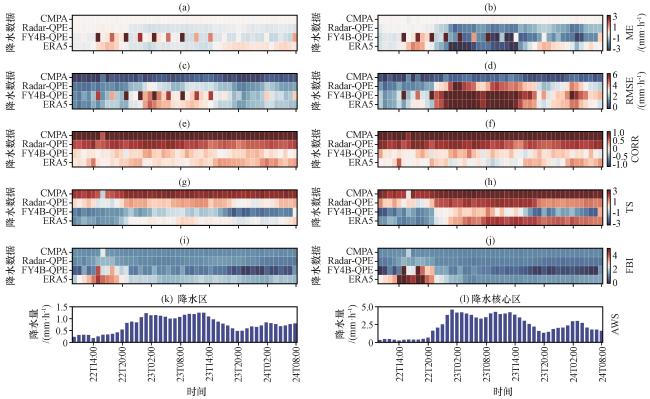
图7 暴雨期间各降水产品评估指标热力图和AWS的区域平均小时降水量的时间演变图(a、 c、 e、 g、 i)为降水区; (b、 d、 f、 h、 j)为降水核心区; ME和RMSE的单位: mm·h-1Fig.7 Thermal map of each precipitation product evaluation index and the temporal evolution of regional mean hourly precipitation in AWS during heavy rainfall.(a, c, e, g, i) are precipitation area; (b, d, f, h, j) are precipitation core region.Unit of ME and RMSE: mm·h-1 |
3.3 降水时空综合偏差特征
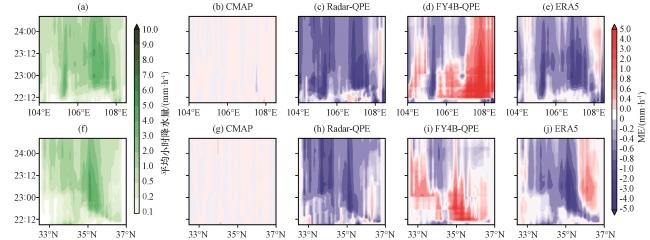
图9 降水核心区平均小时降水量的日变化(a, f)和各降水产品ME日变化特征(单位: mm·h-1)(a)~(e) 经向变化, (f)~(j) 纬向变化Fig.9 Average daily variation of hourly precipitation in the precipitation core area (a, f) and the daily variation characteristics of each precipitation product ME.Unit: mm·h-1.(a)~(e) indicates the warp direction and (f)~(j) indicates the latitude direction |
3.4 概率统计特征
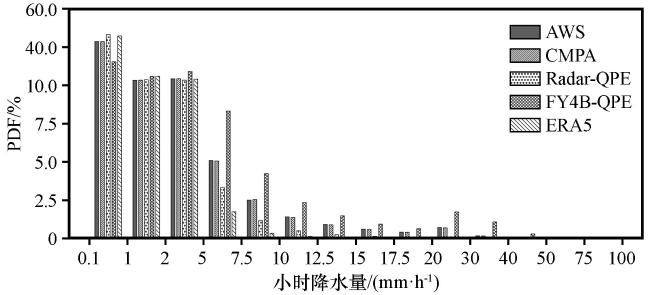
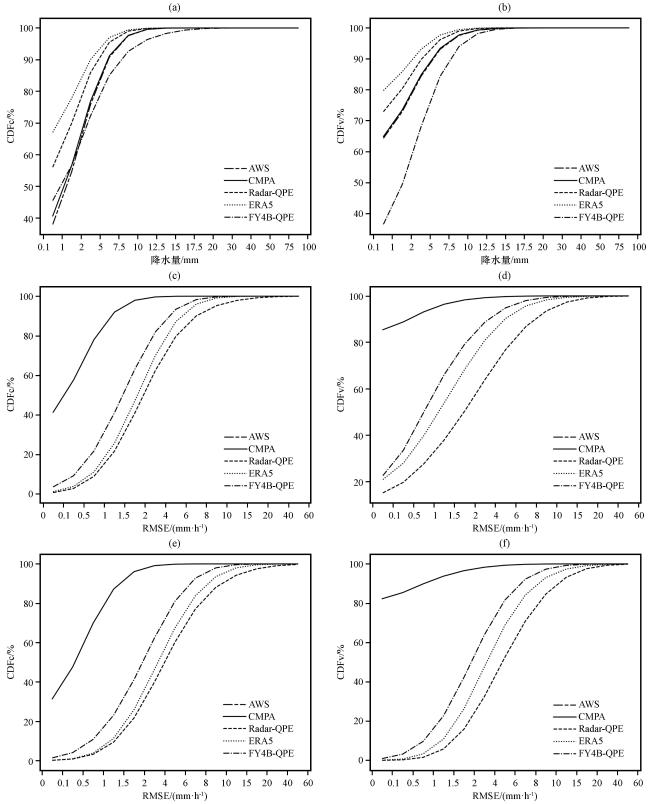
图11 暴雨期间逐时降水的CDFc和CDFv(a)、 (b)为AWS和各降水产品降水量的CDFc、 CDFv; (c)、 (d)为各降水产品RMSE的CDFc、 CDFv; (e)、 (f)为降水核心区各降水产品的RMSE的CDFc、 CDFvFig.11 CDFc and CDFv of hourly precipitation during rainstorm.(a) and (b) are CDFc and CDFv of AWS and precipitation of each precipitation product; (c) and (d) are CDFc and CDFv of each precipitation product RMSE; (e) and (f) are CDFc and CDFv of RMSE of precipitation products in precipitation core area |
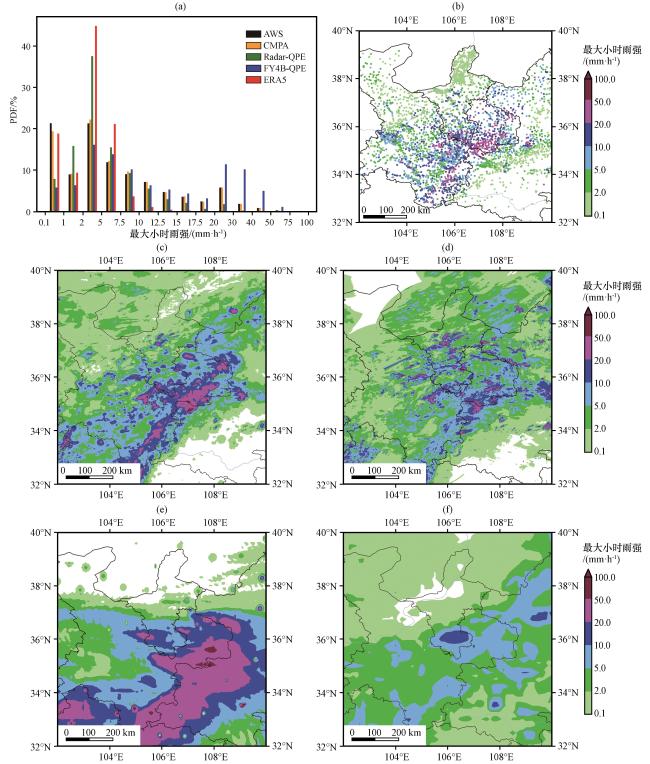
图12 暴雨期间AWS和各降水产品最大小时降水量PDF及其空间分布(a) PDF, (b)~(f)分别为AWS、 CMPA、 Radar-QPE、 FY4B-QPE、 ERA5的空间分布(单位: mm·h-1)Fig.12 PDF and the spatial distribution of maximum rainfall intensity of AWS and each precipitation product during rainstorm.(a) PDF, (b)~(f) indicate the spatial distribution of AWS, CMPA, Radar-QPE, FY4B-QPE, and ERA5 respectively (unit: mm·h-1) |