
1 引言
2 数据与方法
2.1 资料来源
2.2 辽宁东南部复杂地形区域暴雨的界定
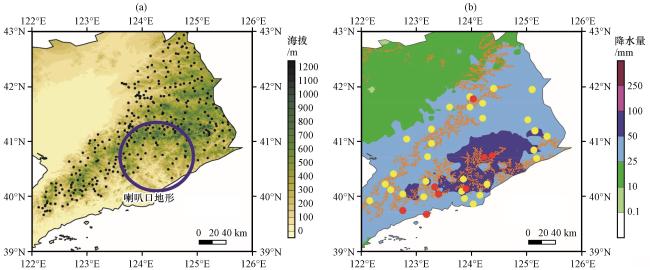
图1 辽宁区域海拔(填色, 单位: m)及复杂地形区域台站位置(黑点)(a), 44个TRECT事件日均降水量(b, 单位: mm)(b)中红点为小时降水量前20%的台站, 黄点为其余台站 Fig.1 The altitude in the Liaoning region (colored shading, unit: m) and the location of stations in complex terrain areas (the black dots) (a), the daily average precipitation of the 44 TRECT events (b, unit: mm). The red dots in the figure (b) represent the top 20% of stations in terms of hourly precipitation, while the yellow dots represent the remaining stations |
表1 TRECT事件信息Table 1 TRECT information |
| 序号 | 事件日期(年-月-日) | 最大累积降水量/mm | 日降水量超过50 mm站点数量/个 | 最大降水量时次/次 | 最大小时降水量/mm | 最大小时降水量站点经度,纬度 | 最大小时降水量站点海拔/m |
|---|---|---|---|---|---|---|---|
| 1 | 2010-07-31 | 195 | 30 | 7 | 76 | 124.2°E, 41.7°N | 214 |
| 2 | 2010-08-05 | 201.8 | 163 | 12 | 55.7 | 122.58°E, 40.42°N | 88 |
| 3 | 2010-08-08 | 155.8 | 101 | 11 | 86.8 | 124.37°E, 40.75°N | 128 |
| 4 | 2010-08-20 | 346.3 | 125 | 20 | 70.4 | 124.28°E, 40.23°N | 59 |
| 5 | 2010-08-22 | 155.5 | 120 | 16 | 55.4 | 125.18°E, 40.7°N | 182 |
| 6 | 2010-08-27 | 247.3 | 61 | 10 | 59.5 | 123.87°E, 39.97°N | 24 |
| 7 | 2011-08-09 | 234.8 | 132 | 8 | 66.9 | 122.43°E, 40.23°N | 363 |
| 8 | 2011-08-28 | 178.4 | 115 | 8 | 79.6 | 122.82°E, 41.05°N | 16 |
| 9 | 2012-07-10 | 178.4 | 254 | 8 | 52.3 | 121.68°E, 39.53°N | 6 |
| 10 | 2012-07-25 | 158.8 | 23 | 4 | 54.2 | 125.37°E, 41.1°N | 264 |
| 11 | 2012-07-29 | 145.9 | 210 | 6 | 91.6 | 123.18°E, 39.68°N | 30 |
| 12 | 2012-08-03 | 289.1 | 295 | 12 | 58.3 | 123.82°E, 40.1°N | 11 |
| 13 | 2012-08-28 | 149.8 | 190 | 19 | 32.7 | 122.75°E, 40.05°N | 372 |
| 14 | 2012-09-28 | 164.3 | 23 | 10 | 39.4 | 125.13°E, 40.85°N | 209 |
| 15 | 2013-07-02 | 225.7 | 265 | 6 | 62.5 | 123.85°E, 40.32°N | 75 |
| 16 | 2013-07-09 | 96.4 | 37 | 12 | 35.2 | 125.1°E, 41.95°N | 473 |
| 17 | 2013-07-16 | 294.3 | 323 | 7 | 84.5 | 123.4°E, 40.05°N | 115 |
| 18 | 2013-07-19 | 175.7 | 352 | 0 | 62.7 | 121.73°E, 39.82°N | 32 |
| 19 | 2013-08-16 | 317.2 | 140 | 23 | 97.4 | 123.2°E, 40.73°N | 440 |
| 20 | 2014-06-18 | 94.9 | 47 | 17 | 40.7 | 123.97°E, 41.82°N | 122 |
| 21 | 2014-06-27 | 128.5 | 27 | 5 | 49.3 | 124.2°E, 41.7°N | 214 |
| 22 | 2015-07-30 | 113.9 | 117 | 12 | 51.2 | 123.6°E, 41.63°N | 94 |
| 23 | 2015-08-04 | 133.9 | 194 | 8 | 51.8 | 124.2°E, 41.43°N | 347 |
| 24 | 2015-08-06 | 153.4 | 67 | 4 | 61.1 | 124.15°E, 40.03°N | 98 |
| 25 | 2016-05-03 | 128.5 | 330 | 16 | 26 | 124.4°E, 41.97°N | 140 |
| 26 | 2016-07-21 | 210.5 | 185 | 14 | 40.1 | 123.17°E, 40.28°N | 120 |
| 27 | 2016-08-01 | 180.5 | 75 | 23 | 75 | 122.15°E, 39.93°N | 106 |
| 28 | 2016-08-07 | 144.4 | 78 | 8 | 57.5 | 121.52°E, 39.7°N | 4 |
| 29 | 2016-08-13 | 162.3 | 103 | 5 | 89.8 | 124.03°E, 41.78°N | 115 |
| 30 | 2016-08-19 | 144.2 | 111 | 6 | 46.4 | 122.53°E, 40.13°N | 111 |
| 31 | 2017-07-07 | 134.8 | 78 | 7 | 39.6 | 121.73°E, 39.82°N | 32 |
| 32 | 2017-08-04 | 493.2 | 209 | 6 | 105 | 123.33°E, 40.18°N | 105 |
| 33 | 2018-07-14 | 158.6 | 112 | 8 | 48.9 | 123.27°E, 40.97°N | 122 |
| 34 | 2018-08-07 | 257.9 | 249 | 13 | 94.2 | 122.75°E, 39.75°N | 65 |
| 35 | 2018-08-14 | 303.6 | 318 | 1 | 88.1 | 123.9°E, 40.15°N | 69 |
| 36 | 2018-08-20 | 261.3 | 367 | 12 | 121.6 | 121.85°E, 39.73°N | 23 |
| 37 | 2018-08-29 | 110.7 | 25 | 3 | 42.3 | 125.15°E, 41.2°N | 421 |
| 38 | 2019-05-27 | 76.9 | 50 | 1 | 16.3 | 123.2°E, 40.73°N | 440 |
| 39 | 2019-06-29 | 107 | 59 | 10 | 63.8 | 123.27°E, 41.23°N | 32 |
| 40 | 2019-07-21 | 126.9 | 46 | 7 | 58 | 123.97°E, 41.63°N | 209 |
| 41 | 2019-08-03 | 229.3 | 140 | 9 | 78.4 | 123.13°E, 40°N | 49 |
| 42 | 2019-08-12 | 276.6 | 163 | 17 | 89.5 | 124.23°E, 40.72°N | 164 |
| 43 | 2019-08-15 | 217.8 | 43 | 4 | 57.7 | 125.02°E, 41.4°N | 359 |
| 44 | 2019-09-07 | 150.6 | 125 | 13 | 30 | 124.03°E, 39.87°N | 8 |
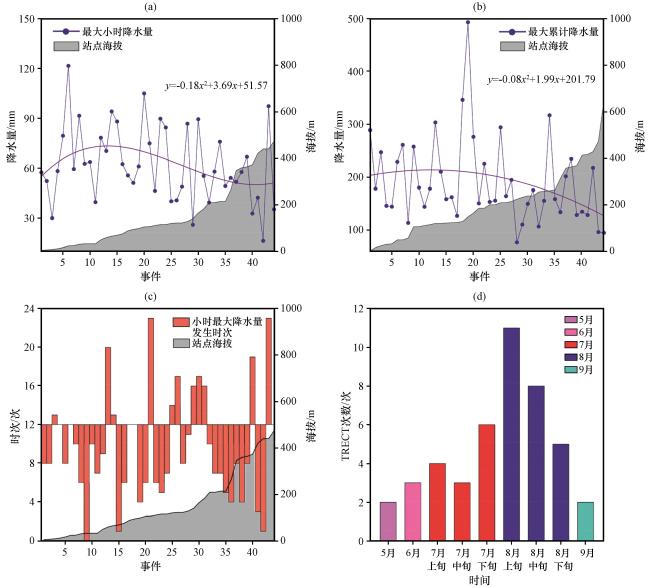
图2 TRECT事件最大小时降水量及其对应台站海拔(a), 最大累计降水量及其对应台站海拔(b), 小时最大降水量发生时次及其对应台站海拔(c), TRECT事件次数时间分布特征(d)Fig.2 TRECT events maximum hourly precipitation and altitude of observation sites (a), maximum accumulated precipitation and altitude of observation sites (b), hourly maximum precipitation times and altitude of observation sites (c), time distribution characteristics (d) |
2.3 爬流及绕流计算方法
3 影响辽宁东南部复杂地形区域暴雨事件大气环流特征
3.1 对流层中层环流条件
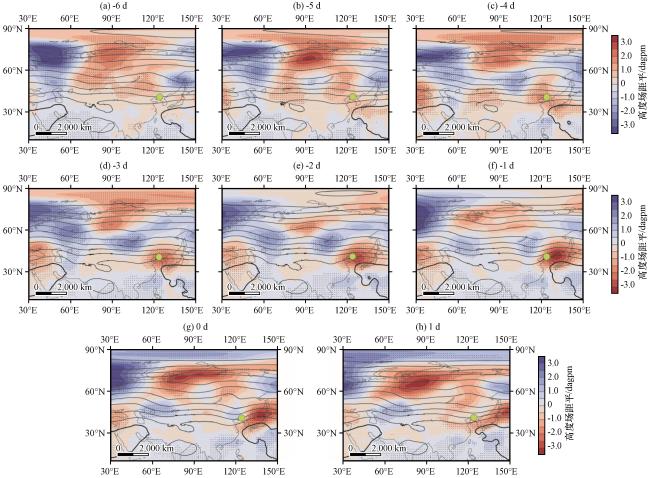
图3 44个TRECT事件-6天(a), -5天(b), -4天(c), -3天(d), -2天(e), -1天(f), 0天(g), 1天(h)的500 hPa高度场(等值线)及其距平场合成(填色)分布(单位: dagpm)打点区表示合成的500 hPa高度距平通过 95%信度检验, “0天”表示事件开始日, “-n(n)天”表示事件发生前(后) 第n天, 绿色大圆点指关键区位置 Fig.3 Composite of Z500 (contours) and its anomalies (colored shading) for the 44 TRECTs on the -6 day (a), -5 day (b), -4 day (c), -3 day (d), -2 day (e), -1 day (f), 0 day (g), 1 day (h) (unit: dagpm).The black dots indicate the composited Z500 anomalies have passed the 95% confidence level.“0 d” denotes the start day, “-n (n) d” denote the n day before (after) the beginning of the event.Green large circles indicate the key area locations |
3.2 地面形势条件
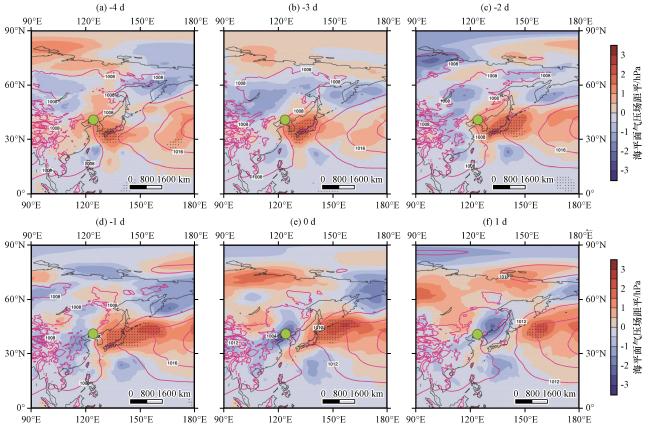
图4 44个TRECT事件-4天(a), -3天(b), -2天(c), -1天(d), 0天(e), 1天(f)的海平面气压场(等值线)及其距平场合成(填色)分布(单位: hPa)黑色点区表示合成的海平面气压场距平通过 95%信度检验, “0天”表示事件开始日, “-n(n)天”表示事件发生前(后) 第n天, 绿色大圆点指关键区位置 Fig.4 Composite time evolutions of SLP (contours) and its anomalies (colored shading) for the 44 TRECTs on the -4 day(a), -3 day(b), -2 day(c), -1 day(d), 0 day(e), 1 day (f) (unit: hPa).The black dots indicate the composited SLP anomalies have passed the 95% confidence level.“0 d” denotes the start day, “-n (n) d” denotes the n day before (after) the beginning of the event.Green large circles indicate the key area locations |
3.3 对流层低层条件
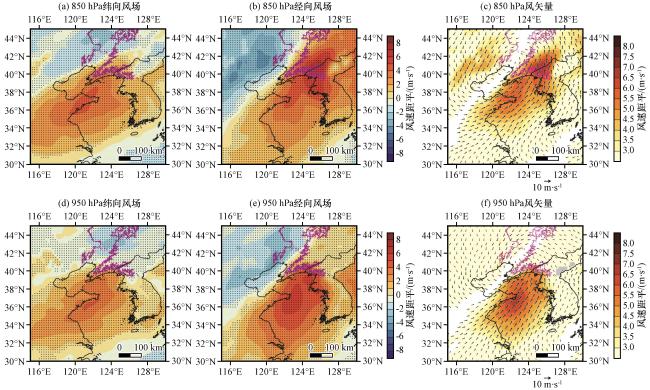
图5 44个TRECT事件鼎盛期850 hPa(a~c)和950 hPa(d~f)纬向风场(a, d)、 经向风场(b, e)、 风矢量(c, f)及其距平场合成分布(填色, 单位: m·s-1)紫色等值线表示200 m地形等值线, (c)和(f)中矢量表示风速大小(单位: m·s-1)(a、 b、 d、 e)中打点区及(c、 f)中风矢量区表示距平通过95%信度检验 Fig.5 Composite distribution of wind vector anomalies in the peak period of the 44 TRECT events at 850 hPa (a-c) and 950 hPa (d-f), zonal wind(a, d), meridional wind(b, e), and wind vector(c, f) (colored shading) (unit: m·s-1).The purple contour line represents the 200 m terrain height (unit: m), with black dots areas in (a, b, d, e) and wind vector (c, f) indicate the composited anomalies have passed the 95% confidence level |
4 TRECT事件爬流和绕流分布特征
4.1 地形影响下的爬流、 绕流运动
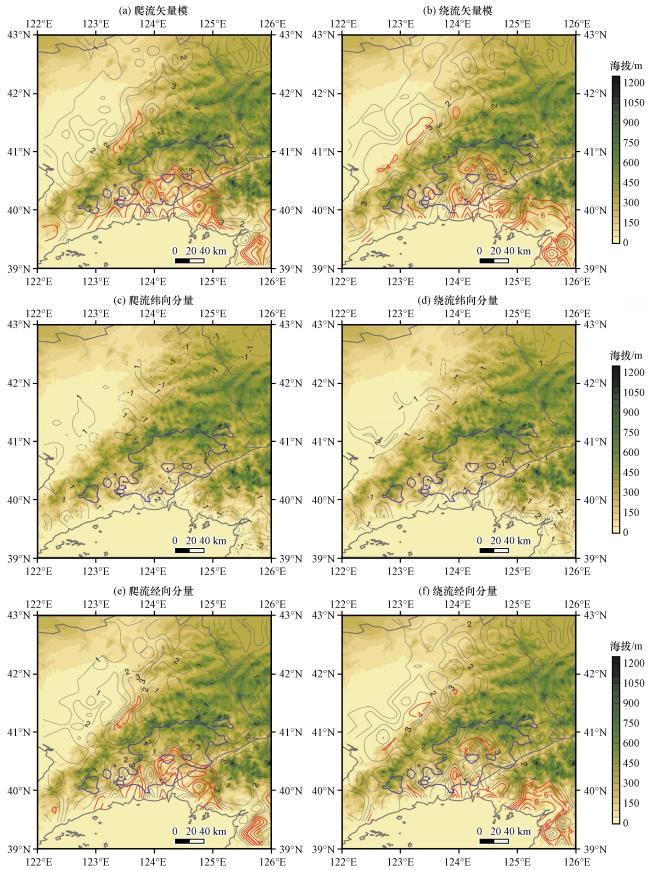
图6 44个TRECT事件鼎盛期爬流(左)和绕流(右)矢量模(a, b)、 纬向分量(c, d)、 经向分量(e, f)合成场(等值线, 单位: m·s-1)填色为海拔(单位: m), 红色等值线为大于4 m·s-1的爬流(a、 c、 e)和绕流(b、 d、 f), 蓝色等值线为50 mm降水区 Fig.6 Composite distribution of the peak period of the 44 TRECTs: flow over (left), flow around (right) vector mode (a, b), zonal component (c, d), meridional component (e, f) (contours, unit: m·s-1).Colored shading denotes elevation (unit: m).The red contour line represents the flow over(a, c, e) and flow around (b, d, f) with values greater than 4 m·s-1.The blue contour line represents the 50 mm precipitation area |
4.2 爬流、 绕流的流场分布
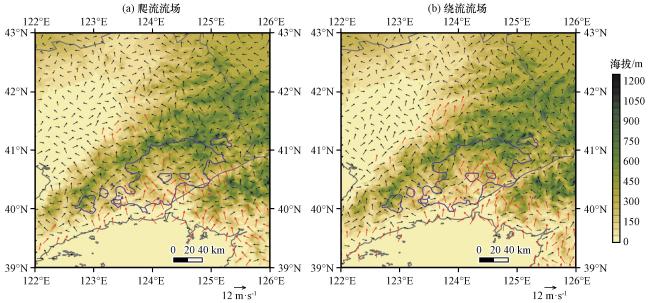
图7 44个TRECT事件鼎盛期爬流(a)和绕流(b)合成流场分布(矢量, 单位: m·s-1)填色为海拔(单位: m), 红色箭头为大于4 m·s-1的爬流(a)和绕流(b), 蓝色等值线为50 mm降水区 Fig.7 Composite Flow field distribution of flow over (a) and flow around (b) during the peak period of the 44 TRECTs (vector, unit: m·s-1) Colored shading denotes elevation (unit: m).The red arrow represents the flow over (a) and flow around (b) with values greater than 4 m·s-1.The blue contour line represents the 50 mm precipitation area |
4.3 爬流和绕流相对大小
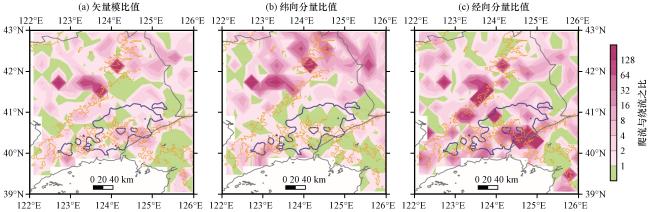
图8 44个TRECT事件鼎盛期爬流和绕流矢量模比值(a)、 纬向分量比值(b)、 经向分量比值(c) (填色)橙色等值线表示200 m地形等值线, 蓝色等值线为50 mm降水区 Fig.8 Ratio of flow over and flow (shading) around vector modes (a), zonal component (b), meridional component (c) during the peak period of the 44 TRECT events.The orange contour line represents the 200 m terrain heightThe blue contour line represents a 50 mm precipitation area |
4.4 爬、 绕流为暴雨提供的动力条件
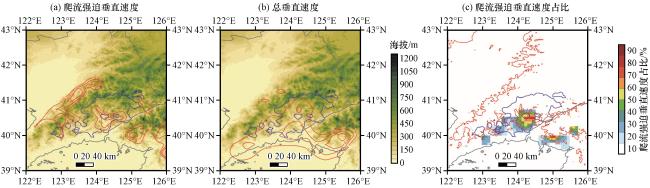
图9 44个TRECT事件950 hPa鼎盛期爬流合成强迫垂直速度(a, 红色等值线, 单位: m·s-1)、 ERA5合成总垂直速度(b, 红色等值线, 单位: m·s-1)及爬流强迫垂直速度占比(c, 填色, 单位: %)蓝色等值线为50 mm降水区, (a, b)中填色为海拔(单位: m),(c)中红色等值线表示200 m地形等值线 Fig.9 Composite vertical velocity forced by the flow over (a) and ERA5(b) (the red contour line, unit: m·s-1), and the proportion of forced vertical velocity in flow over at 950 hPa during the peak period of the 44 TRECTs(c, colored shading, unit: %).In (a) and (b), colored shading denotes elevation (unit: m), the blue contour line represents a 50 mm precipitation area.The red contour line in picture (c) represents the 200 m terrain height |
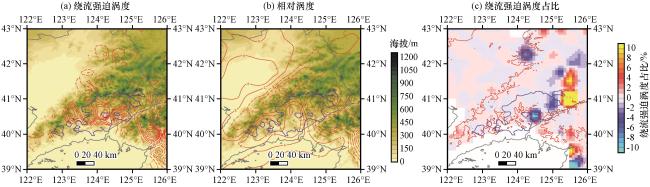
图10 44个TRECT事件950 hPa鼎盛期绕流合成强迫产生涡度(a, 红色等值线, 单位: ×10-6 rad·s-1)、 ERA5合成相对涡度(b, 红色等值线, 单位: ×10-5 rad·s-1)及绕流强迫涡度占比(c, 填色, 单位: %)(a), (b)中填色为海拔(单位: m), 蓝色等值线为50 mm降水区, (c)中红色等值线表示200 m地形等值线 Fig.10 Composite vorticity generated forced by the flow around (a, the red contour line, unit: ×10-6 rad·s-1), ERA5 (b, the red contour line, unit: ×10-5 rad·s-1) and the proportion of forced vertical generated in flow around at 950 hPa during the peak period of the 44 TRECTs (c, colored shading, unit: %).In (a) and (b), colored shading denotes elevation (unit: m), the blue contour line represents a precipitation area 50 mm.The red contour line in picture (c) represents the 200 m terrain height |
4 讨论
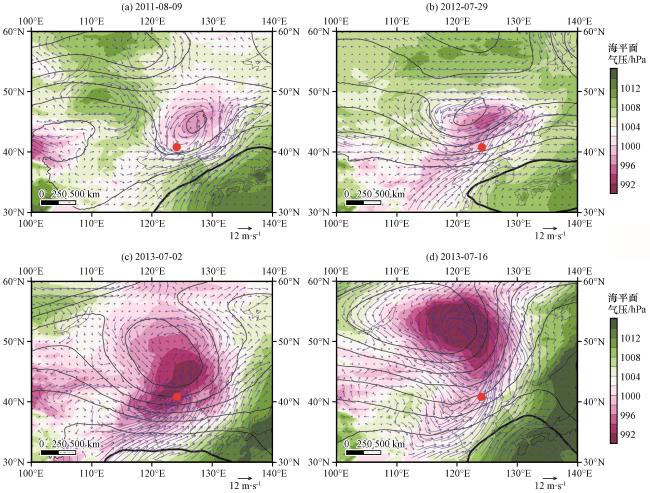
图11 4次TRECT事件2011年8月9日(a)、 2012年7月29日(b)、 2013年7月2日(c)、 2013年7月16日(d)500 hPa位势高度场(黑色等值线, 单位: dagpm)、 海平面气压场(填色, 单位: hPa)、 850 hPa流场(蓝色风矢量, 单位: m·s-1)(红点为关键区位置)Fig.11 Four TRECT events showing: 9 August 2011 (a), 29 July 2012 (b), 2 July 2013 (c), 16 July 2013 (d).Plotted elements include: 500 hPa geopotential height field (black contours, unit: dagpm), sea level pressure field(colored shading, unit: hPa), 850 hPa flow field (blue wind vectors, unit: m·s¹).Red dots denote the key region locations |