
1 引言
2 数据来源与方法介绍
2.1 数据来源
2.2 方法介绍
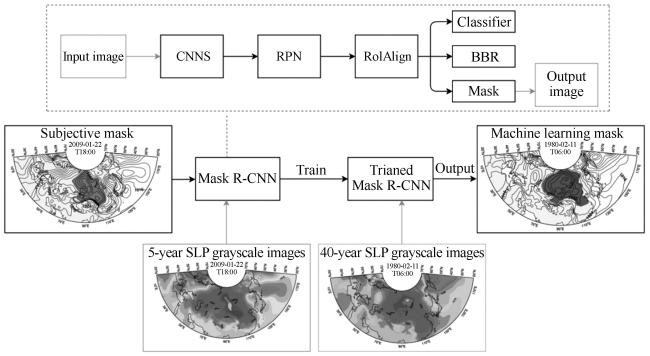
2.2.1 基于Mask R-CNN的反气旋客观识别算法
2.2.2 极寒天数
2.2.3 冷空气质量
3 结果分析
3.1 BKS区域海冰异常变化与区域降温的联系
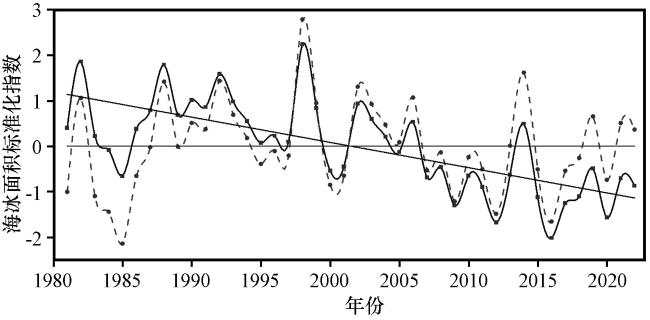
图2 1981 -2022年秋季平均BKS区域(70°N -80°N, 30°E -90°E)实际(实曲线)和去趋势(虚曲线)的海冰面积标准化指数及其线性趋势(直线)的时间序列Fig.2 Time series of the standardized sea ice area index (solid line for actual values and dashed line for detrended values) in the BKS region (70°N -80°N, 30°E -90°E) during the autumn for the period 1981 -2022, along with their linear trends (straight lines) |
表1 1981 -2022 年ERA5高、 低海冰年Table 1 ERA5 high and low sea ice years from 1981 to 2022 |
| 年份 | |
|---|---|
| 高海冰年 | 1982、 1988、 1990、 1991、 1992、 1993、 1994、 1998、 1999、 2002、 2003、 2004、 2005、 2006、 2013、 2014、 2019、 2021、 2022 |
| 低海冰年 | 1981、 1983、 1984、 1985、 1986、 1987、 1989、 1995、 1996、 1997、 2000、 2001、 2007、 2008、 2009、 2010、 2011、 2012、 2015、 2016、 2017、 2018、 2020 |
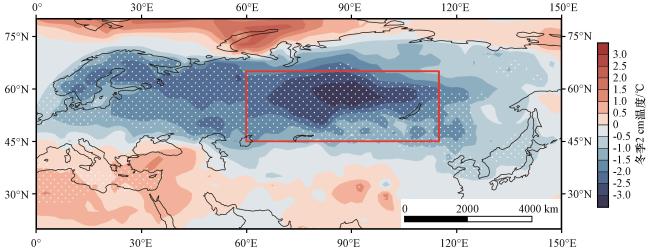
图3 秋季BKS区域(70°N -80°N, 30°E -90°E)高低海冰年的冬季t2m合成差值(低-高海冰年, 单位: ℃)白点区域通过0.1的显著性水平检验, 红框区域为西伯利亚冷核区(45°N -65°N, 60°E -115°E) Fig.3 Synthetic differences of winter temperature at 2 meters between years of low and high sea ice in the BKS region (70°N -80°N, 30°E -90°E) during autumn (low sea ice year - high sea ice year, unit: °C).The areas marked with white dots indicate regions that have passed the significance test at the 0.1 level, the red box highlights the Siberian cold-core region (45°N -65°N, 60°E -115°E) |
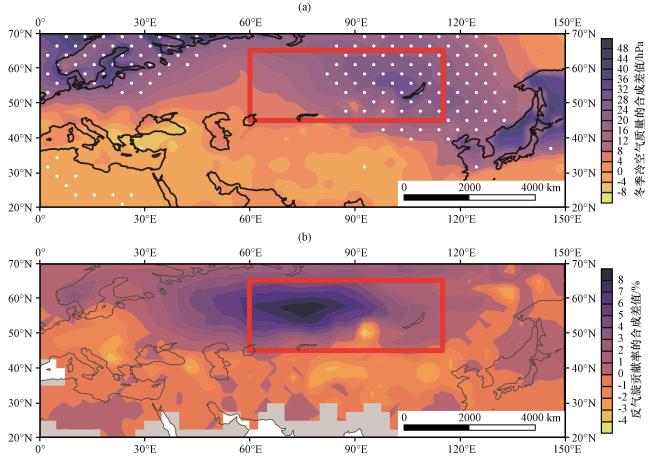
图4 秋季BKS区域(70°N -80°N, 30°E -90°E)高低海冰年的冬季冷空气质量的合成差值(a, 低-高海冰年, 单位: hPa, 白点区域通过0.1的显著性水平检验)和反气旋对冷空气质量贡献率的合成差值(b, 低-高海冰年, 单位: %, 无反气旋影响区域已设为缺测)Fig.4 Synthetic differences of winter cold air mass between years of low and high sea ice in the BKS region (70°N -80°N, 30°E -90°E) during autumn (a, low sea ice year - high sea ice year, unit: hPa, the areas marked with white dots indicate regions that have passed the significance test at the 0.1 level) and the composite difference in the contribution rate of anticyclones to cold air mass (Low sea ice year - high sea ice year, unit: %, the regions not affected by anticyclones have been set to missing) |
3.2 未来情景下海冰与反气旋活动的联系
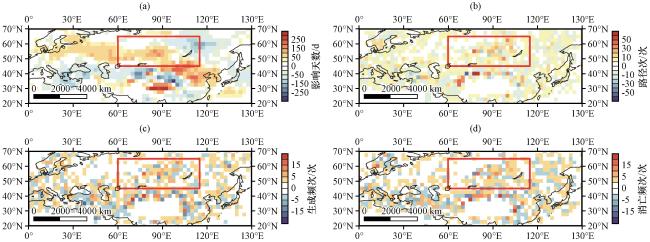
图5 MIROC6在futBK-pd情境下模拟得到的冬季经过西伯利亚地区(45°N -65°N, 60°E -115°E)的反气旋影响天数(a, 单位: 天)、 路径(b, 单位: 次)、 生成频次(c, 单位: 次)和消亡频次(d, 单位: 次)的合成差值Fig.5 Synthetic differences in winter anticyclone activity over the Siberian region (45°N -65°N, 60°E -115°E) simulated by MIROC6 under the futBK-pd scenario, showing the number of days influenced (a, unit: d), the paths (b, unit: times), the frequency of genesis (c, unit: times), and the frequency of lysis (d, unit: times) |
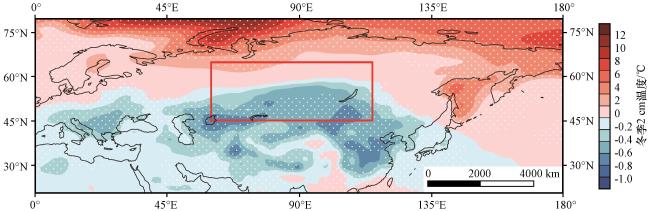
图6 MIROC6在futBK-pd情境下模拟得到的冬季t2m合成差值(单位: ℃)白点区域通过0.1的显著性水平检验 Fig.6 Synthetic differences of winter temperature at 2 meters simulated by MIROC6 under the futBK-pd scenario.Unit: ℃.The areas marked with white dots indicate regions that have passed the significance test at the 0.1 level |
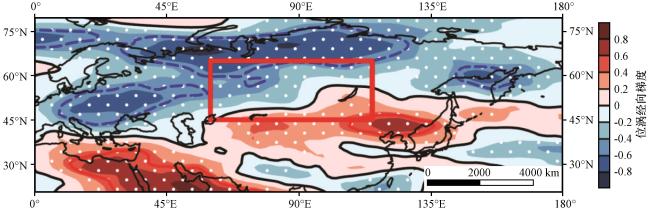
图8 MIROC6在futBK-pd情境下模拟得到的无量纲500 hPa位涡经向梯度(PVy)和纬向风的合成差值(单位: m·s-1)白点区域通过0.05的显著性水平检验; 正值为红实线, 负值为蓝虚线, 0为黑实线 Fig.8 Synthetic differences of dimensionless 500 hPa potential vorticity meridional gradient (PVy) and zonal wind simulated by MIROC6 under the futBK-pd scenario.Unit: m·s-1.Areas marked with white dots indicate regions that have passed the significance test at the 0.05 level.Positive values are shown as red solid lines, negative values as blue dashed lines, and zero as a black solid line |