
1 引言
2 资料来源及降雪实况
2.1 资料来源
2.2 降雪实况
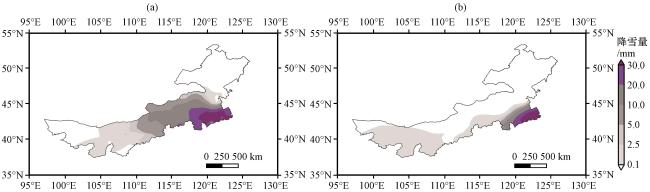
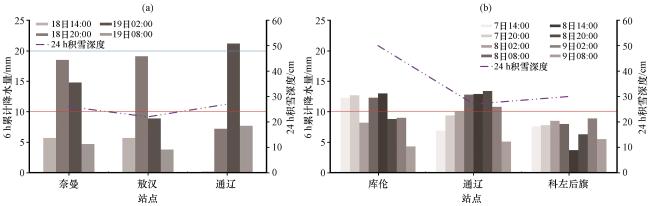
图2 2020年11月18日08:00至19日08:00 (a)、 2021年11月7日08:00至8日08:00 (b)降水量最大的3个站的6 h降水量演变、 24 h积雪深度红线: 6 h累计降水量10 mm线, 蓝线: 6 h累计降水量20 mm线 Fig.2 Evolution of 6-hour precipitation and 24-hour snow depth at the three stations with the largest precipitation from 08:00 on 18 to 08:00 on 19 November, 2020 (a), and from 08:00 on 7 to 08:00 on 8 November 2021 (b).Red line represents 6 h accumulated precipitation of 10 mm line; blue line reprsents 6 h accumulated precipitation of 20 mm line |
3 环流形势对比
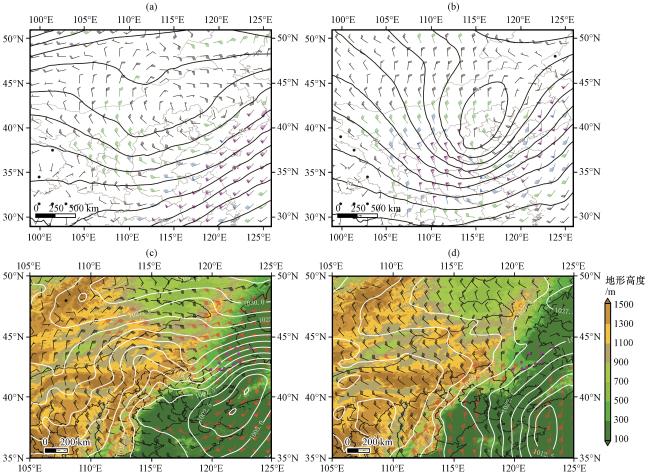
图3 2020年11月18日20:00 (a, c)和2021年11月7日20:00 (b, d)环流形势图(a)、 (b)中, 等值线为500 hPa等高线(单位: dagpm), 风向杆为700 hPa风场(单位: m·s-1, 绿色: 12 m·s-1以上, 蓝色: 16 m·s-1以上, 紫色: 20 m·s-1以上); 图(c)、 (d)中, 等值线为海平面气压(单位: hPa), 风向杆为850 hPa风场(单位: m·s-1, 红色: 12 m·s-1以上), 填色为地形高度(单位: m), 紫色圆点为24 h累计降水量超过30 mm的站点Fig.3 Circulation patterns at 20:00 on November 18, 2020 (a, c) and 20:00 on November 7, 2021 (b, d).In Fig.3 (a) and (b), the contour lines are the 500 hPa isohypse (unit: dagpm), and the wind barbs are the 700 hPa wind field (unit: m·s-1, green: above 12 m·s-1, blue: above 16 m·s-1, purple: above 20 m·s-1); in Fig.3 (c) and (d), the contour lines represent sea level pressure (unit: hPa), the wind barbs are the 850 hPa wind (unit: m·s-1, red: above 12 m·s-1), the filled color is the topography (unit: m) and the purple dots are the stations with a 24-hour cumulative precipitation of more than 30 mm |
4 环境场特征对比
4.1 高空影响因素分析
4.1.1 云中冰晶形态特征
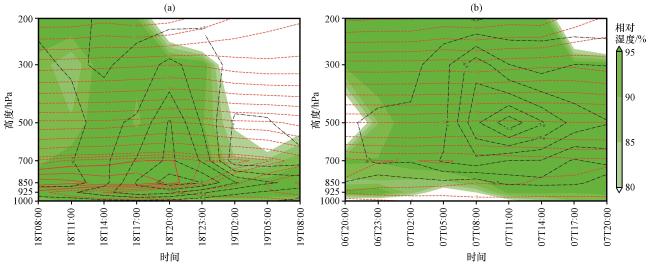
图4 2020年11月18日08:00至19日08:00(a)沿暴雪中心(121.75°E, 42.75°N)、 2021年11月6日20:00至7日20:00 (b)沿暴雪中心(121°E, 42.25°N)相对湿度(填色, 单位: %)、 垂直速度(黑色等值线, 单位: Pa·s-1)、 温度(红色等值线, 单位: ℃)的时间-高度剖面Fig.4 Time-height cross sections of relative humidity (shading, unit: %), vertical velocity (black contour, unit: Pa·s-1), and temperature (red contour, unit: ℃) along the center of the blizzard (121.75°E, 42.75°N) from 08:00 on November 18 to 08:00 on November 19, 2020 (a), and along the center of the blizzard (121°E, 42.25°N) from 20:00 on November 6 to 20:00 on November 7, 2021 (b) |
4.1.2 高空降水粒子相态特征
4.1.2.1 探空曲线特征
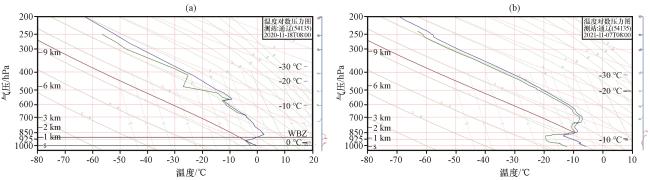
图5 2020年11月18日08:00(a)、 2021年11月7日08:00(b)通辽站温度对数压力图Fig.5 Temperature logarithmic pressure graph at Tongliao station at 08:00 on 18 November 2020 (a) and at 08:00 on 7 November 2021 (b) |
表1 两次极端暴雪过程的大气温度层结特征Table 1 Atmospheric temperature stratification characteristics of two extreme blizzard processes |
| 过程 | 高度/hPa | 气温/℃ | 层次 | 过程 | 高度/hPa | 气温/℃ | 层次 |
|---|---|---|---|---|---|---|---|
| 过程1 | 700 | -4.0 | 冰相层 | 过程2 | 678 | -8.1 | 冰相层 |
| 791 | -0.8 | 700 | -7.0 | 逆温层 | |||
| 826 | 1.1 | 融化层 | 873 | -13.2 | |||
| 850 | 1.8 | 925 | -10.0 | 冰相层 | |||
| 870 | 2.5 | 逆温层、 融化层 | 959 | -7.8 | |||
| 925 | -2.1 | 逆温层 | 965 | -7.4 | 逆温层 | ||
| 937 | -4.3 | 973 | -8.1 | ||||
| 980 | -1.7 | 冰相层 | 995 | -6.7 | 冰相层 | ||
| 1000 | -0.1 | 1000 | -6.4 |
4.1.2.2 暖层位势厚度特征
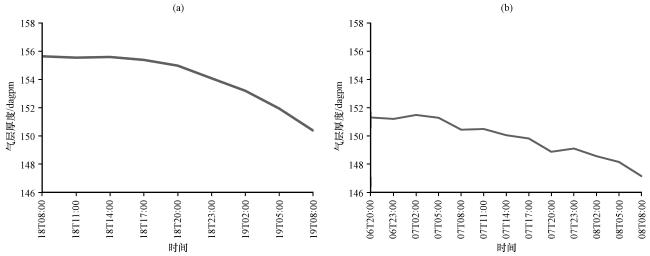
图6 2020年11月18日08:00至19日08:00(a)沿暴雪中心(120.75°E, 42.75°N)、 2021年11月6日20:00至8日08:00 (b)沿暴雪中心(122°E, 42.75°N)大气暖层700~850 hPa厚度随时间演变Fig.6 Evolution of the thickness of the atmospheric warm layer (700~850 hPa) along the center of the blizzard (120.75°E, 42.75°N) from 08:00 on November 18 to 08:00 on November 19, 2020 (a), and along the center of the blizzard (122°E, 42.75°N) from 20:00 on November 6 to 08:00 on November 8, 2021 (b) |
4.1.2.3 云中冰(液)相粒子分布
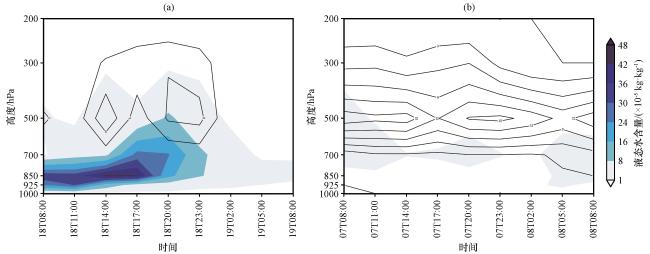
图7 2020年11月18日08:00至19日08:00(a)沿暴雪中心(120.75°E, 42.75°N)和2021年11月7日08:00至8日08:00(b)沿暴雪中心(122°E, 42.75°N)的云中冰含量(等值线, 单位: ×10-5 kg·kg-1)、 云中液态水含量(填色, 单位: ×10-5 kg·kg-1)的时间-高度剖面Fig.7 Time-height cross sections of cloud ice content (contour, unit: ×10-5 kg·kg-1) and cloud liquid water (shading, unit: ×10-5 kg·kg-1) along the center of the blizzard (120.75°E, 42.75°N) from 08:00 on 18 November 2020 to 08:00 on 19 November 2020 (a) and along the center of the blizzard (122°E, 42.75°N) at 08:00 on 7 November 2021 to 08:00 on 8 November 2021 (b) |
4.2 近地面影响因素分析
4.2.1 近地面温度
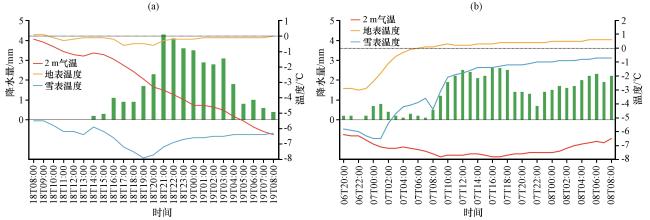
图8 2020年11月18日08:00至19日08:00通辽站(a)、 2021年11月6日20:00至8日08:00库伦站(b)2 m气温、 地表温度、 雪表温度、 逐小时降水量随时间演变Fig.8 Evolution of 2-m air temperature, surface temperature, snow surface temperature, and hourly precipitation with time at Tongliao station from 08:00 on November 18 to 08:00 on November 19, 2020 (a), and Kuerlen station from 20:00 on November 6 to 08:00 on November 8, 2021 (b) |
4.2.2 近地面风速
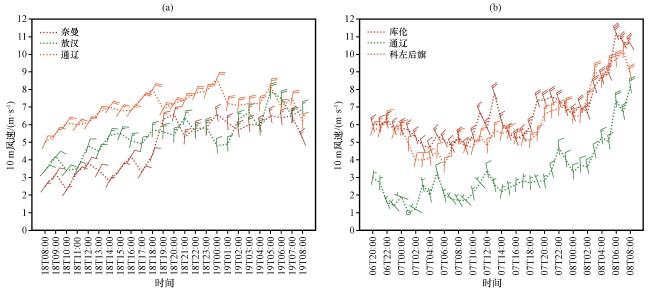
图9 2020年11月18日08:00至19日08:00(a)、 2021年11月6日20:00至8日08:00(b)24 h累计降水量最大的3个站10 m风场随时间的演变Fig.9 Time evolution of the 10 m wind field for the three stations with the largest 24-hour accumulated precipitation from 08:00 November 18 to 08:00 November 19, 2020 (a) and 20:00 November 6 to 08:00 November 8, 2021 (b) |