
1 引言
2 数据来源及预处理方法
2.1 数据来源
2.2 因子选择
表1 建模所选取的因子Table 1 Predictors selected for modeling |
| 因子类型 | 特征变量 |
|---|---|
| ECMWF模式地面预报因子 | 日最高/最低气温、地面2 m温度、2 m露点温度、地表温度、10 m风速、10 m风向、平均海平面气压、对流有效位能、预报反照率、大气柱水总量、大气柱水汽总量 |
| ECMWF模式高空预报因子 | 500 hPa、700 hPa和850 hPa位势高度、温度、比湿、风速和风向 |
| 临近观测因子 | 滞后2 d日最高/最低气温观测、滞后3 d日最高/最低气温观测 |
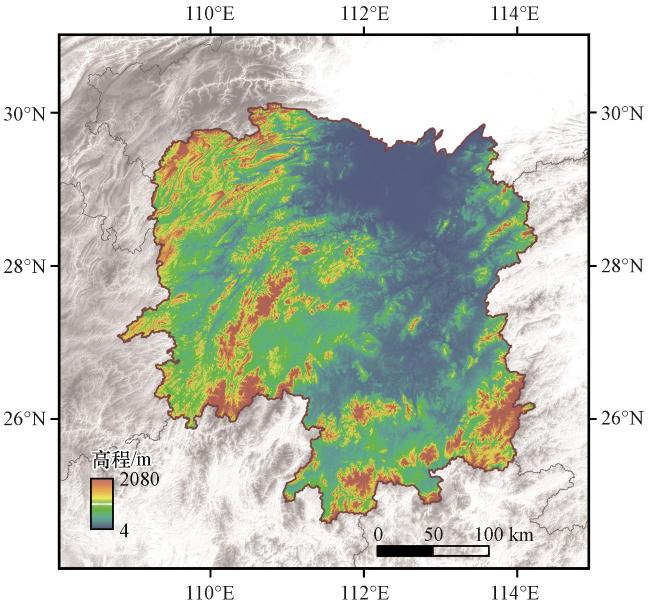
| 地理变量 | 数字高程、坡度和坡向 |
2.3 数据预处理
3 方法
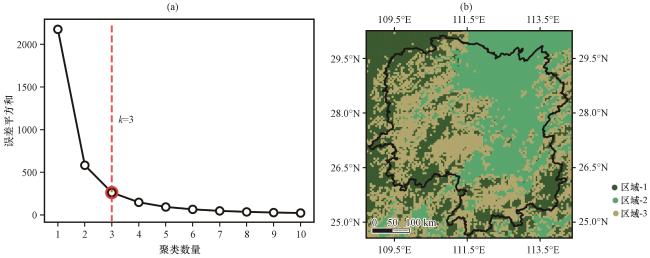
3.1 K-means聚类法
3.2 卷积神经网络
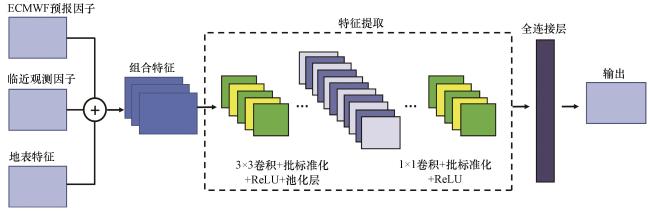
表2 模型训练超参数设置Table 2 Hyperparameter configurations for model training |
| 超参数 | 设置 |
|---|---|
| 学习率 | 0.001 |
| 优化器算法 | ADAM算法 |
| 训练时期数 | 400 |
| 正则化方法 | 早停法 |
| 批量数 | 64 |
| 损失函数 | MAE |
3.3 检验方法
4 结果与分析
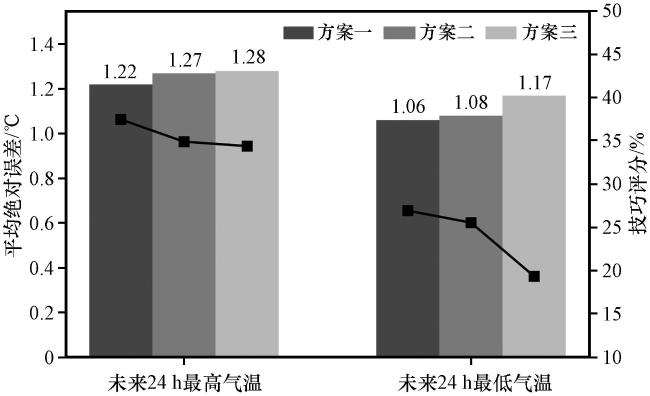
4.1 不同特征组合方案对比
4.2 基于最优特征方案的CNN模型评估
4.2.1 模型整体预报效果
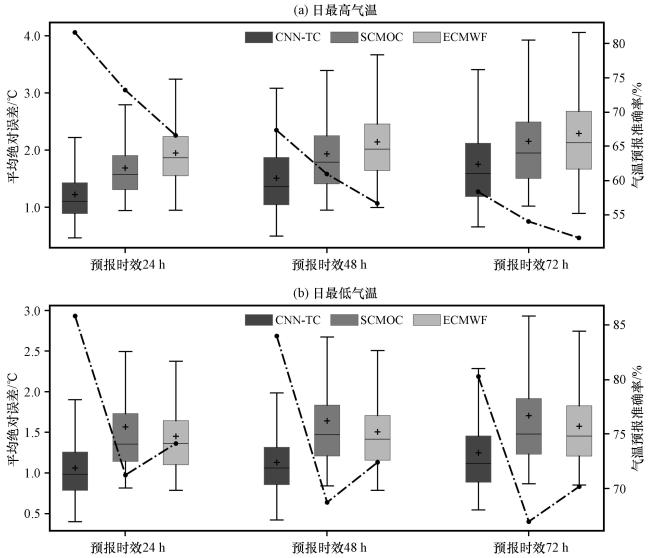
图5 CNN-TC模型、 SCMOC和ECMWF模式在不同预报时效日最高气温(a)和日最低气温(b)预报的平均绝对误差(箱线图, 单位: ℃)和气温预报准确率(折线图, 单位: %)Fig.5 MAE (box plot, unit: ℃) and ATF (line chart, unit: %) for the daily maximum temperature (a) and minimum temperature (b) from the CNN-TC, SCMOC and ECMWF model at different forecast leading times |
表3 基于国家气象站日最高、 最低气温观测数据的预报订正误差检验统计表Table 3 Verification statistics for corrected forecast of daily maximum and minimum temperatures using national meteorological station observations |
| 评估指标 | 预报时效 | CNN-TC | SCMOC | ECMWF | |||
|---|---|---|---|---|---|---|---|
| 最高温 | 最低温 | 最高温 | 最低温 | 最高温 | 最低温 | ||
| MAE/℃ | 24 h | 1.3 | 1.2 | 1.6 | 1.4 | 1.8 | 1.3 |
| 48 h | 1.5 | 1.3 | 1.9 | 1.5 | 2.1 | 1.4 | |
| 72 h | 1.8 | 1.4 | 2.1 | 1.6 | 2.2 | 1.4 | |
| ATF/% | 24 h | 78.9 | 81.4 | 71.1 | 77.2 | 62.7 | 78.8 |
| 48 h | 72.4 | 79.7 | 64.0 | 73.5 | 57.9 | 76.8 | |
| 72 h | 66.7 | 76.2 | 59.4 | 71.4 | 55.2 | 74.7 | |
4.2.2 模型时空维度的预报效果
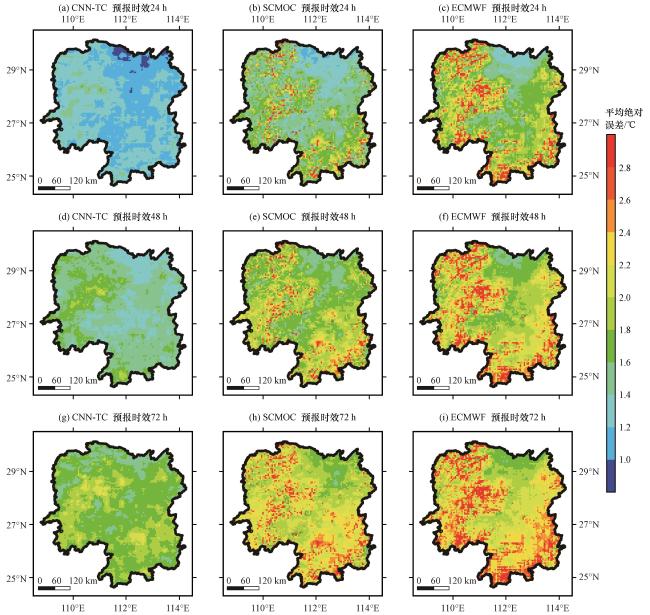
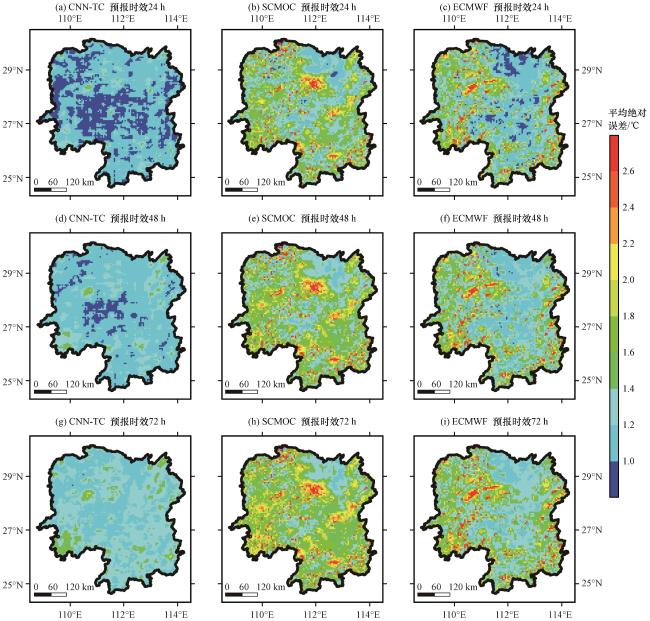
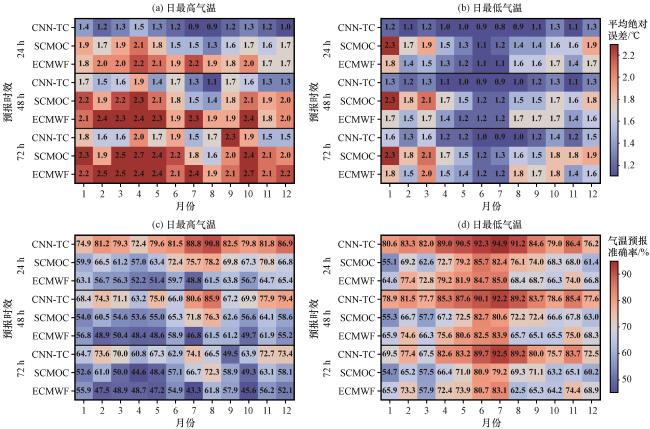
图8 CNN-TC模型、 SCMOC和ECMWF模式在不同预报时效日最高气温(a, c)和日最低气温预报(b, d)的平均绝对误差(单位: ℃)、 气温预报准确率(单位: %)月际变化Fig.8 Monthly variations of the MAE (unit: ℃) and ATF (unit: %) values of the daily maximum (a, c) and minimum (b, d) temperature forecasts from the CNN-TC, SCMOC and ECMWF at different forecast leading times |
4.3 个例检验
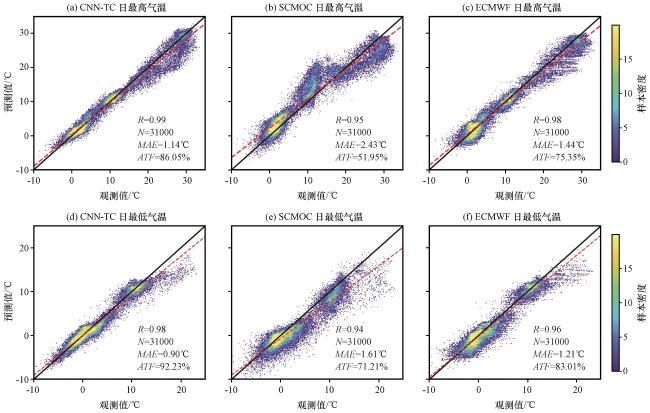
图9 强寒潮过程期间CNN-TC模型(a, d)、 SCMOC(b, e)和ECMWF模式(c, f)在湖南地区的预测值与观测值核密度分布 填色表示每个像元内的样本个数(即样本密度), 黑色实线为对角线, 红色虚线为散点的拟合线, 图中右下角标注R、 N分别为相关系数与样本个数Fig.9 Kernel density estimation plots comparing forecasts and observations over Hunan during the severe cold-air outbreak event for CNN-TC (a, d), SCMOC (b, e), and ECMWF (c, f).Color shading represents sample density at each grid point.The black solid line denotes the 1∶1 reference line, and the red dashed line indicates the linear regression fit.Correlation coefficient (R) and sample size (N) are annotated in the bottom-right corner |
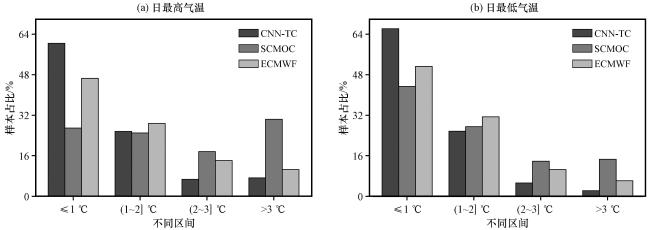
图10 三种预报产品日最高气温(a)和日最低气温(b)预报值与观测值绝对误差在不同区间范围内样本占比Fig.10 The percentage distribution of samples across different absolute error intervals between forecasted and observed values for daily maximum temperature (a) and daily minimum temperature (b) among three forecast products |
表4 本次强寒潮过程基于国家气象站日最高、 最低气温观测数据的预报订正误差检验统计表Table 4 Verification statistics of forecast corrections for daily maximum and minimum temperatures during the severe cold-air outbreak event using observational data from national meteorological stations |
| 评估指标 | CNN-TC | SCMOC | ECMWF | |||
|---|---|---|---|---|---|---|
| 最高气温 | 最低气温 | 最高气温 | 最低气温 | 最高气温 | 最低气温 | |
| MAE/℃ | 1.2 | 0.9 | 2.5 | 1.3 | 1.5 | 1.2 |
| ATF/% | 84.4 | 92.9 | 55.6 | 80.4 | 76.7 | 86.2 |