
1 引言
2 数据来源与方法介绍
2.1 数据来源
2.2 径向风稀疏化方法
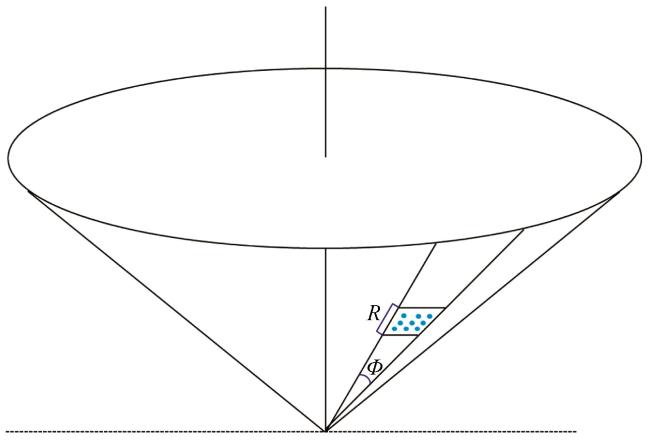
图1 雷达径向风稀疏化示意图 圆点为质量控制后的径向风观测值, R为径向间距、 Ф为方位角间隔, 均称为稀疏化单元格分辨率, 文中也称为SO的分辨率Fig.1 Schematic illustration of radial wind thinning.The dots represent radial wind observations which have been subjected to quality control.R is the range bin spacing, Φ is the azimuthal averaging, Both are referred to as sparse cell resolution, also known as SO grid resolution in the paper |
3 暴雨个例与同化试验
3.1 暴雨个例
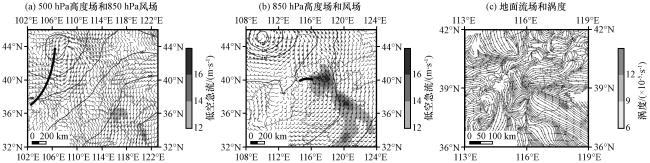
图2 2020年8月12日08:00 (a)和20:00 (b)位势高度场(等值线, 单位: dagpm)与风场(风羽, 单位: m·s-1, 阴影为低空急流)及20:00流场与涡度(阴影, 单位: ×10-5 s-1) (c)Fig.2 The geopotential height (contour lines, unit: dagpm) and wind field (barb, unit: m·s-1, shading is low-level jet stream) at 08:00 (a) and 20:00 (b), the flow field and vorticity (shading, unit: ×10-5 s-1) at 20:00 (c) on August 12, 2020 |
3.2 同化试验
表1 雷达径向风稀疏化方案Table 1 Radar radial wind thinning schemes |
| 组名 | 试验名称 | 径向间距/km | 方位角间隔/(°) | 目的 试验 | |
|---|---|---|---|---|---|
| 参考组 | 参考试验 | del_ra5 | 5 | 5 | 分析R或Ф变化影响的基础试验 |
| 第一组 | del_r | del_r6 | 6 | 5 | 分析径向间距R变化对SO的影响 |
| del_r7 | 7 | ||||
| del_r8 | 8 | ||||
| del_r9 | 9 | ||||
| del_r10 | 10 | ||||
| 第二组 | del_a | del_a6 | 5 | 6 | 分析方位角间隔Ф变化对SO的影响 |
| del_a7 | 7 | ||||
| del_a8 | 8 | ||||
| del_a9 | 9 | ||||
| del_a10 | 10 |
4 雷达径向风超级观测特征
4.1 径向风实况分析
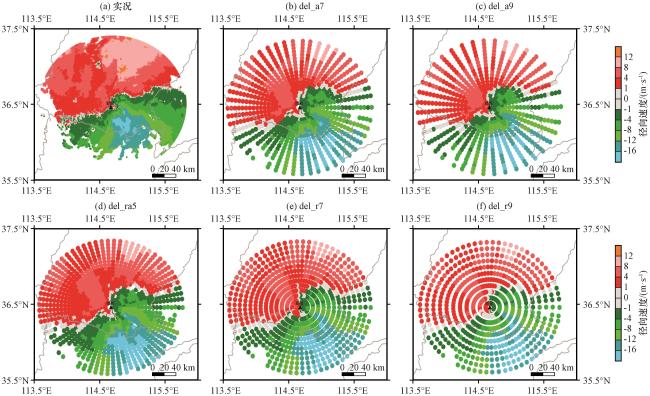
图3 2020年8月12日08:00邯郸站1.5°仰角层雷达径向风观测和各试验的SO分布(单位: m·s-1)(a)实况, (b)del_a7, (c)del_a9, (d)del_ra5, (e)del_r7, (f)del_r9Fig.3 Radar radial wind observations and SO distribution from each experiments at 1.5°elevation of Handan at 08:00 August 12, 2020.Unit: m·s-1.(a) observations, (b) del_a7, (c) del_a9, (d) del_ra5, (e) del_r7, (f) del_r9 |
4.2 超级观测特征
表2 del_r组雷达径向风资料稀疏化前后的数量Table 2 The quantity of radar radial wind data before and after thinning in the del_r experiments |
| 仰角/(°) | 质控后的 资料量/个 | 稀疏化后的资料量/个 | |||||
|---|---|---|---|---|---|---|---|
| R: 5 km | R: 6 km | R: 7 km | R: 8 km | R: 9 km | R: 10 km | ||
| 合计 | 609993 | 6444 | 5521 | 4860 | 4527 | 3843 | 3492 |
| 0.5 | 135829 | 1315 | 1121 | 982 | 914 | 776 | 706 |
| 1.5 | 123246 | 1304 | 1119 | 983 | 914 | 776 | 705 |
| 2.4 | 118883 | 1281 | 1102 | 975 | 908 | 772 | 701 |
| 3.3 | 117683 | 1286 | 1099 | 966 | 901 | 763 | 693 |
| 4.3 | 114352 | 1258 | 1080 | 954 | 890 | 756 | 687 |
5 同化及预报结果分析
5.1 初始分析误差
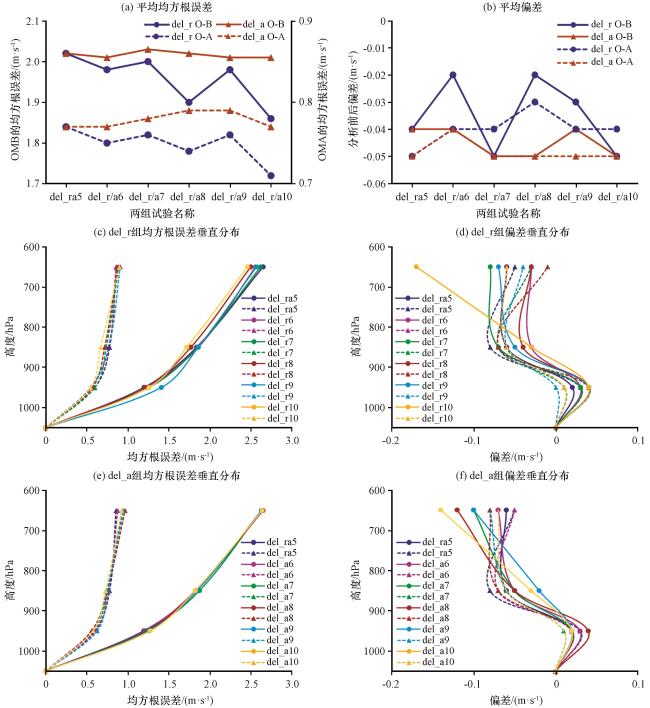
图5 两组试验同化前后OMB(实线)和OMA(虚线)的均方根误差及偏差 (a)平均均方根误差, (b)平均偏差, (c, d)del_r组均方根误差和偏差的垂直分布, (e, f)del_a组均方根误差和偏差的垂直分布Fig.5 Root mean square error (RMSE) and bias from the SO minus background (OMB, solid lines) and observation minus analysis (OMA, dashed lines) of two groups experiment before and after data assimilation.(a) mean RMSE, (b) mean bias, (c, d) vertical distribution of RMSE and bias in the del_r group, (e, f) vertical distribution of RMSE and bias in the del_a group |
5.2 初始风场调整
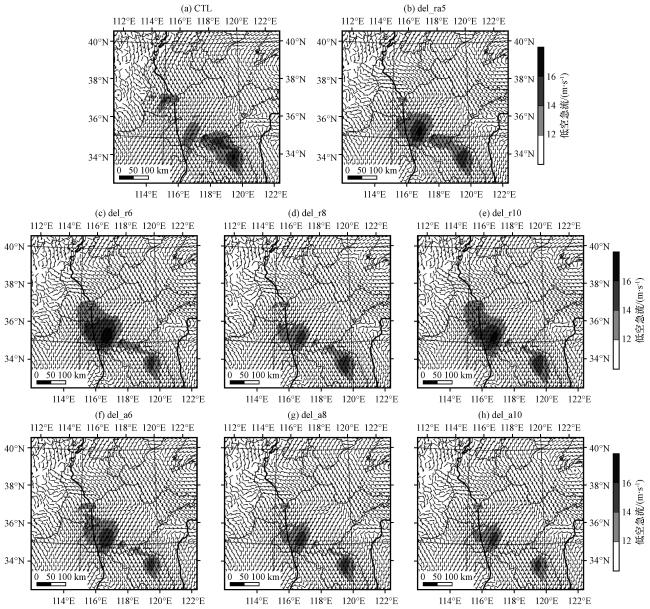
图6 2020年8月12日08:00各试验850 hPa的风场(风羽, 单位: m·s-1)、 低空急流(阴影, 单位: m·s-1)及高度场(等值线, 单位: dagpm)(a)CTL, (b)del_ra5, (c)del_r6, (d)del_r8, (e)del_r10, (f)del_a6, (g)del_a8, (h)del_a10Fig.6 The wind (barb, unit: m·s-1), low-level jet stream (shading, unit: m·s-1) and the geopotential height field (contour line, unit: dagpm) at 850 hPa from each experiment at 08:00 on August 12, 2020.(a) CTL, (b) del_ra5, (c) del_r6, (d) del_r8, (e) del_r10, (f) del_a6, (g) del_a8, (h) del_a10 |
5.3 降水预报效果
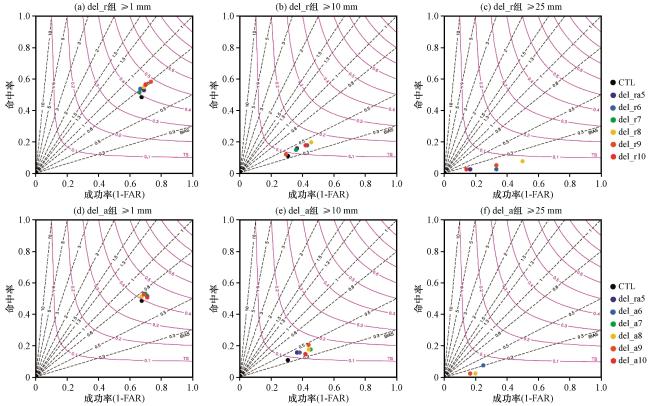
图9 2020年8月12日08:00 -14:00 del_r组(a~c)和del_a组(d~f)试验预报的累积≥1 mm (a, d)、 ≥10 mm (b, e)、 ≥25 mm(c, f)降水的评分综合图Fig.9 Performance diagram of 6-hour accumulated precipitation [≥1 mm (a, d), ≥10 mm (b, e), ≥25 mm (c, f)] by the del_r (a~c) and the del_a (d~f) group experiments from 08:00 to 14:00 on August 12, 2020 |
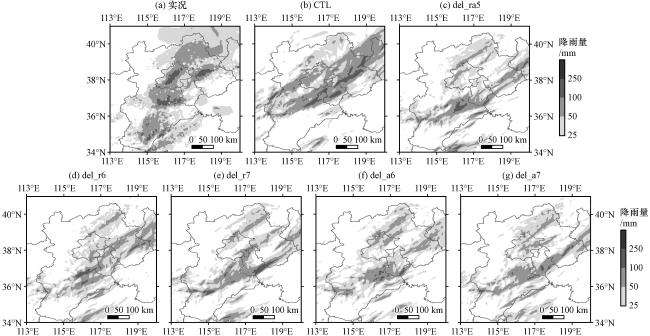
图11 2020年8月12日08:00至13日08:00 24 h累积实况和各试验模拟的降水量(单位: mm)(a)observation, (b)CTL, (c)del_ra5, (d)del_r6, (e)del_r7, (f)del_a6, (g)del_a7Fig.11 24-hour accumulated observed and simulated precipitation by each experiment from 08:00 on 12 to 08:00 on 13 August 2020.Unit: mm.(a) observation, (b) CTL, (c) del_ra5, (d) del_r6, (e) del_r7, (f) del_a6, (g) del_a7 |