

1 引言
2 研究区域与数据
2.1 研究区域
2.2 数据来源
表1 用于降水降尺度的预测因子与目标变量概述Table 1 Overview of predictor and target variables for precipitation downscaling |
| 变量 | 数据来源 | 空间分辨率 | |
|---|---|---|---|
| 预测因子 | 温度/K | ERA5 | 2°×2° |
| 比湿/(g·kg⁻¹) | ERA5 | 2°×2° | |
| 经向风/(m·s⁻¹) | ERA5 | 2°×2° | |
| 纬向风/(m·s⁻¹) | ERA5 | 2°×2° | |
| 位势高度/gpm | ERA5 | 2°×2° | |
| 高程/m | GEBCO | 500 m | |
| 预测目标 | 降水/mm | GPM IMERG | 0.1°×0.1° |
3 方法介绍
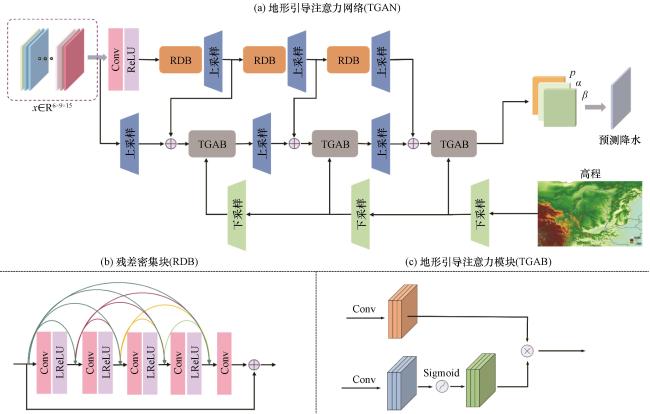
3.1 地形引导注意力网络(TGAN)
3.2 损失函数
4 结果
4.1 降水指标评估
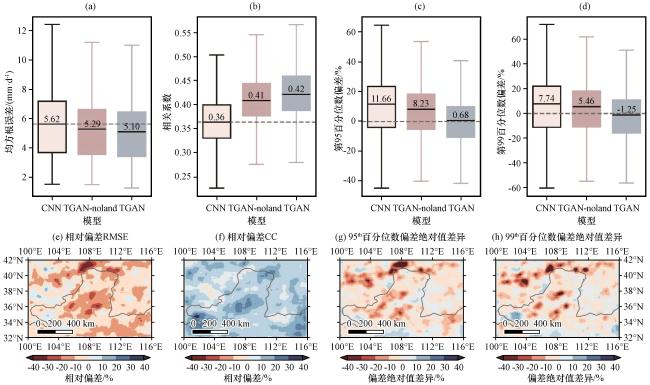
图2 降水降尺度模型在2011 -2020年黄河中游地区日降水模拟中的性能评估 (a)日降水均方根误差(RMSE, 单位: mm·d⁻¹)、 (b)相关系数(CC)、 (c)第95百分位数偏差(单位: %)、 (d)第99百分位数偏差(单位: %)的箱线图。其中, 箱体表示第25~75百分位数范围, 箱内黑色实线表示均值。灰色虚线在(a)和(b)中表示CNN的平均值, 在(c)和(d)中表示0%。误差线的上下界分别表示去除异常值后的最大值和最小值。(e)~(h)展示了TGAN相较于CNN在日降水RMSE、 CC以及第95百分位和第99百分位偏差(单位: %)的空间分布Fig.2 Evaluation of daily precipitation simulation performance of downscaling models over the middle reaches of the Yellow River (MRYR) from 2011 to 2020.(a) root mean square error (RMSE, unit: mm·d⁻¹), (b) correlation coefficient (CC), (c) bias (unit: %) of the 95th-percentile precipitation, and (d) bias (unit: %) of the 99th-percentile precipitation, presented as boxplots.The boxes represent the 25th–75th percentile range.The solid black line in the box indicates the mean value.The dashed gray line represents the CNN mean value in (a) and (b), while it represents 0% in (c) and (d).The upper and lower boundaries of the error bars represent the maximum and minimum values after removing anomalies, respectively.(e)~(h) show the spatial distributions of the differences between TGAN and CNN in daily precipitation RMSE, CC, and the 95th- and 99th-percentile biases (unit: %) |
表2 不同降尺度模型在2011 -2020年日尺度降水模拟中的平均性能指标及其相对于CNN模型的变化幅度Table 2 Average performance metrics of different downscaling models for daily precipitation simulations from 2011 to 2020 along with their relative changes compared to the CNN model |
| 时间尺度 | 模型 | RMSE/(mm·d⁻¹) | CC | 第95百分位数偏差/% | 第99百分位数偏差/% |
|---|---|---|---|---|---|
| 日 | CNN | 5.62 | 0.36 | 11.66 | 7.74 |
| TGAN-noland | 5.29 (↓5.9%) | 0.41 (↑13.9%) | 8.23 (↓3.4%) | 5.46 (↓2.3%) | |
| TGAN | 5.10 (↓9.3%) | 0.42 (↑16.7%) | 0.68 (↓11.0%) | -1.25 (↓6.5%) |
括号中的数值表示相对变化百分比, ↑和↓分别表示该指标相对于CNN模型有所提升或降低(values in parentheses indicate the percentage of relative change, where ↑ and ↓ denote an increase or decrease of the corresponding metric relative to the CNN model, respectively) |
表3 不同模型在月尺度和年尺度降水模拟中的平均性能指标及其相对于CNN模型的变化幅度Table 3 Average performance metrics of different models for monthly and annual precipitation simulations along with their relative changes compared with the CNN model |
| 时间尺度 | 模型 | RMSE/(mm·d⁻¹) | CC |
|---|---|---|---|
| 月 | CNN | 1.21 | 0.75 |
| 月 | TGAN-noland | 1.13 (↓6.7%) | 0.76 (↑1.3%) |
| 月 | TGAN | 1.09 (↓9.9%) | 0.77 (↑2.7%) |
| 年 | CNN | 0.39 | 0.29 |
| 年 | TGAN-noland | 0.38 (↓2.6%) | 0.28 (↓3.4%) |
| 年 | TGAN | 0.36 (↓7.7%) | 0.31 (↑6.5%) |
括号中的数值表示相对变化百分比, ↑和↓分别表示该指标相对于CNN模型有所提升或降低(values in parentheses indicate the percentage of relative change, where ↑ and ↓ denote an increase or decrease of the corresponding metric relative to the CNN model, respectively) |
4.2 平均降水和极端降水
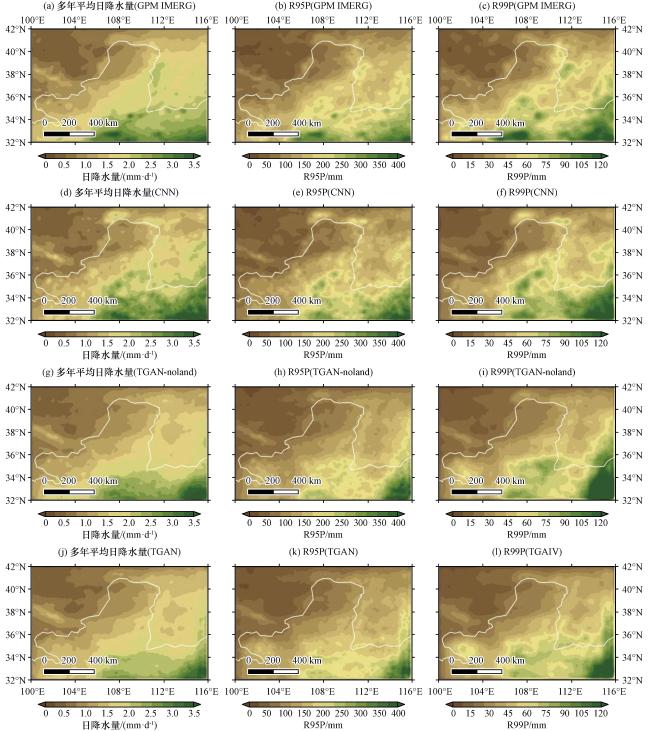
图3 2011 -2020年黄河中游地区GPM IMERG观测值(a~c)与CNN(d~f)、 TGAN-noland(g~i)和TGAN(j~l)模型的多年平均降水(左, 单位: mm·d⁻¹)及R95P(中, 单位: mm)、 R99P(右, 单位: mm)的空间分布特征Fig.3 Spatial distributions of multi-year average precipitation (left, unit: mm·d⁻¹), R95P (middle, unit: mm), and R99P (right, unit: mm) over the MRYR from 2011 to 2020, with (a~c) showing GPM IMERG observations, (d~f) CNN, (g~i) TGAN-noland, and (j~l) TGAN |
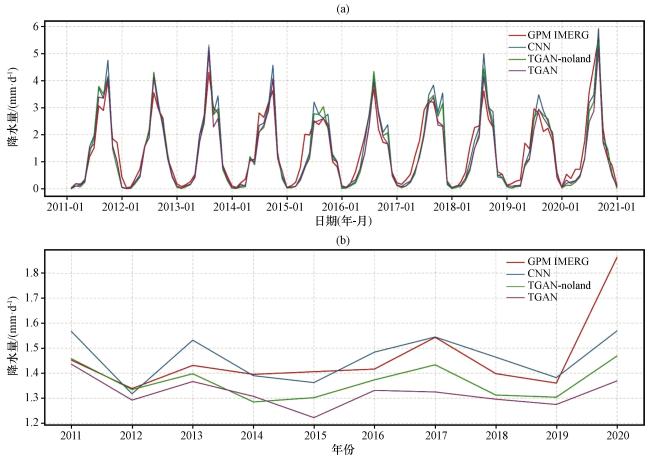
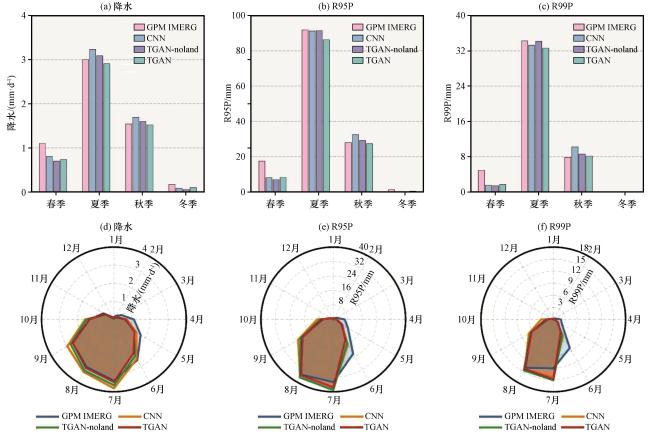
图5 2011 -2020年GPM IMERG与不同降尺度模型在黄河中游地区降水(单位: mm·d⁻¹)、 R95P(单位: mm)和R99P(单位: mm)的季节性(上)与月际变化(下)对比分析Fig.5 Comparison of seasonal (top) and monthly (bottom) variations in precipitation (unit: mm·d⁻¹), R95P (unit: mm), and R99P (unit: mm) over the MRYR from 2011 to 2020 for GPM IMERG and different downscaling models |
4.3 日降水的概率密度分布
5 讨论
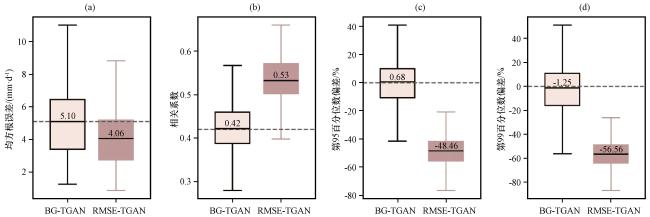
图7 2011 -2020年BG-TGAN和RMSE-TGAN在黄河中游地区日降水模拟中的均方根误差(a, 单位: mm·d⁻¹)、 皮尔逊相关系数(b, CC)以及第95百分位数和第99百分位数偏差(c, d, 单位: %)Fig.7 Root mean square error (a, RMSE, unit: mm·d⁻¹), pearson correlation coefficient (b, CC), and biases of the 95th and 99th percentiles (c, d, unit: %) in daily precipitation simulations over the middle reaches of the Yellow River from 2011 to 2020, obtained from BG-TGAN and RMSE-TGAN models |
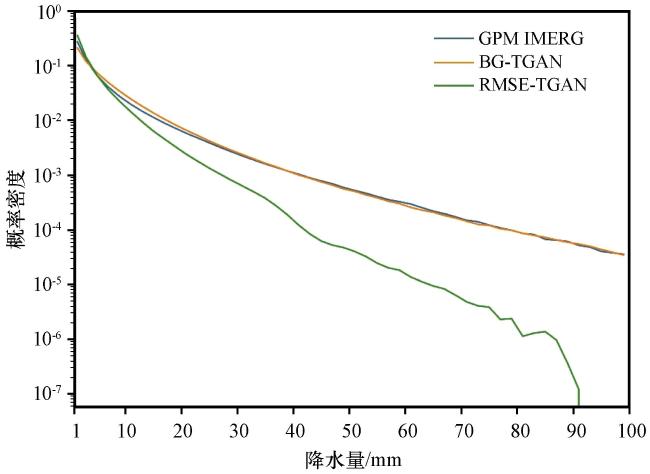
图8 2011 -2020年黄河中游地区BG-TGAN(橘色线)和RMSE-TGAN(绿色线)的模拟结果以及GPM IMERG观测数据的日降水量概率密度函数(蓝色线)Fig.8 Daily precipitation probability density functions along with GPM IMERG observations (blue line), the simulation results of BG-TGAN (orange line) and RMSE-TGAN (green line) over the MRYR from 2011 to 2020 |
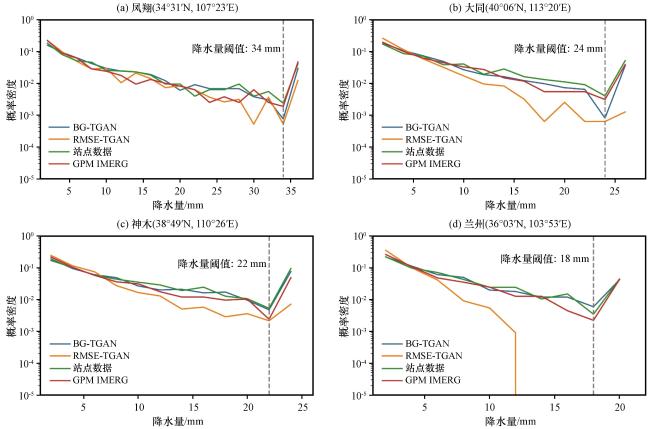


图9 2011 -2020年四个站点位置上的日降水量概率密度分布比较 灰色虚线表示覆盖 95% 降水事件的阈值, 超过该阈值的降水事件较为少见, 因此在统计时将其合并计算Fig.9 Comparison of daily precipitation probability density distributions at four station locations from 2011 to 2020.The gray dashed lines indicate thresholds covering 95% of precipitation events, events exceeding these thresholds are relatively rare and therefore aggregated in the statistics |