

1 引言
2 资料来源和方法介绍
2.1 个例选取
2.2 数据与处理
2.2.1 多源卫星遥感数据
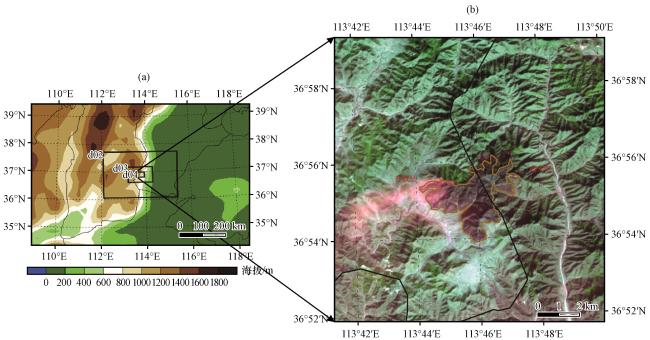
图1 模式嵌套示意图(a)和卫星遥感影像图(b)(a)为模拟区域和嵌套设置, 阴影区为海拔(单位: m); (b)为本研究区域2021年2月22日11:00高分一号卫星遥感影像, 黄色曲线圈出范围为过火区 Fig.1 Schematic diagram of model nesting and satellite remote sensing image.The left figure shows the simulation area and nesting setup, the shaded area is altitude (unit: m) (a); the right figure shows the Gaofen-1 satellite remote sensing image of this study area at 11:00 on February 22, 2021, the yellow curve is circled as the heavy overfire area (b) |
2.2.2 观测站点数据
表1 站点基本信息Table 1 Basic information of observations |
| 站名 | 站号 | 经度/°E | 纬度/°N | 海拔/m |
|---|---|---|---|---|
| 左权县羊角 | B6816 | 113.75° | 36.9° | 1226 |
| 武安朝阳沟 | B0229 | 113.81° | 36.92° | 902 |
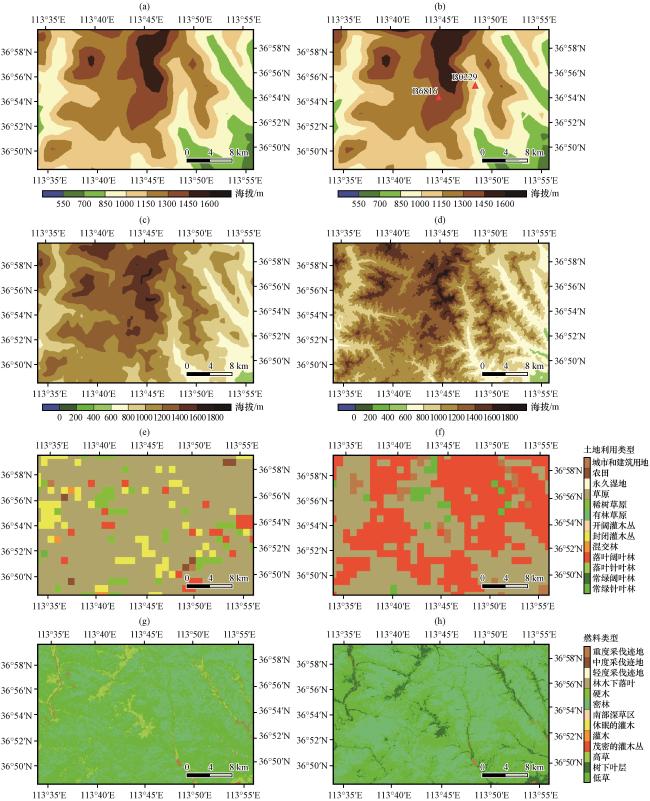
图2 d04区域原始(左)与更新后(右)的静态数据分布(a, b)为气象场海拔(单位: m), (c, d)为火场海拔(单位: m), (e, f)为土地利用类型分布, (g, h)为燃料类型分布 Fig.2 Distribution of original (left) and updated (right) static data for area d04.(a, b) shows the topography of the meteorological field (unit: m), (c, d) shows the topography of the fire field (unit: m), (e, f) shows the distribution of land-use types, and (g, h) shows the distribution of fuel types |
2.2.3 静态数据
表2 研究区可燃物基本信息Table 2 Basic information on combustibles in the study area |
| 类别 | 典型植被 | 负载量/(t·hm-2) | 可燃物层厚/cm | 引燃临界含水量/% | |||
|---|---|---|---|---|---|---|---|
| 1 h | 10 h | 100 h | 活可燃物 | ||||
| 1 | 低草 | 1.83 | 0.00 | 0.00 | 0.00 | 30.48 | 12 |
| 3 | 高草 | 7.44 | 0.00 | 0.00 | 0.00 | 76.20 | 25 |
| 5 | 灌木 | 2.47 | 1.24 | 0.00 | 4.94 | 60.96 | 20 |
| 8 | 密林 | 3.71 | 2.47 | 6.18 | 0.00 | 6.10 | 30 |
| 14 | 不可燃物 | 1×10⁻⁷ | 1×10⁻⁷ | 1×10⁻⁷ | 1×10⁻⁷ | 1×10⁻⁷ | 1×10⁻⁷ |
2.2.4 初始场与边界场数据
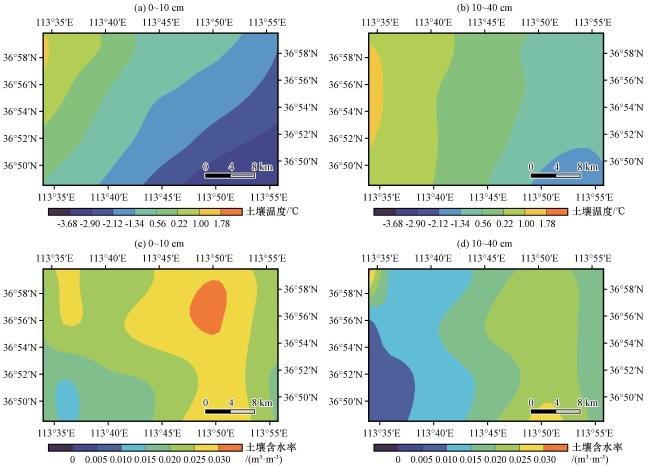
2.3 WRF-SFIRE模式设置
表3 模式网格设置Table 3 Grid settings for all domains |
| 嵌套层 | 网格数 | 水平分辨率 | 水平跨越/km | 时间步长/s |
|---|---|---|---|---|
| d01 | 34×22×40 | 27 km | 918 | 108 |
| d02 | 34×22×40 | 9 km | 306 | 36 |
| d03 | 34×22×40 | 3 km | 102 | 12 |
| d04 | 34×22×40 | 1 km | 34 | 4 |
| d04_火网格 | 1020×660×40 | 33 m | 34 | 1.33 |
2.4 试验方案
表4 7组试验方案Table 4 Description of the seven simulation experiments |
| 试验名称 | 气象场地形 分辨率 | 火场地形 分辨率 | 土地利用 分辨率 | 可燃物分辨率 | 初始土壤温湿度 | 边界层参数 |
|---|---|---|---|---|---|---|
| 控制试验: CTL | GDEMV3: 1s | GDEMV3: 1s | GLC_FCS30_2020: 1s | ESA_WorldCover: 1/3s | CLDAS | YSU |
| 试验1: TOPO_30s | gtopo2010: 30s | GDEMV3: 1s | GLC_FCS30_2020: 1s | ESA_WorldCover: 1/3s | CLDAS | YSU |
| 试验2: ZSF_30s | GDEMV3: 1s | gtopo2010: 30s | GLC_FCS30_2020: 1s | ESA_WorldCover: 1/3s | CLDAS | YSU |
| 试验3: LU_30s | GDEMV3: 1s | GDEMV3: 1s | MODIS: 30s | ESA_WorldCover: 1/3s | CLDAS | YSU |
| 试验4: FUEL_1s | GDEMV3: 1s | GDEMV3: 1s | GLC_FCS30_2020: 1s | GLC_FCS30_2020: 1s | CLDAS | YSU |
| 试验5: CMA-RA_st&sm | GDEMV3: 1s | GDEMV3: 1s | GLC_FCS30_2020: 1s | ESA_WorldCover: 1/3s | CMA-RA | YSU |
| 试验6: LES | GDEMV3: 1s | GDEMV3: 1s | GLC_FCS30_2020: 1s | ESA_WorldCover: 1/3s | CLDAS | LES |
加粗字体代表各试验方案中变化项(The bold font represents the variable intems in each test plan) |
3 结果分析
3.1 结果验证与评估
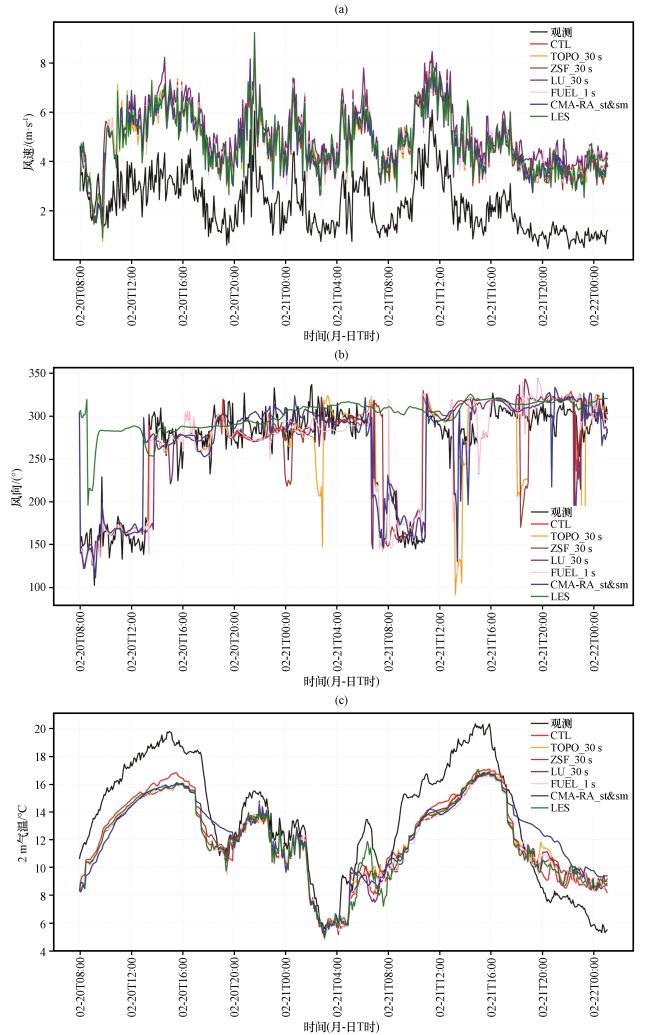
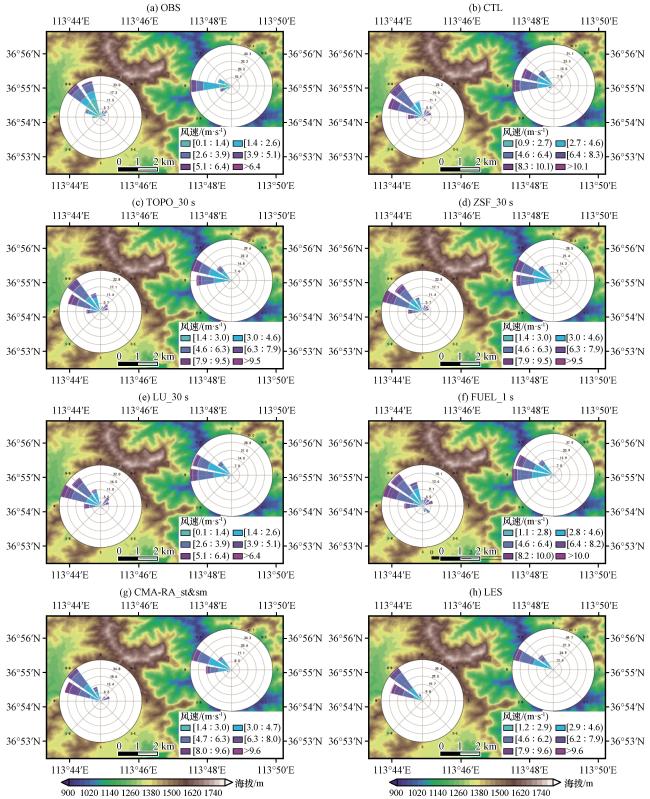
图5 不同试验方案的风玫瑰图(a)OBS为观测; (b~h)分别为7组敏感性试验。左下风玫瑰图站号为B6816; 右上风玫瑰图站号为B0229 Fig.5 Wind rose diagrams for different test scenarios.(a) OBS are observations; (b~h) are seven sets of sensitivity tests, respectively.The lower left wind rose diagram station number is B6816; the upper right wind rose diagram station number is B0229 |
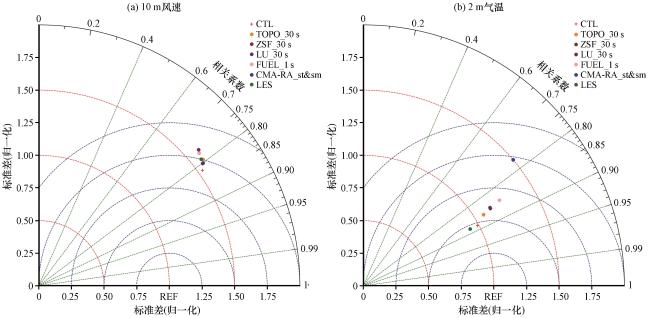
表5 不同试验方案模拟的10 m 风速、 风向和2 m气温平均误差Table 5 The average errors of 10 m wind speed, wind direction and 2 m air temperature simulated by different test schemes |
| 物理量 | 误差 指标 | 控制试验CTL | 试验1: TOPO_30s | 试验2: ZSF_30s | 试验3: LU_30s | 试验4: FUEL_1s | 试验5: CMA-RA_st&sm | 试验6:LES |
|---|---|---|---|---|---|---|---|---|
| 10 m风速 /(m·s-1) | MAE | 2.5458 | 2.5448 | 2.5583 | 2.9546 | 2.8705 | 2.5515 | 2.5659 |
| RMSE | 2.6420 | 2.6706 | 2.6718 | 3.0737 | 2.9952 | 2.6664 | 2.6911 | |
| 10 m风向 /(°) | MAE | 22.4869 | 28.6791 | 30.3404 | 27.1339 | 25.5300 | 26.5793 | 52.6760 |
| RMSE | 30.8597 | 48.3273 | 51.6697 | 42.2698 | 39.8973 | 36.0387 | 86.6076 | |
| 2 m气温 /℃ | MAE | 2.2803 | 2.4683 | 2.5547 | 2.5256 | 2.6134 | 2.7626 | 2.3754 |
| RMSE | 2.6282 | 2.7686 | 2.8471 | 2.8503 | 2.9611 | 3.0550 | 2.7053 |
粗体表示对各物理量影响较大的试验(bold text indicates experiments with significant influence on each physical quantity) |
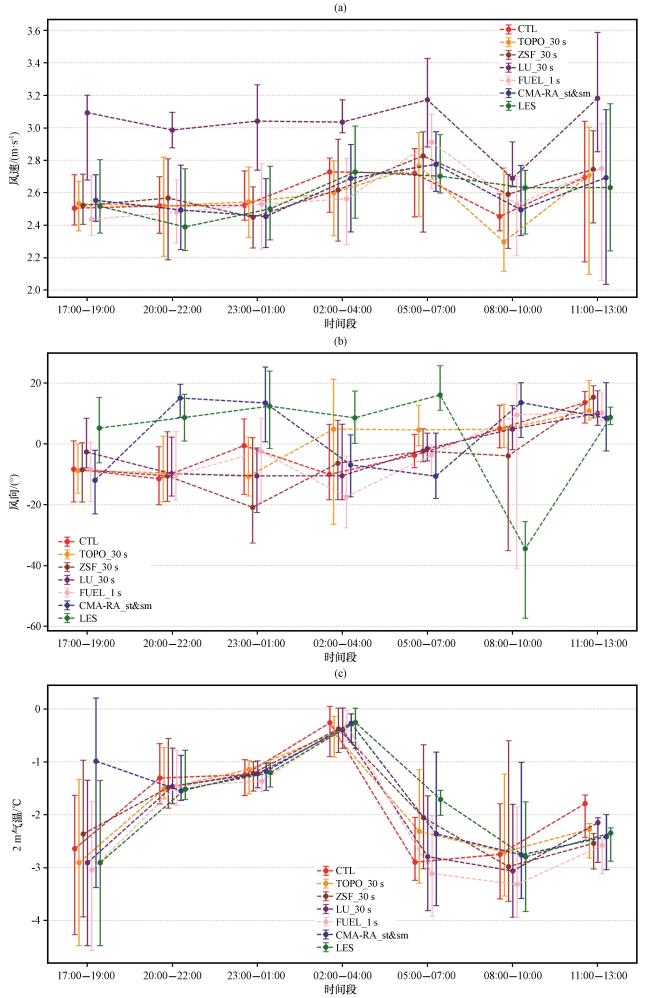
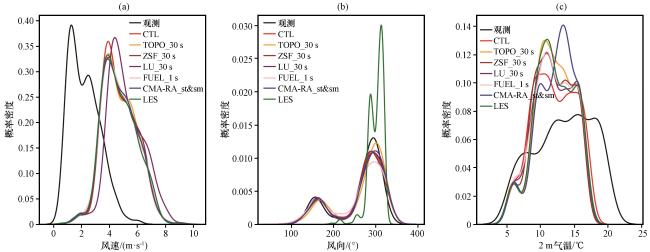
图8 不同试验的近地面风速(a)、 风向(b)和2 m气温(c)概率密度分布Fig.8 Probability density distribution of near-surface wind speed (a), wind direction (b) and 2 m air temperature (c) for different tests |
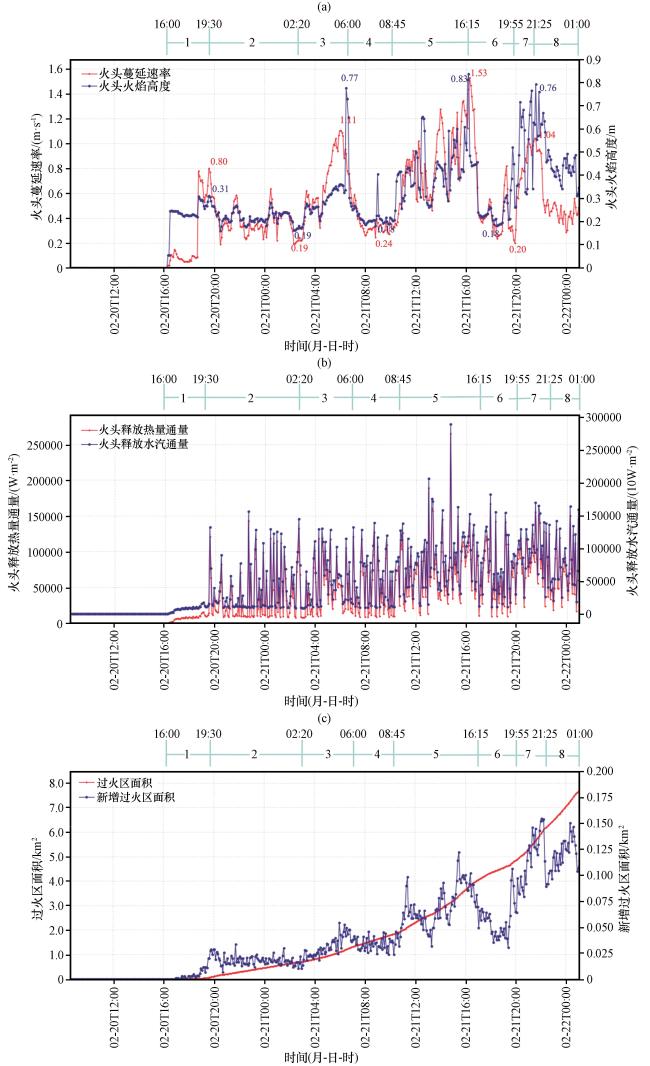
图9 林火蔓延特征变量时间序列(a)中红线代表火头蔓延速率(单位: m·s-1), 蓝线代表火头火焰高度(单位: m); (b)中红线代表火头释放的热量通量(单位: W·m-2), 蓝线代表火头释放的水汽通量(单位: 10 W·m-2), (c)中红线代表过火区面积(单位: km2), 蓝线代表新增过火区面积(单位: km2) Fig.9 Time series of variables characterizing wildfire spread.(a) the red line represents the rate of fire head spread (unit: m·s-1) and the blue line represents the flame height (unit: m), (b) the red line represents the heat flux released by the fire head (unit: W·m-2), and the blue line represents the water vapor flux released by the fire head (unit: 10 W·m-2), (c) the red line represents the area of overfire zone (unit: km2) and the blue line represents the area of additional overfire zone (unit: km2) |
3.2 林火蔓延模拟时空特征分析
3.2.1 林火蔓延模拟时间变化特征
3.2.2 林火蔓延模拟空间变化特征
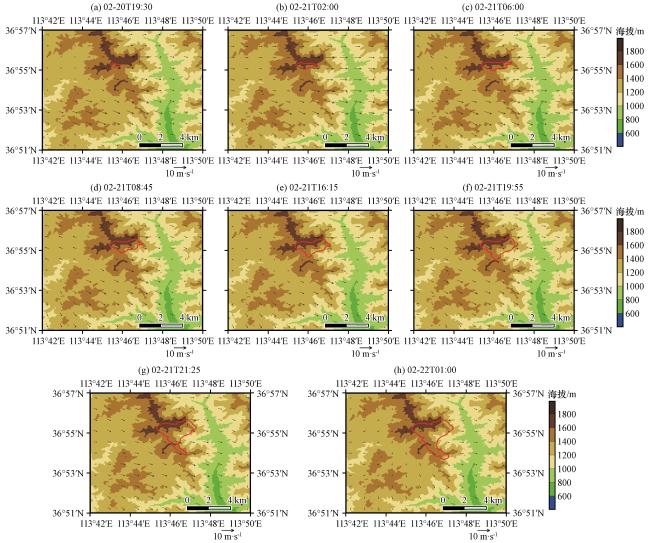
图10 林火蔓延不同阶段的空间分布变化(a)~(h)分别对应2021年2月20日19:30至22日01:00不同时刻的模拟燃烧区域(红色实线);图中叠加10 m高度风场, 阴影区为海拔(单位: m) Fig.10 Map of spatial variability at different stages of forest fire spread.(a)~(h) correspond to the simulated burning area (red solid line) at different moments from 19:30 on 20 to 01:00 on 22 February, 2021, respectively.The wind field at a height of 10 m is superimposed on the figure, the shaded area represents the altitude (unit: m) |
3.3 林火蔓延模拟敏感性分析
3.3.1 火场特征量统计
表6 不同试验燃烧最旺盛阶段火头处林火蔓延特征变量统计Table 6 Statistics on variables characterizing the spread of forest fires at the head of the fire during the most intense phase of burning in different experiments |
| 试验名称 | ROS_max/(m·s-1) | Length_max/m | HFX_max/(W·m-2) | QFX_max/(W·m-2) |
|---|---|---|---|---|
| 控制试验: CTL | 1.0346 | 0.3620 | 135562.40 | 12441.91 |
| 试验1: TOPO_30s | 1.3445 | 0.9236 | 140987.80 | 12939.86 |
| 试验2: ZSF_30s | 1.1186 | 0.5912 | 32346.03 | 12968.72 |
| 试验3: LU_30s | 1.9112 | 0.9265 | 157812.20 | 15306.00 |
| 试验4: FUEL_1s | 1.4363 | 0.8363 | 152130.20 | 13962.50 |
| 试验5: CMA-RA_st&sm | 1.4458 | 0.4074 | 300031.20 | 27536.85 |
| 试验6: LES | 1.0249 | 0.3492 | 127199.90 | 11674.40 |
ROS_max为火头处火线蔓延速率(单位: m·s-1); Length_max为火头处火焰高度(单位: m); HFX_max和QFX_max分别为火头处释放的感热通量(单位: W·m-2)和水汽通量(单位: W·m-2), 粗体表示对各物理量影响较大的试验[ROS_max represents the fireline spread rate at the fire front (unit: m·s⁻¹); Length_max represents the fireline height at the fire front (unit: m); HFX_max and QFX_max represent the heat flux (unit: W·m⁻²) and water vapor flux (unit: W·m⁻²) released at the fire front, respectively.Bold text indicates experiments with significant influence on each physical quantity] |
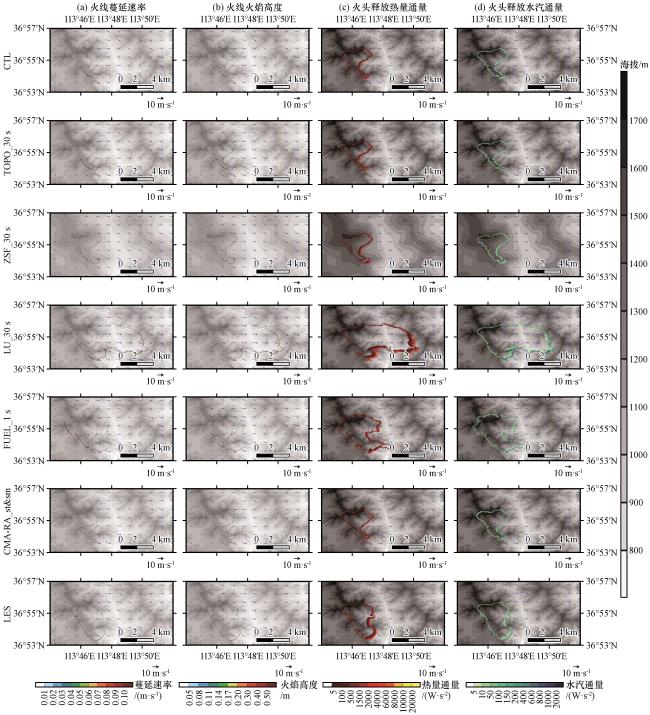
图11 不同试验燃烧最旺盛期林火蔓延特征变量空间变化(a)火线蔓延速率(单位: m·s⁻¹); (b)火线火焰高度(单位: m); (c)火头释放热通量(单位: W·m⁻²); (d)火头释放水汽通量(单位: W·m⁻²)。阴影区为海拔(单位: m), 叠加10 m高度风场 Fig.11 Spatial variation of forest fire spread characteristic variables in different experimental burning peak stages.(a) represent the fireline spread rate (unit: m·s-1); (b) represent the fireline flame height (unit: m); (c) and (d) represent the heat flux (unit: W·m-2) and water vapor flux (unit: W·m-2) released at the head of the fire, respectively.The shaded area represents the altitude (unit: m).Superimposed on the 10 m height wind field |
3.3.2 过火面积评估
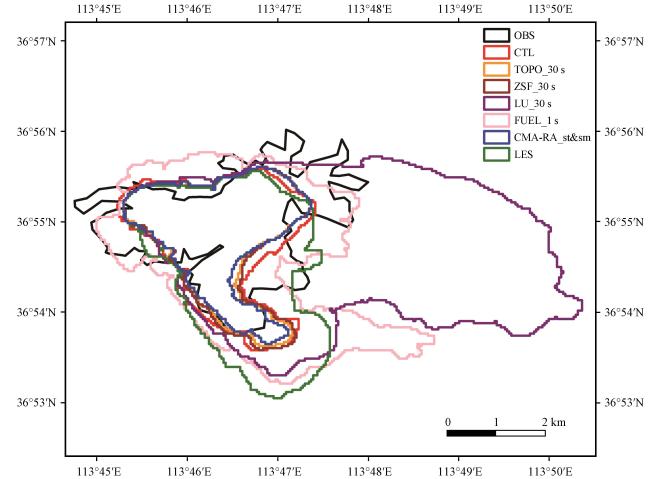


表7 不同试验过火面积的模拟精度评估Table 7 Evaluation of the simulation accuracy of overfire areas of different tests |
| 试验名称 | 模拟的 总面积/km2 | 重叠的 面积/km2 | 模拟过度的 面积/km2 | 模拟不足的 面积/km2 | KC | SC |
|---|---|---|---|---|---|---|
| 控制试验: CTL | 7.54 | 6.23 | 1.31 | 3.00 | 0.57 | 0.70 |
| 试验1: TOPO_30s | 6.44 | 5.57 | 0.87 | 3.36 | 0.55 | 0.69 |
| 试验2: ZSF_30s | 6.66 | 5.64 | 1.02 | 3.29 | 0.56 | 0.69 |
| 试验3: LU_30s | 20.82 | 6.53 | 14.29 | 1.4 | 0.30 | 0.51 |
| 试验4: FUEL_1s | 12.89 | 6.71 | 6.18 | 1.22 | 0.53 | 0.67 |
| 试验5: CMA-RA_st&sm | 5.10 | 4.39 | 0.71 | 3.54 | 0.54 | 0.68 |
| 试验6: LES | 9.30 | 5.44 | 3.86 | 2.49 | 0.47 | 0.63 |