
1 引言
2 研究区域与观测数据
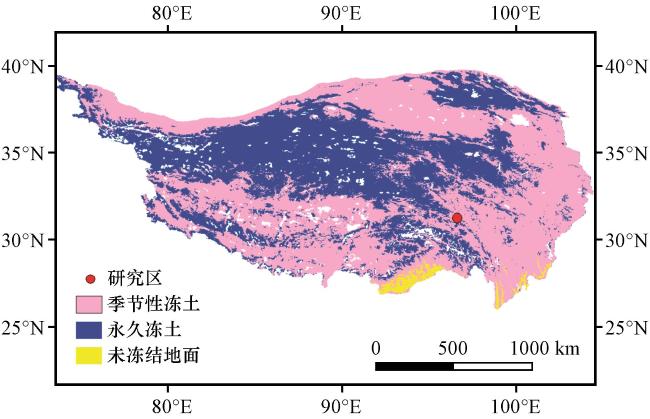
2.1 站点介绍
2.2 冻融过程和气象数据监测
2.3 研究方法与数据分析
2.3.1 降雨事件划分和特征分析
表1 降雨事件的降雨历时和降雨量特征Table 1 Characteristics of rainfall duration and rainfall amount of rainfall events |
| 降雨历时(H) | 降雨历时平均值/h | 场次/场 | 降雨量(P) | 降雨量平均值/mm | 场次/场 |
|---|---|---|---|---|---|
| 短历时(0 h<H≤6 h) | 2.50 | 137 | 小雨量(0.1 mm≤P≤9.9 mm) | 2.75 | 200 |
| 中历时(6 h<H≤24 h) | 12.10 | 90 | 中雨量(10 mm≤P≤24.9 mm) | 14.50 | 31 |
| 长历时(H>24 h) | 38.40 | 10 | 大雨量(P≥25 mm) | 31.92 | 6 |
表2 研究区不同冻融阶段的起止时间和持续时间(2020年4月至2021年12月)Table 2 Starting and ending time, duration of different freeze-thaw stages in the study area (April 2020 to December 2021) |
| 冻融阶段 | 划分依据 | 起止时间 | 持续时间/d | 降雨事件场次/场 |
|---|---|---|---|---|
| 冻结过程期 | 5 cm处土壤温度的日最低温度<0 ℃ | 2020年11月8日至2021年1月27日 | 81 | 3 |
| 2021年11月8日至2021年12月31日 | 54 | 3 | ||
| 完全冻结期 | 全土层日平均土壤温度≤0 ℃ | 2021年1月28日至2021年2月18日 | 22 | 1 |
| 融化过程期 | 5 cm处土壤温度的日最高温度>0 ℃ | 2021年2月19日至2021年4月8日 | 49 | 11 |
| 完全消融期 | 全土层日平均土壤温度≥0 ℃ | 2020年4月20日至2020年11月7日 | 202 | 108 |
| 2021年4月9日至2021年11月7日 | 213 | 111 |
2.3.2 土壤温湿度变化状况分析
2.3.3 理论雨水温度的计算
3 结果分析
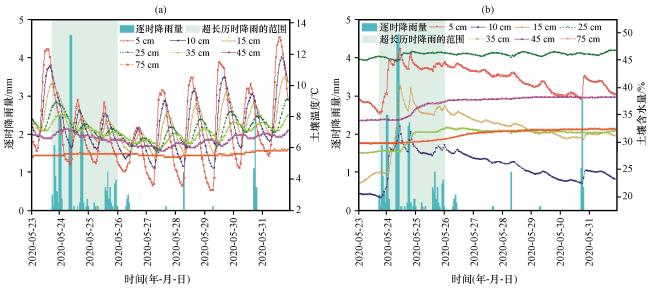
3.1 降雨历时对土壤水热的影响
表3 不同历时的降雨对土壤含水量的影响Table 3 Effects of rainfall of different duration on soil moisture content |
| 降雨历时(H) | 深度/cm | 土壤含水量增幅( )/% | 响应时间( )/h | 增加速率( )/(%·h-1) | 消退速率( )/(%·h-1) |
|---|---|---|---|---|---|
| 短历时(0 h<H≤6 h) | 5 | 15.50 | 7.50 | 3.34 | 0.51 |
| 10 | 7.70 | 8.50 | 1.80 | 0.22 | |
| 15 | 6.40 | 8.50 | 1.58 | 0.32 | |
| 25 | 4.05 | 8.50 | 1.00 | 0.17 | |
| 35 | 0.85 | 8.50 | 0.17 | 0.40 | |
| 中历时(6 h<H≤24 h) | 5 | 3.20 | 12.00 | 0.26 | 0.23 |
| 10 | 1.55 | 14.50 | 0.13 | 0.13 | |
| 15 | 1.60 | 14.50 | 0.81 | 0.19 | |
| 25 | 0.15 | 13.50 | 0.13 | 0.15 | |
| 35 | 0.20 | 13.00 | 0.01 | 0.08 | |
| 长历时(H>24 h) | 5 | 8.50 | 20.00 | 0.43 | 0.18 |
| 10 | 1.90 | 23.00 | 0.08 | 0.05 | |
| 15 | 0.40 | 20.00 | 0.02 | 0.06 | |
| 25 | 0.40 | 20.00 | 0.02 | 0.02 | |
| 35 | 1.20 | 9.00 | 0.02 | 0.02 |
3.2 降雨总量对土壤水热的影响
表4 不同降雨总量的降雨对土壤温度变化的影响Table 4 Effects of rainfall with different total rainfall amounts on soil temperature changes |
| 降雨总量(P) | 场次/场 | 深度/cm | 雨中土壤温度变化速率范围/(℃·h-1) | 雨中土壤温度变化速率均值/(℃·h-1) | R范围/% | R均值/% |
|---|---|---|---|---|---|---|
| 小雨量 (1.70 mm≤P≤9.80 mm) | 12 | 5 10 15 25 30 | -0.53~+0.60 -0.25~+0.65 -0.17~+0.33 -0.10~+0.14 -0.04~+0.08 | -0.07 +0.00 +0.00 -0.01 +0.01 | -72.12~+5.13 -49.28~+7.39 -75.00~+20.00 -93.23~+25.00 -28.57~+3.45 | -20.83% -25.40% -24.21% -18.69% -7.68% |
| 中雨量 (10.90 mm≤P≤13.60 mm) | 5 | 5 10 15 25 30 | -0.32~+0.48 -0.28~-0.14 -0.19~-0.11 -0.10~+0.10 -0.08~+0.07 | -0.13 -0.22 -0.15 -0.06 -0.00 | -45.6~+27.18 -49.03~+20.30 -33.35~+36.36 -23.89~+15.34 0.00~+33.33 | -9.79% -8.22% -7.03% -5.03% +5.60% |
“+”表示升温或速率增加,“-”表示降温或速率减小("+" indicates warming or an increased rate, while "-" indicates cooling or a decreased rate) |
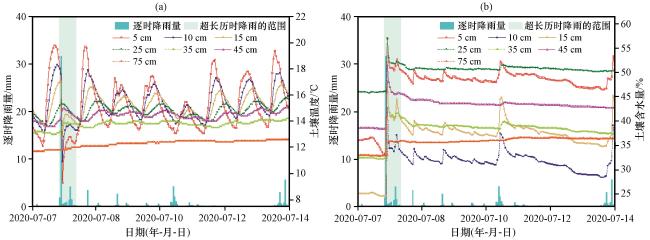
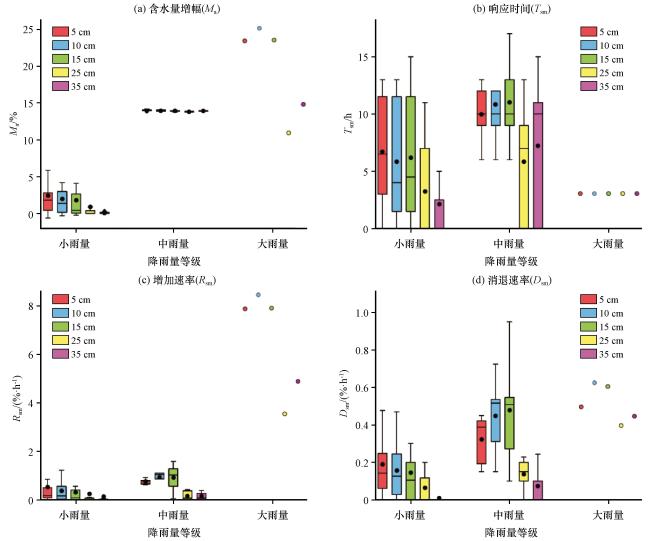
图4 不同降雨量的降雨对土壤含水量变化状况的影响箱线图箱子上下端分别为第25百分位数和第75百分位数; 上下端横线分别为第10百分位数和第90百分位数; 箱内横线代表中位数; ●代表平均值 Fig.4 Impacts of rainfall amount on soil moisture content variation.The upper and lower ends of the box in the boxplot represent the 75th and 25th percentiles, respectively, the upper and lower horizontal whiskers represent the 90th and 10th percentiles, respectively.The horizontal lines inside the box denote the median, the black dots (●) denote the mean value |
3.3 降雨发生时间对土壤水热的影响
表5 短历时小雨量的降雨事件对土壤温度和土壤含水量的影响Table 5 Impact of short-duration and light rainfall events on soil temperature and soil moisture content |
| 发生时间 | 场次/场 | 平均降 雨历时/h | 平均 雨量/mm | 深度/cm | 雨中土壤温度变化速率范围/(℃·h-1) | R范围/% | R均值/% | 范围/% | 平均值/% |
|---|---|---|---|---|---|---|---|---|---|
| 冻结 过程期 | 6 | 2.17 | 1.27 | 2.5 5 10 15 | -0.30~+0.98 +0.10~+0.50 +0.07~0.35 0.00~+0.18 | -31.58~+50.00 -58.04~-7.14 -66.67~-33.33 -70.15~0.00 | +1.32 -36.92 -53.34 -37.73 | 0.00~0.70 0.00~0.70 0.00~0.20 0.00~0.10 | 0.26 0.44 0.10 0.04 |
| 完全 冻结期 | 1 | 1.00 | 0.10 | 2.5 5 10 15 | +2.90 +0.80 0.00 -0.10 | +16.00 +14.29 0.00 0.00 | +16.00 +14.29 0.00 0.00 | 0.00 0.10 0.00 0.00 | 0.00 0.10 0.00 0.00 |
| 融化 过程期 | 15 | 2.13 | 0.92 | 2.5 5 10 15 | -0.70~+3.00 -0.60~+1.20 -0.30~+0.40 -0.10~+0.20 | -96.30~+22.73 -97.72~+22.54 -68.75~+8.57 -53.33~0.00 | -22.05 -17.06 -18.46 -10.87 | 0.00~3.60 0.00~2.10 -0.10~0.80 -0.10~0.90 | 1.15 0.67 0.13 0.16 |
| 完全 消融期 | 98 | 2.17 | 1.33 | 2.5 5 10 15 | -2.20~+2.78 -2.50~+1.70 -0.60~+1.20 -0.25~+2.00 | -90.00~+54.78 -72.22~+50.00 -71.45~+50.00 -83.33~+50.00 | -12.02 -12.17 -15.84 -15.47 | -0.30~10.20 -0.40~10.90 -0.40~3.20 -0.30~3.00 | 1.34 0.65 0.25 0.13 |
“+”表示升温或速率增加,“-”表示降温或速率减小("+" indicates warming or an increased rate, while "-" indicates cooling or a decreased rate) |
3.4 雨水温度对土壤水热的影响
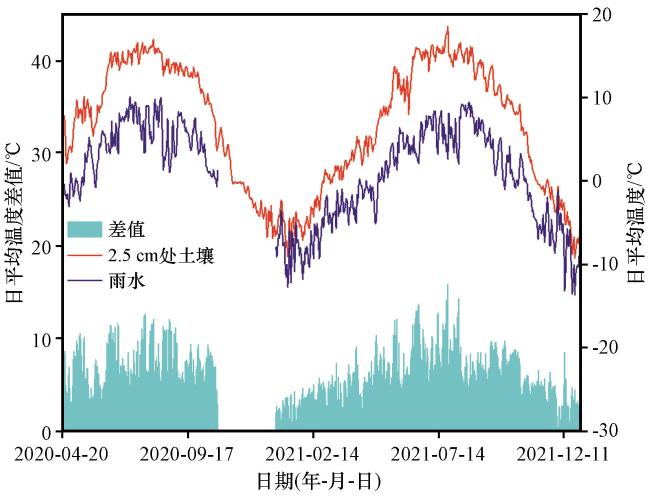
图5 理论日平均雨水温度和地表2.5 cm处土壤温度及其差值的变化Fig.5 Daily variations in mean theoretical rainwater temperature and 2.5 cm soil temperature, as well as their differences |