
1 引言
大气能见度是表征近地面大气透明度的关键指标, 其定义为视力正常者能识别目标物的最大水平距离。低能见度天气的形成是多个因素共同作用的结果, 包括气象条件、 地理环境、 人类活动等(苏维瀚等, 1986; 王淑英等, 2003; 傅刚等, 2009), 其直接影响着人们生产生活和交通运输安全, 如航班延误、 交通事故等, 对公众出行安全和社会经济运行造成严重威胁, 因此其精准预报对保障民生安全与社会经济运行具有重要意义(韩余等, 2022; 谢超等, 2024)。
能见度(Visibility, VIS)的客观预测方法目前主要为数值模式和传统统计方法。传统统计预报方法主要基于主观经验, 通过构建气象要素与能见度的线性回归方程来预测能见度, 如拟合率法、 多元线性回归、 多元动态逐步回归方法等(刘炳杰, 2010; 邢楠等, 2020; 赵翠光等, 2022), 但其依赖预设的函数关系框架, 难以精准刻画变量间复杂的非线性关联(白永清等, 2016), 且对历史样本外的天气场景泛化能力不足。在数值模式中的能见度预报通常通过云水含量、 湿度及降水等物理量诊断得出(Gultepe and Milbrandt, 2010), 而低能见度天气是大气边界层中, 动量、 热量、 水汽的湍流运动、 污染物累积等复杂过程的综合结果(谢超等, 2024), 且在不同区域、 不同季节、 不同天气背景下影响低能见度事件出现的气象要素不同, 其相关关系也不同(张霞等, 2024), 因此用固定的诊断方程预报不同区域、 时间的能见度时存在局限性, 使得数值模式的能见度预报准确率较低(赵翠光等, 2022)。
自20世纪80年代以来, 以人工神经网络和支持向量机(Support Vector Machine, SVM)为代表的人工智能方法因其强大的自学习和处理非线性问题的能力, 开始逐渐应用到数值预报产品释用及气象要素预报领域(张承福, 1994), 尤其在能见度预报这类非线性问题方面优势显著。马学款等(2007)通过动态学习率BP算法提升了浓雾预报准确率; 冯汉中等(2006)证实SVM模型预测的低能见度TS评分显著高于其自然频率; 郑朝霞等(2016)构建的霾识别SVM分类模型, 正样本TS评分超0.65。李沛等(2012)通过“分类+优化”的逐级建模方法增强人工神经网络模型的分类识别能力, 使能见度分级预报的准确率有较大的提升。然而, 这些早期人工智能方法存在明显短板, 人工神经网络采用梯度下降的局部搜索策略, 使其在面对复杂非线性问题时, 极易收敛到局部最优解, 稳定性不足制约了其业务应用(艾洪福和石莹, 2015; 马楚焱等, 2015)。而SVM对核函数的选取存在强烈依赖性(冯汉中等, 2006), 缺乏普适性参数配置, 预报值往往集中在一定范围内, 对能见度极值捕捉能力较弱(郑朝霞等, 2016), 另外SVM物理意义模糊, 难以解释低能见度形成机制, 限制了其泛化能力(朱蕾和朱国栋, 2010)。近10年来得益于计算能力的提升与大数据的支撑, 人工智能领域飞速发展, 集成学习作为机器学习领域的前沿方向, 成为研究热点。其核心思想是将多个基础学习器通过特定方式进行集成组合, 利用它们之间的优势互补, 以获取比单一模型更精准的拟合效果和更低的误差(Breiman, 1996, 2001), 相关算法在天气预报技术研究中得到了有效应用(贺倩等, 2022; 孙康慧等, 2024; 叶宇辰等, 2024)。其中LightGBM(Light Gradient Boosting Machine)作为高效的梯度提升决策树框架, 通过Leaf-wise树生长策略和直方图优化算法, 在处理高维非平衡数据时兼具精度与效率(Ke et al, 2017), 可满足实际业务应用高效的需求。余东昌等(2021)的对比试验表明, LightGBM对极端低能见度事件的捕捉能力优于传统神经网络; 基于LightGBM建立的能见度预报模型在京津冀、 华东、 华南、 豫南、 西南等地区均有较好的预报效果(王志宇, 2019; 余东昌等, 2021; 张庆等, 2024; 王璐璐和潭江红, 2024; 殷齐娥等, 2025)。另外, 高空、 地形、 污染物浓度等多源数据的加入可以让机器学习模型的能见度预报准确率显著提高(殷美祥等, 2023; 张庆等, 2024)。
机器学习模型在多种气象要素预测与订正任务中给出了较好的预测结果, 但预报员却难以分析这些复杂预测过程与客观事实的相符程度。而基于合作博弈论的机器学习模型可解释性框架SHAP(SHapley Additive exPlanations)可通过模拟特征的边际贡献, 实现对模型预测结果的全局与局部解释, 量化每个特征对模型预测结果的贡献(Lundberg et al, 2020; 王书苏等, 2025), 让机器学习从“黑箱预测”转向“可解释的物理建模”。目前, LightGBM算法在关中地区的能见度客观预报方面尚未得到实践与应用, 同时针对气象要素预报的模型SHAP可解释性分析研究也未开展。
关中盆地地处秦岭与黄土高原之间, 形成独特的半封闭“喇叭口”地形格局, 常年风速较小, 水汽与大气污染物积聚在近地表不易扩散(刘瑞芳等, 2017), 低能见度天气多发。本文利用多源数据对关中地区的低能见度天气特征进行统计分析, 筛选预报因子, 基于LightGBM方法构建陕西关中地区能见度分级预报模型, 实现能见度客观分级预报, 并通过结合LightGBM与SHAP解释模型, 更清晰地识别和理解关中地区低能见度天气的主要影响因素, 提高模型可解释性, 以期为关中地区低能见度天气的预报和服务提供科学依据。
2 数据来源与方法介绍
2.1 数据来源
本文用于特征统计分析及模型训练的数据为: 2022 -2024年陕西关中5个地市(西安、 咸阳、 宝鸡、 渭南、 铜川)共44个国家基本气象站(太白站与华山站为高山站不列入)的逐时常规地面观测资料(水平能见度、 气压、 气温、 露点温度、 风、 湿度、 变温、 变压等)及陕西省生态环境厅公布的关中五地市的环境空气质量监测数据(PM2.5、 PM10小时浓度值); 欧洲中期天气预报中心的全球气候第五代大气再分析数据集(ERA5)再分析资料, 时间分辨率为1 h, 空间分辨率为0.25°×0.25°, 垂直方向为1000 hPa、 950 hPa、 925 hPa、 850 hPa、 700 hPa、 600 hPa和500 hPa层的温度、 相对湿度、 比湿、 U风及V风数据。
用于模型检验的数据为2025年1 -3月的国家站水平能见度实况观测资料及欧洲中期天气预报中心数值模式预报(European Centre for Medium Range Weather Forecasts, ECMWF)每日08:00(北京时, 下同)为起报时刻, 未来48 h内逐3 h的预报数据, 中国雾-霾数值预报系统CUACE(CMA_Unified Atmospheric Chemistry Environment/Haze-Fog)的污染物浓度预报数据。本文涉及的地形图是基于国家测绘地理信息局标准地图服务网站下载的底图号为GS(2016)1609号的标准地图制作,底图无修改。
2.2 方法介绍
2.2.1 数据质控
数据是机器学习模型的“输入原料”, 其质量直接决定模型的效果。ERA5再分析资料及ECMWF模式等网格数据完整性较好, 但地面观测数据存在一定的缺失。针对地面观测数据的缺测值, 缺失时次在3 h以内, 通过相邻有效数据的算术平均值逐时次填充; 若连续缺失时次达到或超过4 h, 则将该时段标记为数据缺失状态, 不再进行插值处理, 避免数据缺失导致的补全偏差对数据分析的干扰。经过数据预处理后获得551773个样本用于模型训练。
2.2.2 模型特征选取
(1) 关中地区能见度时空特征
机器学习模型在气象预报问题上能否实现精准预测与可靠泛化, 核心在于能否深入理解并准确捕捉天气现象背后的物理规律(周康辉等, 2021)。本文利用关中地区44个国家基本气象站(太白站与华山站为高山站不列入统计)的大气水平能见度数据对其时空特征进行了初步分析。
2022 -2024年关中五地市能见度月变化特征整体一致[图1(a)], 在一年内均呈现出明显的单峰型特征, 即春末至夏季(5 -8月)能见度较高, 这得益于夏季较为频繁的降水和旺盛的对流, 其中6月能见度为峰值, 10月起明显下降, 秋冬季由于辐射逆温增强且大气污染物易累积, 能见度为一年内的低谷期, 关中五地市能见度均在2月达到最低。不同地市能见度差异主要集中在能见度较低的月份(1 -2月、 11 -12月), 其中西安能见度值最低, 咸阳次之, 其他三地市差异不明显。
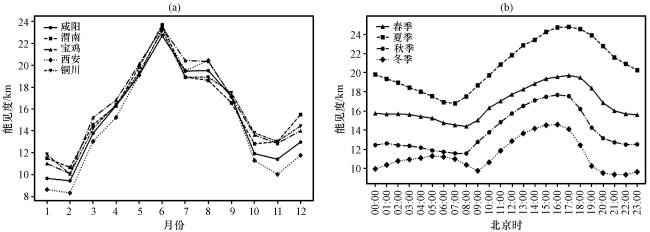
从关中地区气象站的能见度观测数据按季节分类并计算不同季节能见度的日变化[图1(b)]可看出, 不同季节日能见度大小排序为: 夏季>春季>秋季>冬季, 且均在早晨达到最低, 这是由于早晨有利于辐射雾的形成且夜间大气边界层高度较低有利于污染物的累积, 故在上午能见度平均值最低(傅刚等, 2009)。春夏秋三季一天中能见度最低值均出现在07:00 -08:00, 而后热力湍流逐渐加强且大气湿度下降, 能见度逐渐升高, 16:00 -17:00达到峰值, 18:00后能见度逐渐变差。与其他季节不同的是, 冬季能见度从22:00开始呈先上升再下降的趋势, 05:00出现一小峰值, 其可能原因是22:00至次日05:00是人类活动的“低谷”期, 交通流量和工业活动显著减少, 尽管夜间逆温层仍存在, 但大气污染物排放速率降至最低, 叠加夜间沉降作用, 颗粒物浓度逐渐降低(李星敏等, 2014), 故在00:00 -05:00大气能见度逐渐升高, 由此也可看出冬季大气污染物对能见度影响的占比较大。05:00 - 09:00能见度逐渐降低, 09:00能见度达到冬季一天中的最低值, 而后逐渐升高, 到16:00达到峰值后再降低。
从图2可以看出, 关中地区的低能见度发生频次分布有明显的地域性。整体来看, 海拔较高的地区出现低能见度的频次最高, 尤其是关中北部的长武-淳化-宜君-合阳一带, 这与地形和地理位置有关, 因从关中平原向北地势逐渐增高, 当关中平原盛行湿度较大的偏南(东南)风时, 风沿地形爬坡抬升, 水汽凝结易造成低能见度天气(张宏芳等, 2013)。而在海拔较低的平原地区, 咸阳城区、 渭南城区、 西安的周至出现低能见度的频次也较高, 主要原因其均是位于渭河沿岸, 河水的蒸发使得沿岸空气湿度较高, 同时盆地地形导致风速较小, 利于水汽聚集, 夜间至清晨时近地面空气冷却, 水汽易凝结造成低能见度天气(贺皓等, 2004)。
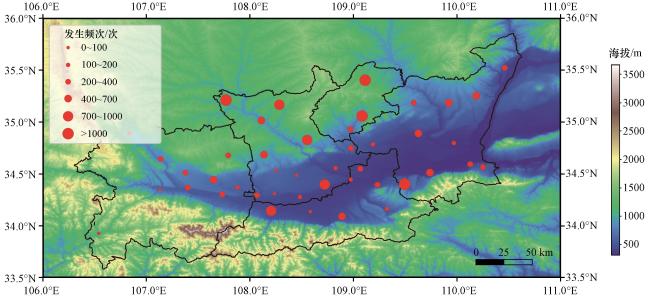
图2 关中地区海拔(填色, 单位: m)及2022 -2024年国家站能见度≤1 km发生频次空间分布图红色圆点中心为国家站, 其大小表示频次 Fig.2 The altitude (shading, unit: m) and spatial distribution of occurrence frequency that visibility ≤1 km at national stations in Guanzhong region from 2022 to 2024.The center of the red dot represents the position of the national station and the size represents the frequency |
(2) 特征选取
在机器学习算法确定的前提下, 数据特征工程的设计对提升模型准确率起着决定性作用。低层水汽含量、 大气稳定度、 地面冷却条件及低层悬浮颗粒物是影响近地面能见度的重要因素(丁一汇和柳艳菊, 2014; 张宏芳等, 2023)。本文选取了代表地面及近地层湿度的2 m温度露点差[(T-Td)2m]、 相对湿度(RH 2m), 1000~950 hPa的相对湿度; 代表大气扩散条件的风速(WS 10m), 1000~925 hPa的水平经向及纬向风(以下简称U、 V风); 反映地面辐射冷却强度的2 m温度(T 2m)及24 h变温(T 24h); 反映区域气压系统的演变趋势及层结稳定状况的海平面气压(Prs)、 3 h变压(P 3h)及24 h变压(P 24h)(李沛等, 2012; 林建等, 2008); 代表低层暖湿平流的1000~700 hPa的U、 V风, 温度及相对湿度(刘瑞芳等, 2017); 反映中层大气干冷平流(利于地表辐射降温)的600~500 hPa的U、 V风、 温度及相对湿度(王璐璐和谭江红, 2024); 影响关中地区能见度的重要大气污染物PM2.5及PM10浓度(李星敏等, 2014)。另外, 基于前期的统计分析, 关中的低能见度天气发生频次分布有明显的地域性和日变化特征, 故也选取了测站海拔(Alt)和整点时刻(hour)作为模型输入特征。综上共选取以下37个模型输入特征, 其中站号(station_ID)进行了编码处理, 见表1。
表1 模型输入特征选取Table 1 Selection of model input features |
| 分类 | 特征因子 |
|---|---|
| 地面 | T 2m、 (T-Td)2m、 RH 2m、 WS 10m、 T 24h、Prs、 P 3h、 P 24h、 PM 2.5、 PM 10 |
| 高空 | RH 1000、 RH 925、 RH 850、 RH 700、 RH 600、 RH 500、 T 1000、 T 925、 T 850、 T 700、 T 600、 T 500、 U 1000、 U 925、 U 850、 U 700、 U 600、 U 500、 V 1000、 V 925、 V 850、 V 700、 V 600、 V 500、 |
| 其他 | Alt、 hour、 station_ID |
2.3 模型建立方案
LightGBM是微软开发的高效梯度提升决策树框架, 采用Leaf-wise树生长策略、 直方图优化算法及Gradient-based One-Side Sampling(GOSS)等技术, 在保持高精度的同时显著提升训练效率, 尤其适用于处理高维、 非平衡数据场景(Ke et al, 2017)。本研究采用LightGBM构建能见度分级预报模型, 通过设置num_leaves、 max_depth等参数平衡模型复杂度, 并结合早停机制避免过拟合。
能见度为不连续的非正态分布变量(赵翠光等, 2022), 由于高能见度区间样本过大, 在使用回归方法时对小概率但高影响的低能见度事件存在低估。本研究将能见度(VIS)按表2进行分级处理, 将问题转化为多分类任务进行训练和预报。
表2 能见度分级Table 2 Visibility classification |
| 分级 | 能见度(VIS)/km |
|---|---|
| 0 | ≤1 |
| 1 | 1<VIS≤2 |
| 2 | 2<VIS≤5 |
| 3 | 5<VIS≤10 |
| 4 | >10 |
从前期分析中可知, 关中地区低能见度天气主要在秋冬季, 为强化训练样本中低能见度天气的代表性, 本研究选取2022 -2024年1 -3月及10 -12月的数据进行模型训练。在模型训练阶段, 运用网格搜索(Grid Search)方法进行超参数优化, 同时为提升模型的泛化能力并有效规避过拟合风险, 采用5折交叉验证(5-fold Cross-Validation)机制, 通过多次训练与验证迭代, 确保超参数优化结果的稳健性与可靠性。根据训练结果确定的最佳参数组合见表3。
表3 LightGBM能见度分级预报模型主要参数Table 3 Main parameters of LightGBM visibility classification forecasting model |
| 参数名称 | 参数值 |
|---|---|
| 提升迭代轮数/个 | 10000 |
| 叶子节点数/个 | 80 |
| 叶子节点最小样本数/个 | 20 |
| 学习率 | 0.05 |
| 树最大深度 | 15 |
| 提升类型 | gbdt |
| 特征采样比例 | 0.8 |
| 样本采样比例 | 0.9 |
2.4 SHAP方法介绍
尽管机器学习模型在预测性能上表现较好, 但难以解释其内部决策过程, 而基于合作博弈论框架的SHAP方法可通过分配特征的重要性值来解释模型的输出(王书苏等, 2025)。该方法通过计算特征变量的SHAP值, 系统评估各变量对模型预测结果的边际贡献效应(Lundberg et al, 2020)。具体计算公式如下:
式中: 表示第i个特征变量的SHAP值, 它代表该要素对能见度模拟结果的贡献; F为全特征变量集合, 代表预测模型函数; S为不包含目标特征i的任意特征子集; 分别为模型在包含特征i及子集S、 仅包含子集S时的能见度预测值, 二者差值表征特征i在特定特征组合下的边际影响; 权重项 通过组合数学原理, 对所有可能的特征子集进行等概率加权, 确保每个特征组合的贡献被公平量化, 即通过枚举所有不包含目标特征的子集, 逐次计算特征i加入前后的预测差异, 并按子集出现概率加权求和, 最终得到该特征对能见度预测的全局平均贡献。正值(负值)表明该气象要素对能见度模拟结果有正向(负向)影响, 从而实现对复杂模型中各变量影响的科学解释。
2.5 检验评估指标
本研究采用POD(Probability of Detection, 命中率)、 FAR(False Alarm Rate, 误报率)和TS评分(Threat Score)作为模型预报效果评估指标, 基于2×2列联表(包含命中次数Hits、 漏报次数Misses、 空报次数False alarms、 正确否定次数Correct Negatives 4类结果)量化能见度分级预报性能, 计算公式如下:
以上指标取值范围均为0~1, 其中POD反映模型对实际发生此类天气事件的检测能力, 为命中次数与实际发生事件数的比值; FAR用于衡量空报比例; TS数值越高表明模型对此类天气预报准确性越高; POD、 TS数值越高, FAR越低, 模型预报效果越好。
技巧评分SS(Skill Score)用于衡量对参考预报的改进程度, 通过参考预报与改进预报的准确性度量指标来计算(Wilks, 2020), 计算公式为:
选取TS作为准确性度量标准, 式(5) 中, A和A ref分别为目标模型和参考模型的TS评分; A perf为完美预报对应的TS评分值(即为1)。当SS>0, 说明目标模型对参考模型有正向订正效果, 且SS越趋近于1, 目标模型表现越优; 若SS<0, 则目标模型表现劣于参考模型。
3 结果及分析
3.1 模型预报效果检验
为了验证模型用于实际业务中在低能见度天气预报中的可用性, 使用2025年1 -3月关中地区的8次低能见度天气过程作为样本对模型进行检验。考虑到实际业务流程, 检验时用ECMWF模式每日08:00起报的未来72 h逐3 h气象预报数据及CAUCE模式每日08:00起报的污染物浓度预报数据通过双线性插值到站点, 提取与训练阶段一致的特征因子输入模型, 得到关中地区44个站点的未来72 h逐3 h能见度分级预报。利用站点能见度实况观测值进行模型检验, 并同步提取ECMWF模式直接输出的能见度预报数据进行对比检验。
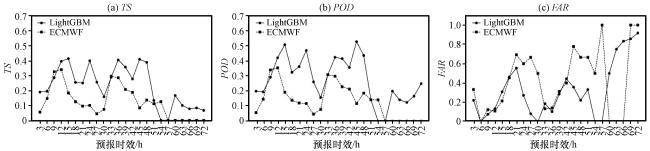
从图3可以看出, 在各个能见度分级中, LightGBM模型的预报效果较ECMWF均有较大提升。低能见度天气(VIS≤1 km及1<VIS≤2 km)预报的TS评分相比ECMWF预报分别提升了0.13和0.11; POD提升效果更好, 均提升了0.16; FAR分别下降了0.05和0.14。对比分析LightGBM模型及ECMWF对低能见度天气(VIS≤1km)的预报效果随预报时效的变化(图4)可看到, 在不同预报时效下, LightGBM模型对≤1 km低能见度天气的预报效果在多数预报时效下均要好于ECMWF。预报时效到54 h后, LightGBM的TS值大幅下降, ECMWF的TS值更是趋近于0, 两者POD值均降至较低水平且FAR值较高(虚警严重), 预报可靠性变差。根据前文分析结果可知, 关中地区低能见度天气多出现在夜间(20:00至次日08:00, 即预报时效为12~24 h、 36~48 h, 60~72 h), 计算得到在48 h预报时效内的夜间时段, LightGBM的TS值(0.355)较ECMWF(0.174)提升近104%, POD值为0.426(ECMWF为0.197), 可见LightGBM模型对夜间低能见度天气的捕捉与预报能力更具优势, 可为实际预报业务提供更可靠的支持。
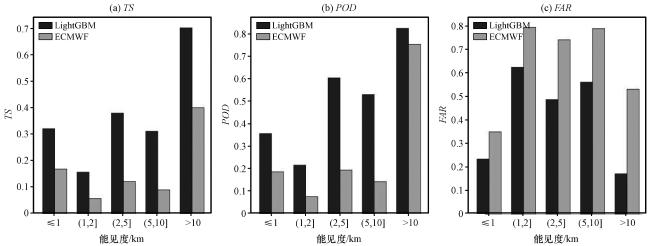
图3 LightGBM模型及ECMWF模式各等级能见度预报效果评估Fig.3 Evaluation of forecast performance for different visibility levels by LightGBM model and ECMWF |
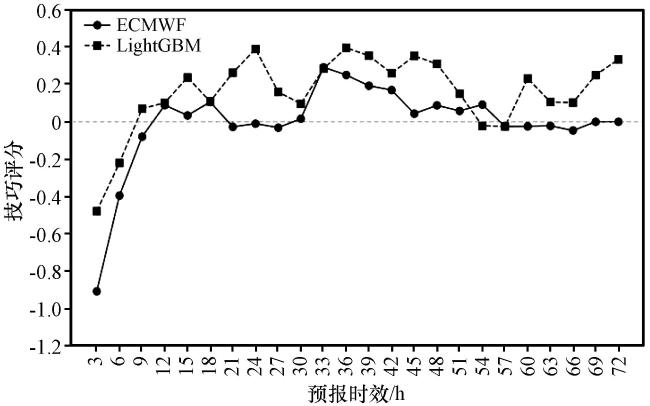
为量化模型对低能见度天气的预报增益, 引入持续性预报作为参考预报(即采用预报时效前实况值直接作为预报值), 并通过技巧评分评估ECMWF与LightGBM模型的实际预报功效。结果显示, 在低能见度(VIS≤1 km)预报中, ECMWF与LightGBM模型均表现出正技巧, 其中ECMWF的技巧评分为0.15, LightGBM的技巧评分为0.22。这表明两种模型均能有效捕捉低能见度天气, 且LightGBM模型的预报增益显著高于ECMWF模式, 进一步验证了其对低能见度事件的订正优化效果。图5为两种模型技巧评分随预报时效变化曲线: 预报初期(3~6 h), 两个模型对低能见度天气的技巧评分均为负值, 这是由于低能见度天气短时演变存在一定持续性, 这种固有属性本身使得持续性预报技巧很高。随着预报时效的增加(预报时效9 h后), LightGBM模型维持正技巧且均优于ECMWF模式, 体现了其对低能见度天气中长期演变规律的捕捉能力更优且更稳定。
3.2 基于SHAP的模型解释分析
本研究主要分析了各特征对模型预测低能见度(VIS≤1 km, 分级0)天气的影响程度。图6(a)为模型中各特征对低能见度(VIS≤1 km)样本预测影响程度(前20名)的条形图, 横轴为平均SHAP绝对值, 纵轴为不同特征, 平均SHAP绝对值越大, 表明对应特征对模型预测结果的影响越显著。从整个排名也可以看出低层的气象要素对低能见度天气预测的重要性较高, 前10名基本上均为850 hPa以下的特征要素, 其中(T-Td)2m其平均SHAP绝对值最大(超过2.0), 对能见度预测的影响最为关键, 是主导模型预测的核心要素; 其次为RH 2m湿度及T 2m, 同时PM2.5排名也靠前(第4名), 说明在关中地区低能见度预报中考虑污染物浓度非常必要, 大气中颗粒物一方面对光有散射和吸收作用, 能显著减弱光信号降低有效视距(李星敏等, 2014), 另一方面也能吸湿成为凝结核, 增加云雾滴降低能见度(张小曳等, 2013)。
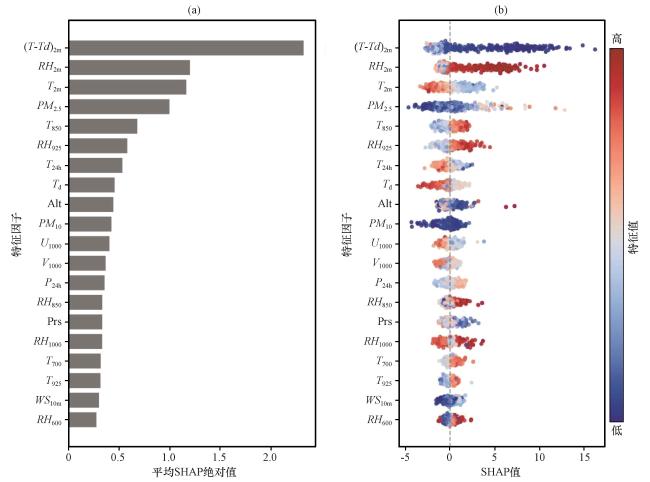
图6(b)为SHAP值依赖图, 用于展示各气象特征因子对模型低能见度预测的影响关系, 横轴(SHAP值)反映特征因子对能见度预测的影响方向与程度, 点的颜色表示特征值的高低, 蓝色代表特征值低, 红色代表特征值高。(T-Td)2m值偏低时, SHAP值分布较广, 表示其对能见度的影响显著, 且(T-Td)2m越低, SHAP值越大, 即对低能见度(VIS≤1 km)天气的正向影响更大, 即模型更倾向于预测低能见度天气的出现; 再如RH 2m值较高(红色点)时, SHAP值为正且其值越高, 说明高湿度会降低能见度, 与实际认知相符。整体来看, (T-Td)2m、 RH 2m、 T 2m、 PM2.5、 T 850为模型判断低能见度(VIS≤1 km)的关键影响因素(前5名)。其中, 高RH 2m、 T 850、 PM2.5和低(T-Td)2m、 T 2m有利于低能见度天气的出现。
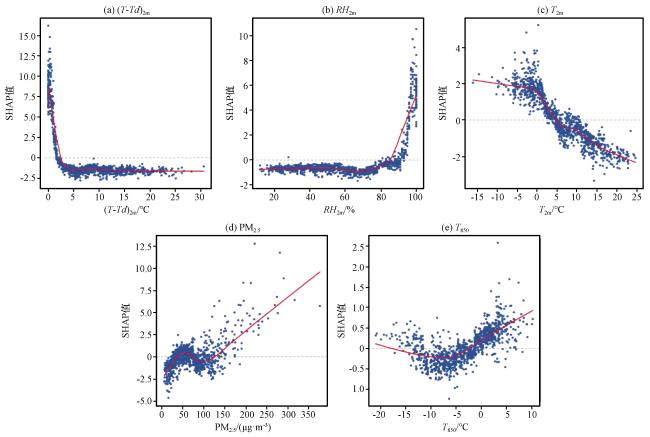
为了分析单个特征因子的取值如何影响模型的预测结果, 绘制了重要性前5名特征因子的SHAP依赖图(图7), 用于展示不同特征对VIS≤1 km预测的影响, 图中红色曲线为LOWESS(Locally Weighted Scatter plot Smoothing)拟合曲线, 展示了特征值与SHAP值间的趋势关系。能见度与这些特征因子并非只有简单的线性关系。具体来说, 地面高湿度环境是水汽凝结的核心驱动因子: (T-Td)2m特征值较小时, SHAP值较大[图7(a)], SHAP值随特征值的增加急剧下降并保持低位, 说明(T-Td)2m较小时, 尤其在其小于2 ℃之后, 对VIS≤1 km的预测有明显的正向影响, 值越小, 影响效果越明显, 较大时则产生负向影响, 这与辐射雾形成的临界湿度条件直接相关, 低(T-Td)2m表明近地面水汽接近饱和, 易触发凝结过程。RH 2m较低时, SHAP值接近0, 高湿度(>80%)时SHAP值急剧上升[图7(b)], 说明80%以上的相对湿度对模型预测VIS≤1 km天气有显著正向影响, 而低湿度时影响微弱。
T 2m的影响可近似为线性的[图7(c)], SHAP值随T 2m升高呈下降趋势, 表明T 2m越高, 对模型预测低能见度(VIS≤1 km)天气的负向影响越显著。较高的T 2m通常与太阳辐射的加热作用有关, 在秋冬季多出现晴朗、 干燥的天气, 不利于云雾的形成和污染物的积聚。SHAP值在PM2.5浓度较低时波动较大[图7(d)], 而后随PM2.5增大呈显著上升趋势, 表明低浓度时对模型预测的影响不明显, 高浓度时尤其在达到130 μg·m-3后对VIS≤1 km的预测有较强正向影响。这是由于PM2.5作为大气污染物, 低浓度时, 其他气象因素(如湿度、 温度)对VIS≤1 km预测的干扰较大, 导致SHAP值不稳定; 高浓度时(如重污染事件), PM2.5成为模型判断低能见度天气的主导因素。
T 850对低能见度天气的影响在不同温度区间呈现不同的方向和强度[图7(e)], 在其小于-5 ℃时SHAP值随T 850升高呈下降趋势, 但SHAP值为正的样本相对较少。而在其大于-5 ℃后, SHAP值随T 850升高呈上升趋势, 表明T 850越高, 对VIS≤1 km预测的正向影响越显著。T 850的升高反映了本地暖湿气流活跃: 一方面可输送水汽增加大气湿度(刘瑞婷等, 2014), 另一方面当地面温度较低时, 较高的T 850有利于逆温层的出现和维持, 如在秋冬季冷空气间歇期, 若有弱暖湿气流北上(T 850相对升高), 与近地面冷空气配合, 有利于逆温层的建立、 维持并出现雾或霾天气(李江波等, 2007; 李美琪等, 2020)。
4 结论与讨论
本研究基于陕西关中地区44个国家基本气象站地面观测数据分析得到的关中地区低能见度天气的时空特征及形成的关键因子, 从地面气象要素、 ERA5高空再分析数据、 环境监测站污染物浓度中筛选出37个特征变量, 利用LightGBM算法构建关中地区国家站能见度分级预报模型。通过输入ECMWF模式和CUACE模式的逐3 h气象要素及污染物浓度预报场, 实现关中地区国家气象站未来72 h的能见度分级客观预报。选取了2025年1 -3月出现的8次低能见度过程对模型进行独立检验, 重点评估其对不同等级能见度的预报准确率及对低能见度事件的捕捉能力。同时, 引入SHAP可解释性框架, 对模型输入特征开展特征重要性分析与贡献解析, 得出以下主要结论:
(1) 关中地区能见度在秋冬季为一年内的低谷期, 五地市能见度均在2月达到最低, 其中西安能见度值最低, 咸阳次之, 其他三地市差异不明显。各季节能见度均在早晨达到最低值, 春夏秋三季能见度最低值出现在07:00 -08:00, 而冬季大气污染物对能见度影响占比更大, 其能见度从22:00开始呈现特殊的“先升后降”趋势, 并在05:00出现小峰值, 09:00达最低。关中地区低能见度发生频次分布具有显著地域性, 地形爬坡抬升作用与局地水汽条件共同影响关中地区低能见度的空间分布差异。
(2) LightGBM模型在各个能见度分级中, 其预报效果较ECMWF模式均有较大提升, 低能见度天气(VIS≤1 km)预报的TS、 POD评分相比ECMWF预报分别提升了0.13和0.16。在48 h预报时效内低能见度事件多发的夜间时段, LightGBM的TS值(0.355)较ECMWF(0.174)提升近104%, POD值为0.426(ECMWF为0.197), 且随着预报时效的增加(预报时效9 h后), LightGBM维持正技巧且均优于ECMWF模式。可见LightGBM作为数据驱动模型, 能深度挖掘历史数据, 解析更深层次的非线性关系, 能识别到更多实际发生的低能见度事件, 大幅降低漏报风险, 同时能捕捉到夜间低能见度的关键影响因子及变化机制, 对夜间低能见度天气的预报能力更具优势, 可为实际预报业务提供更可靠的支持。
(3) 模型在低能见度(VIS≤1 km)天气预测中, 低层的气象要素对低能见度天气预测的重要性较高, 其中(T-Td)2m对能见度预测的影响最为关键, 是主导模型预测的核心因素; 其次为RH 2m和T 2m, 同时PM2.5排名也靠前, 说明在关中地区低能见度预报中考虑污染物浓度非常必要。高RH 2m、 T 850、 PM2.5和低(T-Td)2m、T 2m有利于低能见度天气的出现。
(4) 不同特征的取值变化对模型预测低能见度(VIS≤1 km)天气的影响也不同。当(T-Td)2m<2 ℃后, 其值变化对模型预测的正向影响急剧增强, 同时RH 2m>80%后, SHAP值随湿度升高呈指数型上升, 可见在秋冬季, 湿度超过一定阈值后成为低能见度预测的关键判据。SHAP值随T 2m升高呈线性下降趋势, 体现出显著负向影响; 而T 850在不同温度区间对模型的贡献也不同, 当T 850>-5 ℃后, SHAP值随T 850升高而显著增大, 一方面反映了暖湿气流的水汽输送作用, 另一方面与近地面低温配合形成逆温层, 有利于低能见度天气的出现。PM2.5浓度较低时气象条件主导能见度, 高浓度污染时颗粒物的消光作用则成为低能见度预测的主导因素。可见模型中各特征通过湿度阈值触发、 不同温度场配置影响边界层、 污染物消光主导作用变化的多元机制共同影响低能见度预测, 其中(T-Td)2m、 RH 2m的非线性阈值效应与PM2.5的浓度临界值是模型决策的核心判据, 而地面与低层温度场的配置则通过动力-热力过程间接影响低能见度天气的出现与维持。
低能见度天气是气象条件、 大气污染物、 地形下垫面特征的复杂耦合结果, 而单一的气象或环境模式难以全面刻画其变化特征。机器学习方法可挖掘多种特征数据对低能见度天气的影响, 在其预报服务业务中具有较大的应用潜力。通过SHAP可解释性分析框架得到的特征阈值[如(T-Td)2m<2 ℃、 RH 2m>80%], 该阈值与气象学原理高度吻合, 为物理机制更好地融入机器学习模型提供了切入点。后续研究可基于微波辐射计、 风廓线雷达等高分辨率垂直观测数据, 捕捉边界层内更精细的温、 湿及湍流扩散等信息与低能见度天气的关系, 结合分析结果聚焦特征工程优化, 增强模型对边界层内物理过程的表征能力, 同时基于SHAP可解释性分析探索机器学习从“黑箱预测”向“物理可解释的智能预报”的转变, 从而进一步提升机器学习方法在气象预报中的准确性和可靠性。另外, 现有模型依赖的ECMWF模式和CUACE模式预报场的部分要素与实况的偏差较大, 未来可基于客观订正后的预报要素作为模型输入, 以提高低能见度天气的预报准确性和稳定性。