
1 引言
2 数据来源与方法介绍
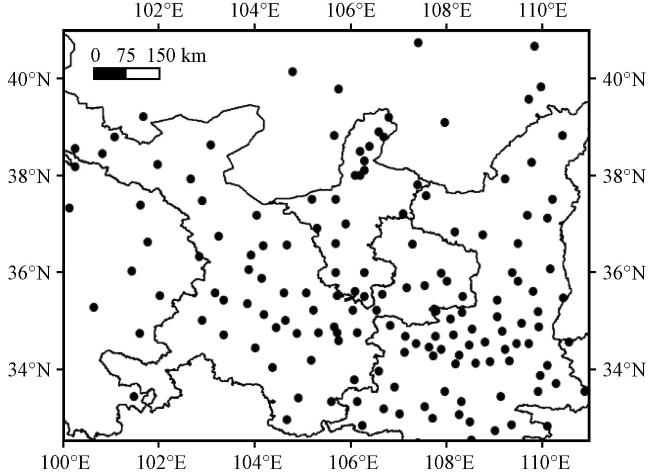
2.1 数据来源
2.2 研究方法
2.2.1 奇异值分解法(SVD方法)
2.2.2 “SVD投影”建模方法
2.2.3 检验评估方法
2.2.4 其他统计方法
3 结果分析
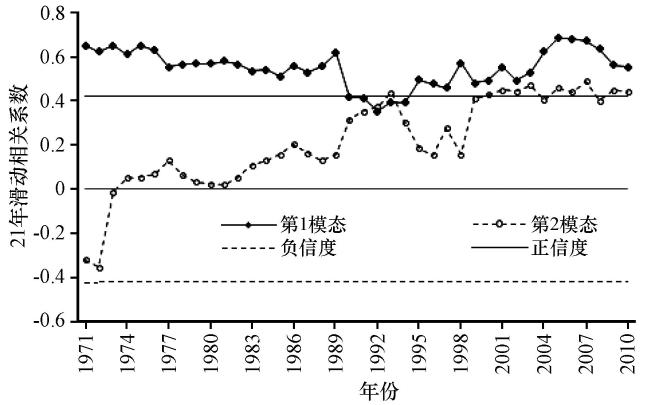
3.1 基于SVD方法选取的海冰关键区
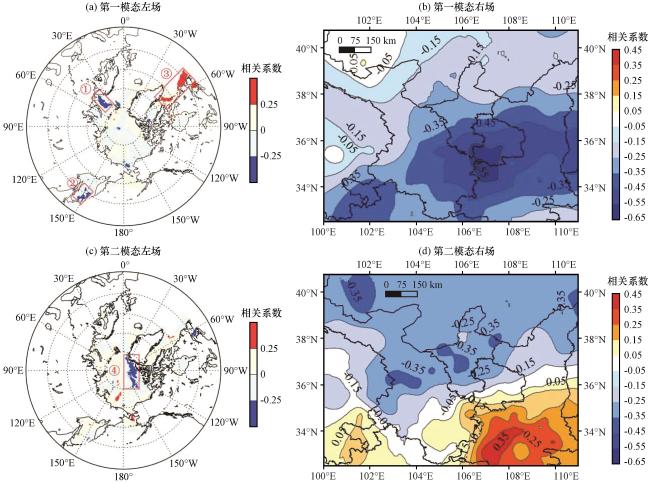
图2 春季(3 -5月)北极海冰密集度场与7月西北地区东部降水场的SVD异性相关系数 图(a)(c)中①、 ②、 ③、 ④分别表示第一、 二模态海冰关键区Fig.2 Hetero-correlation of SVD between spring sea ice density and precipitation in July over East of Northwest China.In Fig.2(a) and (c), the ①、 ②、 ③、 ④ indicates the first and second mode sea ice key areas, respectively |
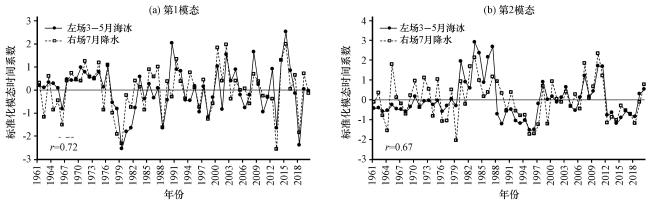
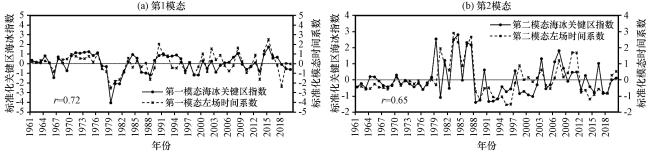
3.2 海冰关键区指数的确定
3.3 北极海冰对西北地区东部降水的可能影响分析
3.3.1 西北地区东部降水异常的环流机制分析
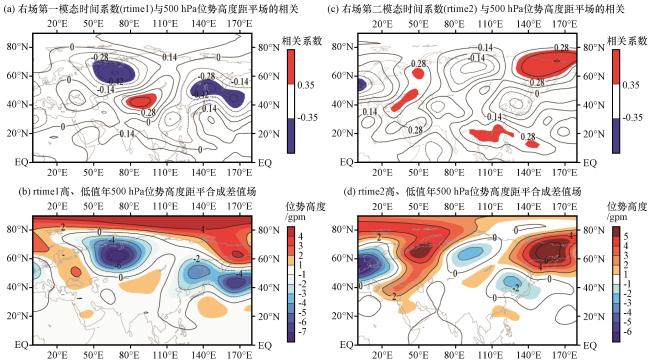
图6 1991 -2020年右场第一模态时间系数(rtime1, a)、 右场第二模态时间系数(rtime2, c)分别与500 hPa位势高度距平场的相关系数分布(等值线代表相关系数, 彩色区域代表通过了95%置信度检验)及rtime1(b)、 rtime2(d)高、 低值年500 hPa位势高度距平合成差值场(等值线和彩色区域, 单位: gpm)Fig.6 Distribution of correlation coefficients between rtime1 (a) and rtime2 (c) with 500 hPa geopotential height anomaly field respectively from 1991 to 2020 (contour represents correlation coefficient, the colore area represents passing 95% confidence level), and composite difference field of 500 hPa geopotential height anomaly (contour and color area, unit: gpm) in high and low value years of rtime1 (b) and rtime2 (d) |
3.3.2 海冰影响降水的可能途径
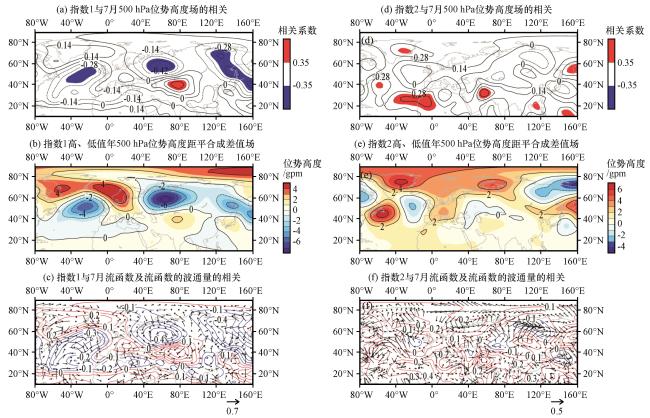
图7 1991 -2020年指数1(a、 c)、 指数2(d、 f)分别与7月500 hPa位势高度场(等值线代表相关系数, 彩色区域代表通过95%置信度检验)和7月流函数[等值线, 红(蓝)色表示正(负)值]及流函数的波通量(矢量)的相关, 指数1(b)、 指数2(e)高、 低值年500 hPa位势高度距平合成差值场(等值线和彩色区域, 单位: gpm)Fig.7 The correlation between index 1 (a, c) and index 2 (d, f) with the 500 hPa potential height field (contour represents correlation coefficient, the colore area represents passing 95% confidence level) and flow function [isoline, red (blue) lines represent positive (negative) values] as well as the wave flux of the flow function (vector), and composite difference field of 500hPa geopotential height anomaly (contour and color area, unit: gpm) in high and low value years of index 1 (b) and index 2 (e) of July from 1991 to 2020 |
3.4 预测模型的建立与检验
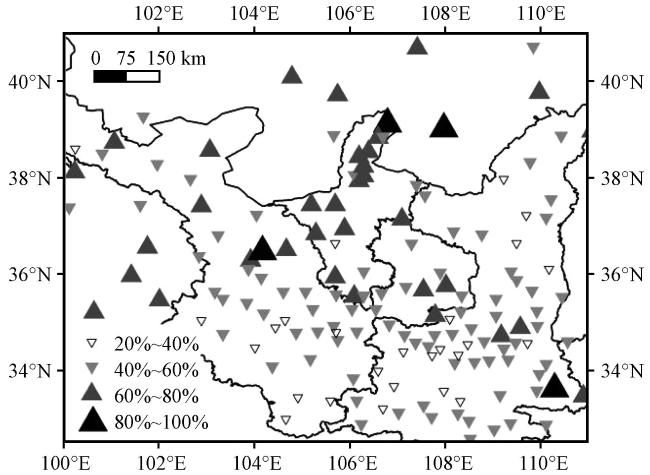
图8 2011 -2020年降水模型预测的距平符号一致率(PC)空间分布(单位: %)Fig.8 Spatial distribution of anomaly symbol consistency rate (PC) by precipitation prediction model from 2011 to 2020.Unit: % |
表1 2011 -2020年逐年降水模型预测水平检验Table 1 Capability test of precipitation prediction model from 2011 to 2020 |
| 年份 | 2011 | 2012 | 2014 | 2015 | 2016 | 2017 | 2018 | 2019 | 2020 |
|---|---|---|---|---|---|---|---|---|---|
| 降水分布型 | 北少南多 | 北多南少 | 以少为主 | 一致少 | 北多南少 | 北多南少 | 一致多 | 不典型 | 北少南多 |
| ACC | 0.17 | 0.51 | 0.56 | 0.31 | 0.22 | -0.01 | 0.04 | -0.02 | 0.07 |
| PC/% | 52 | 40 | 81 | 92 | 60 | 65 | 42 | 70 | 54 |