
1 引言
2 资料来源
3 结果与分析
3.1 2022年11 -12月京津冀气候异常特征
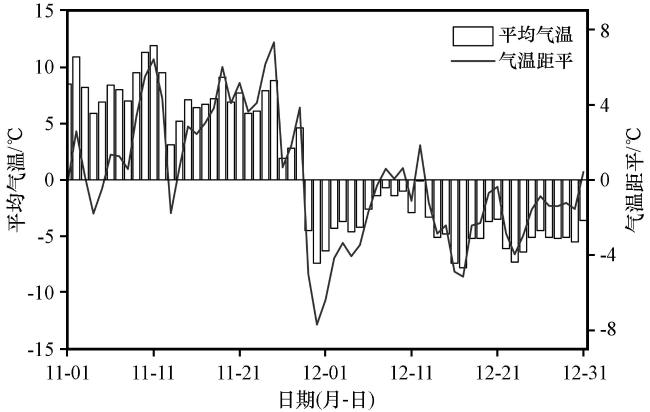
图1 2022年11 -12月京津冀地区日平均气温及距平变化Fig.1 Daily variation of mean temperature and its anomalies in Beijing-Tianjin-Hebei region from November to December in 2022 |
3.2 2022年11 -12月京津冀大气环流特征
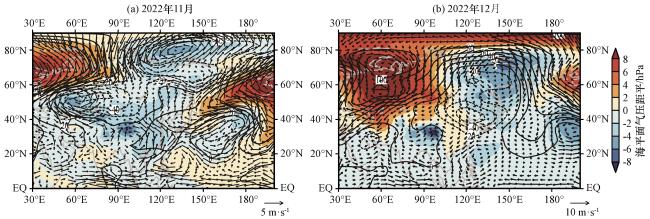
图4 2022年11月(a)和12月(b)的海平面气压距平(彩色区, 单位: hPa)、 500 hPa位势高度距平(等值线, 单位: gpm)和850 hPa风场距平(矢量, 单位: m·s-1) Fig.4 The sea surface pressure anomalies (color area, unit: hPa), 500 hPa geopotential height anomalies (contour, unit: gpm) and 850 hPa wind anomalies (vector, unit: m·s-1) for November (a) and December (b) in 2022 |
3.3 11月异常暖转12月异常冷4个典型年环流对比分析
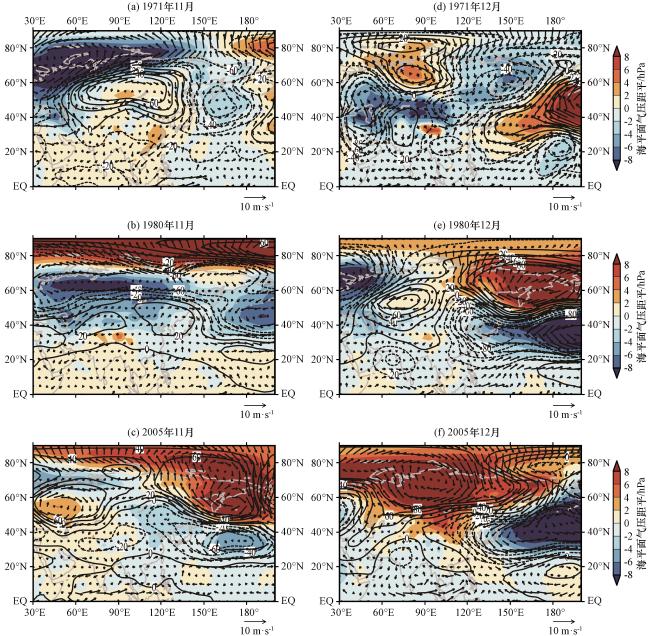
图5 海平面气压距平(彩色区, 单位: hPa)、 500 hPa位势高度距平(等值线, 单位: gpm)和850 hPa风场距平(矢量, 单位: m·s-1)(a)~(c)分别为1971年、 1980年、 2005年的11月; (d)~(f)分别为1971年、 1980年、 2005年的12月 Fig.5 Sea surface pressure anomalies (color area, unit: hPa), 500 hPa geopotential height anomalies (contour, unit: gpm), and 850 hPa wind anomalies (vector, unit: m·s-1).In Fig.5, (a)~(c) for November in 1971, 1980, and 2005, (d)~(f) for December in 1971, 1980, and 2005 |
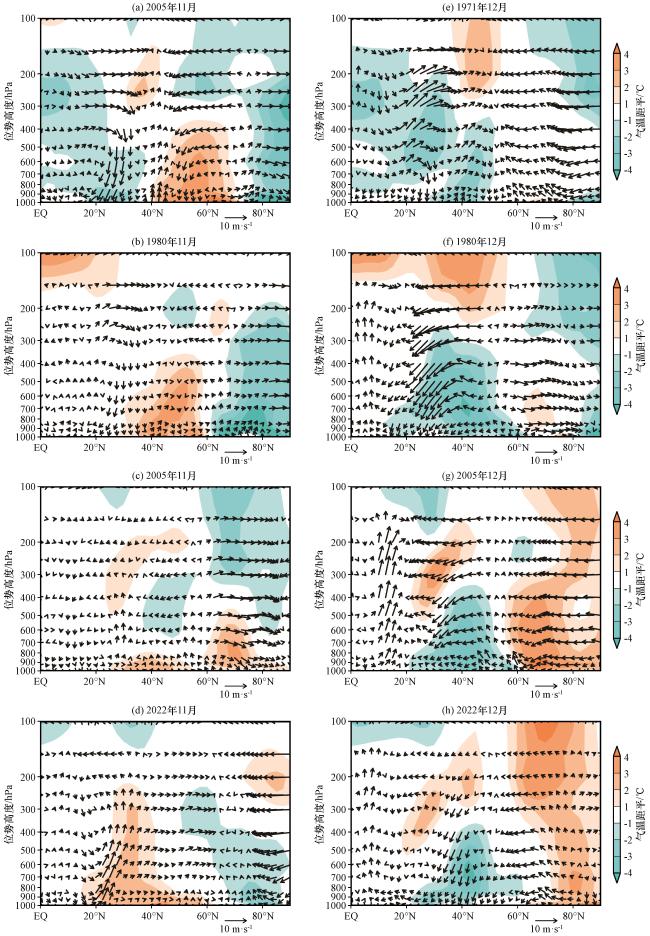
图6 113°E -120°E 范围平均气温距平(彩色区, 单位: ℃)和经向环流(矢量, 单位: m·s-1, 垂直速度扩大100倍)纬度-高度剖面(a)~(d)分别为1971年、 1980年、 2005年、 2022年的11月; (e)~(h)分别为1971年、 1980年、 2005年、 2022的12月 Fig.6 Mean air temperature anomaly (color area, unit: ° C) and meridional circulation (vector, unit: m·s-1, vertical velocity expanded by 100 times) latitudinal altitude profile in 113°E -120°E area.In Fig.6, (a)~(d) for November in 1971, 1980, 2005, and 2022, (e)~(h) for December in 1971, 1980, 2005, and 2022 |
3.4 拉尼娜和北极涛动的综合影响
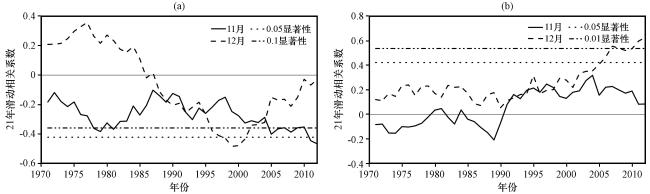
3.4.1 ENSO和AO与11月和12月气温相关性的年代际变化
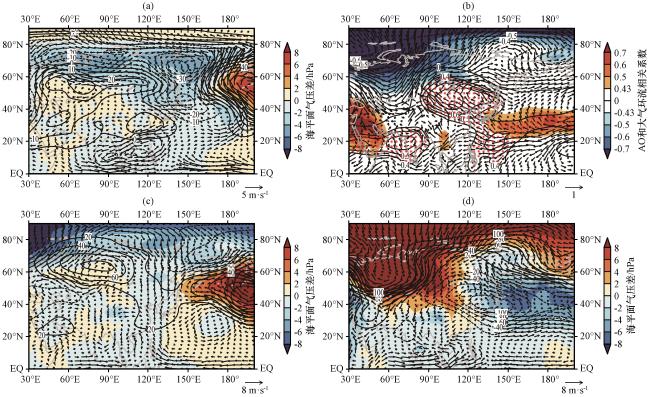
图9 2001 -2022年拉尼娜年和厄尔尼诺年11月的大气环流差值(a)、 12月AO和大气环流相关系数(b), 11月大气环流差值(c), 12月大气环流差值(d)(a, c, d)中彩色区表示海平面气压差(单位: hPa), 等值线表示500 hPa位势高度(单位: gpm), 矢量表示850 hPa风场差值(单位: m·s-1); (b)中打点区域代表位势高度场与AO通过了0.05的显著性水平检验 Fig.9 The differences (La years results minus El years results) of atmospheric circulation in November (a), the correlation coefficient between AO and air circulation in December(b), the atmospheric circulation difference in November (c) and December (d) during 2001 to 2022.In Fig.9 (a, d, d) the color area indicates sea surface pressure (unit: hPa), the contour indicates 500 hPa geopotential heigh (unit: gpm), the vector indicates the difference of 850 hPa wind field (unit: m·s-1).In Fig.9 (b), the doted area indicates geopotential heigh and AO have passed significance test at the 0.05 level |
3.4.2 拉尼娜和AO对京津冀2022年11 -12月气温转折的综合影响
表1 2001年以来拉尼娜年11月和12月AO指数、 气温距平表Table 1 AO indies and temperature anomalies in November and December La Ni a years since 2001 |
| La 年 | 11月AO 指数 | 12月AO 指数 | 11月气温 距平 | 12月气温 距平 |
|---|---|---|---|---|
| 2005 | 0.2277 | -2.1039 | 2.1 | -1.7 |
| 2007 | -0.5187 | 0.8211 | 0.0 | 1.4 |
| 2010 | -0.3757 | -2.6310 | 0.6 | 0.4 |
| 2011 | 1.4592 | 2.2208 | 1.5 | -0.6 |
| 2017 | -0.0776 | -0.0590 | -0.7 | 0.6 |
| 2020 | 2.0864 | -1.736 | 0.7 | -1.6 |
| 2021 | 0.0930 | 0.1981 | 0.9 | 2.0 |
| 2022 | 0.3389 | -2.7192 | 1.9 | -2.0 |
加粗字体表示AO由11月正位相转为12月负位相的拉尼娜年(The bold font indicates La Niña years in which the AO changes from positive phase in November to negative phase in December) |