Not found 
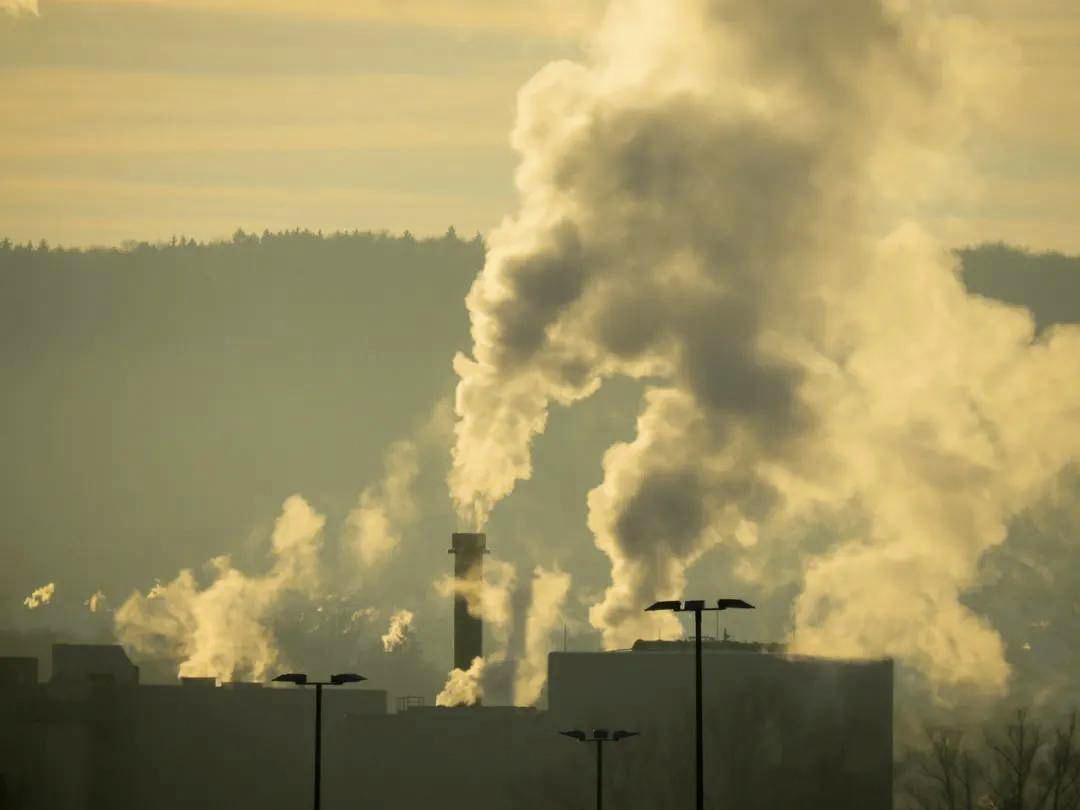
Aerosol optical effects

The source of atmospheric aerosol is very complex, most of which have strong pollution, so it has attracted extensive attention from the academic circles at home and abroad. However, due to the uncertainty of atmospheric aerosol in practice and space, it is difficult to observe and study, so there is still a long way to go to observe and study its physical and optical properties.

Default Latest Most Read  
Please wait a minute...
For Selected: Toggle Thumbnails
  • An Overview of the Aerosol and Cloud Properties and Water Vapor Budget over the Qinghai-Xizang Plateau
  • HUANG Jianping, LIU Yuzhi, WANG Tianhe, YAN Horngru, LI Jiming, HE Yongli
  • 2021, 40 (6): 1225-1240. DOI: 10.7522/j.issn.1000-0534.2021.zk012
  • Abstract (1465) PDF (49747KB)(1179)
  • Acting as the “Asian water tower”, the Qinghai-Xizang Plateau (QXP) can significantly influence the East Asian and global climate.This paper introduces some preliminary results of the Strategic Priority Research Program of Chinese Academy of Sciences (Grant No.XDA2006010301).Focusing on the Pan Third Pole centered by the QXP, the dominant results include: (1) Dust, polluted dust, elevated smoke and polluted continental aerosols are the most important types over the Pan-Third Pole region.Among them, the dust emission and transport can significantly affect the atmospheric thermodynamic structure over the western QXP and the Qaidam Basin.(2) The occurrence frequency of supercooled water clouds and its role in adjusting the energy budget are greater than those of warm water clouds over the QXP.Precipitation is mainly produced by ice clouds and mixed phase clouds, especially in warm season.Although the QXP is warming and wetting, the water vapor arriving from outside the QXP could not effectively replenish the surface water storage, the water cycle over the eastern part of the QXP shows a weakening trend, while the one over the western part indicates opposite trend.(3) Due to the black carbon (BC), a weak South Asian Summer monsoon is induced, leading less water vapor transported from the Indian Ocean to the QXP.Besides, BC addition can induce an intensified East Asian Summer monsoon significantly, consequently, more water vapor is transported from the east of QXP.Overall, due to the BC, the net water vapor is positive over the QXP, implying a net import of water vapor from the surroundings to the QXP.The eastward movement of convective clouds polluted by dusts over the QXP can merge with the local cloud clustering, leading to an intensified precipitation in the Yangtze River Basin and North China.In general, aerosols can directly affect radiation, or indirectly change the macro and micro characteristics of clouds by acting as cloud condensation nuclei, or by affecting the thermal structure required for cloud formation, thereby further affecting the surface energy budget and atmospheric heating rate profile of QXP.And ultimately affect the circulation system and the water vapor budget of the plateau.Being some parts of the program, the research on above results is beneficial to reveal the physical mechanism of the QXP influencing the surrounding water cycle, to understand the mechanism of aerosol-cloud-interaction affecting the water cycle of TP.Additionally, it may provide some evidence and guidance for the improvement of the efficiency of air water resources development and utilization.
  • Comparative Analysis of Aerosol Optical Properties in Typical Regions of Mineral Dust and Salt Dust
  • Yixuan CHEN;Tianhe WANG;Ying HAN;Hanyang QIAO;Mengxian SUN;Zhongwei HUANG
  • 2020, 39 (4): 859-869. DOI: 10.7522/j.issn.1000-0534.2019.00048
  • Abstract (833) HTML (14) PDF (6389KB)(160)
  • The combined decadal (2007 -2016) active (CALIOP/CALIPSO) and passive (OMI/Arua) satellite remote sensing aerosol products are used to compare and analyze the similarities and differences between the mineral dust and salt dust aerosol optical properties in three typical regions: Tarim Basin (mineral dust source), Iranian Plateau (transported dust region) and Aral Sea (salt dust source).The main results are as follows: (1) The monthly variations of column aerosol optical depth have similar patterns in three regions, the maximum of AOD in Tarim Basin and Aral Sea appear in April, while the Iranian Plateau occurs in summer; (2) The maximum occurrence frequency of aerosol in Tarim Basin and Aral Sea are both close to the ground, while Iranian Plateau concentrates on about 2~3 km above sea level.(3) The nonsphericity of transported dust in Iranian Plateau and salt dust in Aral Sea are both weaker than that of source-region dust in Tarim Basin, and the particle size of salt dust is significantly smaller than that of mineral dust, hence salt dust is identified as polluted dust by CALIOP.(4) The absorption capacity of salt dust in Aral Sea is comparable to that of the mineral dust in Tarim Basin, but slightly greater than transported dust in Iranian Plateau.
  • Global Spatial and Temporal Distribution of Aerosol Optical Depth for Different Kinds of Aerosols
  • ZHANG Zhijuan;CHEN Bin;JIA Rui;YI Yuhong
  • 2019, 38 (3): 660-672. DOI: 10.7522/j.issn.1000-0534.2019.00002
  • Abstract (683) PDF (16426KB)(414)
  • The spatial and temporal distribution of aerosol optical thickness for sulfate, black carbon, organic carbon, sea salt, dust, and total aerosols from 1980 to 2017 was analyzed using MERRA-2; six typical regions were selected to study the contribution of each type of aerosol to total aerosol optical depth. The results show that five types of aerosols are unevenly distributed globally and have seasonal variations; the global total aerosol optical thickness is the largest in summer (0.137), followed by spring (0.130), and the smallest in winter (0.118); in the six typical regions, the largest aerosol optical depth is in North Africa whose value is 0.43, followed by the eastern part of China, which is 0.41; the dominant types of aerosols in each region are different, in North America, Eastern China and Central India, sulfate is the dominant aerosol type with the contribution of 66%, 63% and 42% to total AOD, respectively, in the Indian Ocean, South Africa and North Africa, sea salt, organic carbon and dust are the main types of aerosols, respectively, with the contribution of 65%, 51% and 82%, respectively. There is a clear growth trend for black carbon, sulfate and total aerosols in Eastern China and central India and the linear trend 0.007 a-1 and 0.0056 a-1 for total aerosol optical depth in Eastern China and central India, respectively, but after 2010 there is a significant decline in Eastern China.
  • Research on Ground-Level PM2.5 Mass Concentration Retrieval Based on MODIS Aerosol Optical Thickness
  • XIA Zhiye;LIU Zhihong;WANG Yongqian;CHEN Hongbin;SUN Mingjiang;JIAO Lu
  • 2015, 34 (6): 1765-1771. DOI: 10.7522/j.issn.1000-0534.2014.00075
  • Abstract (674) PDF (1110KB)(1725)
  • Urban haze is becoming more and more serious in these years, especially in the Yangtze River Delta region, the Pearl River Delta region, the Area of Beijing ferry look forward to and other cities, the PM2.5 particles are the main component. In order to mainly retrieve mass concentration about PM2.5 near the surface using MODIS AOT(aerosol optical thickness) data. Firstly, the comparison analyses between AOT from MODIS and corresponding PM2.5 mass concentration in situ are done, the direct linear correlation coefficient R=0.323. And then R=0.467 improved on the base of elevation correction for AOT and relative humidity correction for PM2.5 primarily. Secondly, the seasonal variations about AOT and PM2.5 in depth are analyzed, find that the correlation is highest in autumn, 0.802, and lowest in spring, 0.252, and other seasons are between them, and analyzing the effect mechanism from AOT and PM2.5 themselves' physical and chemical features and meteorological factors to the both correlativity. In the end, a logarithm reversion model about PM2.5 mass concentration coupled with the elevation and relative humidity correction is constructed, the RMSE is 2.84% and mean error is 9.53% respectively, compared to ground measured data. Studies show that this logarithm reversion model can retrieve PM2.5 mass concentration near the ground effectively using AOT, and provide a new scientific basis for PM2.5 reversion by remote sensing, and also valuable for haze detection.
  • Analysis on the Relationship between Black Carbon Concentration and Meteorological Factors in Xingtai City
  • Jufei HAO;Yunling YANG;Erjie LI;Zhijie WU
  • 2021, 40 (3): 671-679. DOI: 10.7522/j.issn.1000-0534.2020.00049
  • Abstract (674) HTML (9) PDF (3721KB)(299)
  • Based on the monitoring data of black carbon (BC) concentration by EA-12 type and the meteorological observation data in Xingtai city from January to December 2019, analyzed the characteristics, sources and relationship between BC pollution and meteorological factors, The results showed that: The daily average concentration of BC was 0.85 μg·m-3 in Xingtai, the concentration frequency of 79.80% in the whole year was concentrated in the range of 0.30~1.20 μg·m-3; but in January, the concentration frequency of 90.62% was concentrated in the range of 1.05~5.05 μg·m-3, the serious BC pollution in January has contributed significantly to the deterioration of air quality throughout the year.When the wind speed was more than 8 m·s-1, there was a transportation in the north direction, and when the wind speed was less than 8 m·s-1, there was a transportation in the direction of west and south; Precipitation and precipitation duration were equally important to the wet removal of BC, The BC pollution in Xingtai city was mainly affected by local and local sources of coal-fired and motor vehicle emissions, when the atmospheric inverse temperature was less than 200 m, the concentration of BC will increase obviously due to the decrease of diffusion capacity and the accumulation effect.
  • Analysis on Autumn Aerosol Optical Characteristics at Lanzhou with Sun-photometer
  • Hui LIU;Ye YU;Dunsheng XIA;Suping ZHAO
  • 2020, 39 (1): 204-212. DOI: 10.7522/j.issn.1000-0534.2019.00057
  • Abstract (662) HTML (10) PDF (1735KB)(358)
  • Aerosol optical properties including aerosol optical depth (AOD), Angstrom wavelength index (α), and atmospheric turbidity coefficient (β) were inferred from the ground?based solar photometer observation data in Lanzhou from September to November 2015.The distribution and variation of aerosol optical properties were analyzed.Types and distribution of aerosols were derived based on Angstrom range and graphical method.The results show that the average AOD500 nm in autumn in Lanzhou City is 0.47±0.22.α 440~870 nm was the lowest in October (0.95±0.26) and the highest in September (1.21±0.14).β is the lowest in September (0.15±0.05) and the highest in November (0.28±0.12).The daily variation of AOD500nm ranges from 0.27 to 0.52.During September and October 2015, AOD500 nm mainly distributed between 0.2~0.6.In November, AOD500 nm is concentrated between 0.4~0.8, indicating that the distribution of AOD500 nm in Lanzhou in autumn is concentrated, and loading of aerosols increased from September to November.The wavelength index is mainly distributed between 1.0~1.4, 0.6~0.8, and 1.0~1.4 in September, October and November, respectively, with peaks between 1.2~1.4 and 1.0~1.2.Overall, aerosol in autumn is dominated by fine particle aerosols in Lanzhou.AOD500nm is significantly correlated with β, and both aerosol optical depth and turbidity coefficient can characterize the degree of turbidity.The main types of aerosols in autumn are anthropogenic and mixed aerosols in fine particle mode.The hygroscopic growth of fine particle aerosol is the main reason for the high aerosol optical depth in autumn for Lanzhou City.
  • Analysis on Aerosol Optical Property over Northern China from AERONET and SKYNET Observations
  • 高中明;闭建荣;黄建平
  • 2013, 32 (5): 1293-1307. DOI: 10.7522/j.issn.1000-0534.2012.00116.
  • Abstract (466) PDF (1297KB)(720)
  • The column-integrated optical properties of aerosol over northern China and southern Mongolia were investigated based on sun/sky radiometer measurements made at five Aerosol Robotic Network (AERONET) sites and one SKYNET site. Multi-year averaged daily and monthly  changes of aerosol optical depth (AOD) and ngstrm exponent were presented, and seasonal mean of aerosol volume size distribution, single scattering albedo, and asymmetry factor were also analyzed. The result shows that with the influence of dust storm activity every spring, the annual cycle of AOD show a spring and/or summer maximum, and  ngstrm exponent exhibited a springtime minimum, as well as the aerosol volume size distributions of coarse/fine mode presented different variation features. In addition, the aerosol optical properties of each station show the different changing trends associated with local anthropogenic pollution and biomass burning. For example, due to the influences of hygroscopic growth of aerosols from relative humidity increases in summer, the annual cycle of aerosol optical depth over Beijing and Xianghe stations show a summer maximum, and the single scattering albedo increase significantly.
  • Study on Aerosol Optical Property  in Xi′an  Region
  • 董自鹏;李星敏;杜川利;张高健
  • 2013, 32 (3): 856-864. DOI: 10.7522/j.issn.1000-0534.2012.00079
  • Abstract (450) PDF (982KB)(962)
  • The characteristics of Aerosol Optical Depth (AOD) and Angstrom exponent are analyzed using two-year  Cimel sunphotometer data at Jinghe site locates in Xi′an, China. By local pollution and topographic effects, the aerosol optical thickness in Jinghe River is higher in the whole year. The annual mean AOD is 0.69±0.40   from May 2008 to April 2009 and  0.67±0.39 from April 2010 to March 2011. The maximum values of optical thickness and wavelength exponent occurred in summer. The effect of dust and sand weather, the aerosol wavelength exponent in spring is the lest,  the optical thickness in the autumn is the lest. The comparsion between MODIS and CE318-derived AOD shows that the both have a better correlation, the data of accordance with the design precision of MODIS  is  55.0%~73.3%. The spatial distribution of MODIS AOD average value in 2008—2010 show that there are 3 AOD high value areas in Shaanxi, which Located in the Guanzhong basin, Hanzhoung city and Ankang downtown. Local pollution and topographic effect is mainly reason of causing the high value zone of AOD.
  • The Optical and Microphysical Characteristics of Dust Aerosol over a Typical Semi-arid Region in Loess Plateau
  • SHI Yingying;ZHANG Lei;TIAN Pengfei;LIU Hui;MA Qiang
  • 2018, 37 (1): 286-295. DOI: 10.7522/j.issn.1000-0534.2017.00024
  • Abstract (401) PDF (3564KB)(802)
  • Atmospheric aerosols regulate the balance of radiation budgets of the surface and atmosphere through direct, indirect and semi-direct effects, which affect regional and global climate change. In order to evaluate the aerosol radiation effects accurately, it is necessary to have a good understanding of aerosol optical and microphysical characteristics. At present, there is no sufficient understanding of the aerosol optical and microphysical characteristics over the typical semi-arid region in Loess Plateau. Based on the 2006-07-28 to 2012-08-10 sun photometer data from the Semi-Arid Climate and Environment Observatory of Lanzhou University (SACOL), dust aerosol was determined by using a strict judgment, and then dust aerosol optical and microphysical characteristics were analyzed. The work has important scientific significance and application value. The main results are as follows:Spring has the highest (2.80) dust aerosol optical depth (AOD), which is mainly distributed from 0.3 to 0.8 (about 82%), with a daily average of 0.63±0.44, indicating that the largest number of dust days occur in spring. Ångström exponent with maximum and minimum in spring (0.002) and autumn (0.525), which is opposite in phase to AOD, ranges between 0.2~0.4 (about 56%) and has a daily average of 0.27±0.12, showing that dust aerosols are mainly large particle size. The coarse mode dominates the size distribution of the dust aerosol, and the spring concentration is the largest. Both total and coarse mode volume concentrations have similar annual variation to AOD and reach their maximum in April with the fine mode volume concentration changing very little. The aerosol total and coarse mode effective radius ranges from its maximum in spring to its minimum in autumn, and the amplitude of the fine mode particles is small. The real part of the refractive index with the change of the effective radius is higher in spring and winter while it's lower in summer and autumn, which indicates that dust aerosol has strong scattering. In opposite phase to imaginary part of refraction index, the single scattering albedo is larger in spring, but has a minimum value in February, so dust aerosol absorption is weaker than black carbon aerosol. The asymmetry factor reaches its minimum in spring, which indicates that dust aerosol has stronger forward scattering than other kinds of aerosols.
  • Analyses on Dust Aerosol Optical Physical Properties over the Ganges River and South of Mongolia Using AERONET Dataset
  • 徐超-;马耀明
  • 2013, 32 (4): 1000-1009. DOI: 10.7522/j.issn.1000-0534.2012.00096
  • Abstract (386) PDF (1003KB)(656)
  • Dust is one of the most important aerosols, which has an important effect on the global and regional hydrologic cycleand Asian monsoon system. Using the observation data at Kanpur station in India and Dalanzadgad station in Mongolia derived from the AERONET (Aerosol Robotic Network) dataset,   the information of dust and anthropogenic aerosols  extracted through the threshold value method is comparatively analyzed. The results show that Kanpur is more affected by the India summer monsoon. The emissions of dust and anthropogenicaerosol superpose together. The major source of dust may be from remote supply. Dalanzadgadis less affected by the East Asian summer monsoon. Strong wind speed blows lots of dust in spring, which is related with strong wind speed and less vegetation. It is one of the main causes to make aerosol optical depth rise dramatically. Dust comes from the regional area. Anthropogenic aerosol is the main source of the local aerosol in other periods, but the total emissionis low. Furthermore, Kanpur in the Ganges River has more atmospheric particulate matterthan that of Dalanzadgadin the south of Mongolia. During the dust period, the particulatematter has similaroptical physical properties in the two regions.
  • Retrieval of Aerosol Optical Depth over Lanzhou Area Using MODIS Data
  • ZHAO Xiu-juan;CHEN Chang-he;ZHANG Wu;GUO Ni
  • 2005, 24 (1): 97-103.
  • Abstract (338) PDF (821KB)(511)
  • A test of sensitivity to the surface reflectance and aerosol optical depth (AOD) were made for the planetary albedo of three Channel of MODIS (blue, red and mid-infrared). The surface reflectance at these three Channel over Lanzhou and its surrounding areas were inversed with MODIS data and used to verify the relationships among them reported by kaufman. The results are consistent with Kaufman's.Based on the verification, we use the blue channel to retrieve the AOD over Lanzhou city and its surrounding areas in the range of nearly 1×10⁴ km2 by 6S model. The result shows that the distribution of the retrieved AOD is reasonable.
  • Researches on Optical Properties of Atmospheric Aerosol in Helan Mountain Area
  • NIU Sheng jie;SUN Ji ming
  • 2001, 20 (3): 298-301.
  • Abstract (278) PDF (240KB)(451)
  • According to the observation data of spectrosolar radiation by means of M-120 sunphotometer, optical properties of atmospheric aerosol in Helan mountain area have been analysed, and also the variation rule of aerosol optical depth and Angstrom turbidity parameter β, even wave exponent α under different weather conditions have been discussed. In addition, the relationships between the number concentration of ground aerosol and Angstrom turbidity parameter β, partical diameter of aerosol and wave exponent α have also been discussed.
  • Retrieval of Aerosol Optical Depth with a Custom Aerosol Model over Lanzhou and Its Surroundings
  • 张兴华;张武;陈艳;冯晶晶;闭建荣;史晋森;张北斗;黄建平
  • 2013, 32 (2): 402. DOI: 10.7522/j.issn.1000-0534.2012.00039
  • Abstract (266) PDF (1036KB)(994)
  • With a Custom Aerosol Model and class continental aerosol, a number spectral model of aerosol was obtained by the observation at the semi-arid climate and environment observatory of Lanzhou University(SACOL). Aerosol optical depth(AOD) over Lanzhou and its surroundings in a 100 km×100 km range was retrieved.The results show that the distribution of AOD retrieved by different aerosol models have some common features, there are a high value area in Xigu industrial district of Lanzhou and lower values in Xinglong Mountain  and Liu Jiaxia Reservoir, while in Yuzhong and Linxia as well as other small towns, it also shows higher values of AOD than that in its surrounding areas. Comparising the retrieved results and ground-based observations show that the retrieval accuracies of AOD have improved significantly with the custom defined aerosol model.
  • A Preliminary Analysis of AOD's Variation Characteristic in Semi-Arid Region of Chinese Loess Plateau
  • ZHANG Yu-jie;ZHANG Wu;CHEN Yan;CHANG Zhuo-lin;SHI Jin-sen
  • 2008, 27 (6): 1416-1422.
  • Abstract (259) PDF (1052KB)(429)
  • The AOD's variation characteristics in semi-arid region of Chinese Loess Plateau are analyzed by using the observed direct solar radiation data during August 2006 to April 2007 gained by the automatic sun tracking spectrophotometer CE-318 of SACOL. The results show that the AOD spectrum distributions in semi-arid region of Chinese Loess Plateau very nearly follow Angstrom's formula. In visible and near-infrared band AOD decreases while wavelength increases. There are three types of diurnal variations, and they are: Single peak type, steady type and rising type. Diurnal variation characteristics of AODshow that the precipitation has wet removal efficiency for aerosol particles and AOD obviously increases while haze appears. Diurnal average of AOD ranges from 0.1 to 0.4, the frequency of maximum AOD value is the highest at 08~11BST, and the frequency of minimum AOD value is the highest at 12~13BST, 14~17BST. The meteorological condition has obvouisly effect on AOD, under south wind AOD is big but under east wind AOD is small, Comparing with clear condition and haze AOD is obvouis big. For same band, the difference of AOD caused by wind direction is smaller than that caused by haze.
  • Multi-Band Remote Sensing Study on Aerosol Optical Depth in Tengger Desert
  • ZHANG Wen-yu;XIN Jin-yuan;YUAN Jiu-yi;LIU Li-chao
  • 2003, 22 (6): 613-617.
  • Abstract (256) PDF (211KB)(523)
  • Based on the data of surface multi-band(450~900 nm) solar radiant flux observed at Shapotou station of Tengger desert during April~September 2001,the calibration of instrument,the changes of aerosol depth in different wavelengths and its changing rule were discussed.The results show that the calibration of instrument is reliable to the special photometer.In the different weather condition,the changes of aerosol optical depth in the Tengger desert area exist obvious different,namely the total optical depth is high and temporal-spatial varication is significant.But under the same weather condition,the changing rules of different wavelengths were nearly consistent.There are different aerosol size distributions in the weather condition.
  • Impact of Pollutant Concentration on Aerosol Optical Depth in Ürümqi
  • LI Xia;REN Yi-yong;WU Yan;HU Xiu-qing
  • 2007, 26 (3): 541-546.
  • Abstract (251) PDF (603KB)(466)
  • Ürümqi city,located in northwestern semi-arid area of China,is well known for its serious air pollution.In this article,aerosol optical depth(AOD) was retrieved from observation measured by sun photometer CE318 from April on 15 2002 to March on 15 2003.There were two principal kinds of air pollutants in Ürümqi,namely PM10 and SO2.Combining AOD and air pollutant concentration such as PM10 and SO2,the relationship between these elements was discussed.The research results showed that the monthly mean AOD changed in the way consistent with pollutant concentration changing year around.The correlation coefficients between AOD and daily and monthly means of PM10 were 0.4227 and 0.5993,respectively;correspondingly,that ones between AOD and SO2 were 0.3212 and 0.8168,respectively.The correlation coefficient between monthly mean concentration of SO2 and monthly mean sulfation rate was very high with the value of 0.8430,which means concentration of SO2 made great contribution to AOD.It was possible for concentration of SO2 to evaluate AOD to a certain extent.
  • The Seasonal Variation of Aerosol Optical Depth in Dunhuang Area
  • LI Ren;JI Guo-liang
  • 2003, 22 (1): 84-87.
  • Abstract (251) PDF (181KB)(539)
  • A method of retrieving aerosol optical depth from direct solar radiation is discussed in climatologic statistical procedures.By using of the data observed from 1981 to 1983,we calculate the seasonal variation of the aerosol optical depth in Dunhuang area.The results are that the aerosol optical depths are small in winter and high in spring;the optical thickness in summer and autumn are between those in winter and spring,respectively;but the value in summer is higher than that in autumn.
  • Analyses on Aerosol Optical and Microphysical Properties over Taihu Lake Region
  • XU Ji-Liang;ZHANG Lei;LV Da-Ren
  • 2011, 30 (6): 1668-1675.
  • Abstract (244) PDF (944KB)(589)
  • Using Level 2.0 data of AERONET Taihu station, change of the Aerosol Optical Depth (AOD) with wavelength is analyzed.  The  results indicate that the curve is not linear at the double logarithm coordinate, but it can be fitted well with quadratic polynomial.  Aerosol particles consistent with lognormal size distribution.  the single-scattering albedo (SSA) is investigated also. SSA is relatively small in winter.  When the wavelength get longer, SSA increases in spring but decreases in August and September. Additionally, the particle spectra and volume concentration from September 2005 to November 2006 are analyzed. In  spring, the volumetric concentration of coarse particles are 2.0~2.5 times that of fine particles; and total particle concentration, affected by the coarse one, appears a peak. In the late summer and early autumn, however, the situation is in reverse. Increasing amount of smaller coarse particles(<3 μm) is larger than that of bigger particles(>3 μm) during  spring, which induces the diminishment of coarse particles effective radius. Finally, a dust weather process influence on the aerosol micro-physical parameters during 16~18 April 2006 are analyzed.
  • Study on Application of AOD Information in Forest Fire Detection
  • ZHANG Jie;ZHANG Wenyu;WANG Yanfeng;FAN Guangzhou;HAN Tingting;LIU Haiwen
  • 2015, 34 (3): 797-803. DOI: 10.7522/j.issn.1000-0534.2014.00023
  • Abstract (236) PDF (2252KB)(751)
  • The limitation of existing MODIS fire detection algorithm appears when it is applied to monitor forest fires in different season or in different regions. In response to these problems, the smoke plume identification in forest fires over complex surface types is studied to improve detection ability of open flame fire spots and cool smouldering fire spots. According to the effect of smoke plume diffusion on atmospheric aerosol distribution, a detection method for the smoke plume is offered as potentiating tools to identify fire pixels by extracting atmospheric Aerosol Optical Depth (AOD) information from fire areas. Based on the 6S (Second Simulation of a Satellite Signal in the Solar Spectrum) radioactive transfer model, the Dark Target (DT) method is used to retrieve AOD form MODIS data in many fire spots and background areas. In addition, the sensitivity of AOD cumulative effect to the smoke plume diffusion in different azimuth directions and different diffusion ranges is discussed. The results show that AOD retrieved by DT method could stand for the distribution characters of smoke volume, as well as indicate the direction and the rough range of smoke spread. The values of AOD in 32 azimuth directions are accumulated when the distance from the centre is 10 km, if the true fire spots are thought as the centre of a circle. The most remarkable difference of AOD cumulative value is found by comparing the leeward side to the windward side. The ratio of the two is more than ten to one. So it will provide an effective auxiliary criterion for MODIS fire detection algorithm to avoid missing disperse fire spots, especially cool fire spots.
  • Analyses on Atmospheric Aerosol Optical Properties withLidar Data in Lanzhou Suburb
  • 周碧;张镭*;曹贤洁;韩霄;张武;冯广泓
  • 2011, 30 (4): 1011-1017.
  • Abstract (215) PDF (742KB)(873)
  • Based on the lidar from the Semi-Arid Climate and Environment Observatory of Lanzhou University (SACOL), the data from January to April 2007 with clear sky and dust storm weather were selected to retrieve aerosol extinction coefficient (AEC) and aerosol optical depth (AOD). The results show that the AEC has high value in the low layer under 1 km, which is 0.01~0.1 km-1 ; the average AOD is below 0.5, the daily AOD has two peaks appearing at 12:00 and 20:00, respectively. The difference between heating and non-heating season is obvious. In dust storm, The AEC has high value under 6 km, with 0.1~1 km-1 ; the AOD is larger than 1; the peak value is 3.5; the lidar valid observation has below 2 km with the retrieve of AEC showing segments phenomena in strong dust storm process, and the AOD has good relation with PM10 surface concentration. The AOD correlation coefficient between lidar and sun photometer is 0.86.
  • Atmospheric Aerosol Optical Thickness and Dusty Weather in Northern China in Spring of 2001
  • SHEN Yan-bo;SHEN Zhi-bao;WANG Wan-fu
  • 2003, 22 (2): 185-190.
  • Abstract (213) PDF (1125KB)(454)
  • Using the Atmospheric Aerosol Optical Thickness(AOT) data at 5 stations,the characteristics of temporal and spacial distribution of AOT in the northern China in spring,2001 were analyzed.The results indicate that the higher values(≥1.04) of AOT often appear in each month at 5 stations during the observation period,and it seems to be same as the general temporal and spacial distribution features of the dusty weather occurred in the northern China in spring.The relationships between atmospheric aerosol optical thickness and horizontal visibility as well as the dusty weather were discussed.
  • A Study of Retrieving Aerosol Optical Depths from Direct Solar Irradiation
  • DU Ping;QIAN Zeyu;CHEN Changhe
  • 2002, 21 (1): 79-84.
  • Abstract (201) PDF (312KB)(440)
  • Two kinds of methods are used to calculate the aerosol optical depths of wide-band from the direct solar irradiation detected by pyrheliometer on the ground under the condition of cloud free sky. The results are obtained to be similar. The analyses of two methods show that the first method is conciser, while the equation used in it is curt, the second one is to definite the opximum wavelength, and the optical depth of the wavelength is regarded as the wide-band aerosol optical depth. So, the latter one is more precise on the theory, and more information can be obtained from the result. In a word, the latter is more resonable than the former.
  • The Aerosol Optical Depth over Lanzhou Area Retrieved with a Compared Method Using MODIS Data
  • HUANG Ting;CHEN Chang-he;CHEN Yong-hang;ZHANG Wu;ZHANG Lei
  • 2006, 25 (5): 886-892.
  • Abstract (191) PDF (624KB)(410)
  • The dark target method developed by Kaufman is one of methods to retrieve the aerosol optical depth using MODIS data.But there is limitation in getting the surface reflectivity of visible channel.In this paper we demonstrate an experiment with a compared method to study the feasibility of retrieving aerosol optical depth for large particle size.The sensitivity of two day's difference of apparent reflectivity to aerosol optical depth was simulated with 6S model.The aerosol optical depth and particle geometrical mean mass radius over water was retrieved with a LUT using two day's MODIS data.The aerosol optical depth over Lanzhou area was retrieved and the result is close to the sun photometer measurements on the ground,which indicates the method is feasible.
  • Lanzhou Aerosol Optical Depth in Winter and Their Relation with Visibility
  • ZHAO Xiu-juan;CHEN Chang-he;Yuan Tie;Zhang Wu;DONG Xiu-juan
  • 2005, 24 (4): 617-620.
  • Abstract (188) PDF (1569KB)(626)
  • Utilizing the data monitored by sun photometer, the aerosol optical depth of Lanzhou in winter was calculated, and the turbidity coefficient β and the wavelength exponent α were further calculated using aerosol optical depth. The results show that the aerosol optical depth and turbidity coefficient are larger than the same historical period, and the most of aerosols are large particles. The aerosol optical depth and visibility were analyzed and fitted in the paper, both the change trend is just opposite, and the relation between them appears the trend of exponent decrease.
  • 兰州地区高云和气溶胶光学特性及其辐射效应
  • 邓涛-;张镭*;吴兑;夏俊荣;宋薇;邓雪娇;谭浩波;毕雪岩;李菲
  • 2010, 29 (1): 230-235.
  • Abstract (178) PDF (1506KB)(1085)
  • 利用激光雷达探测分析了兰州上空的高云与气溶胶的光学参数, 并用LOWTRAN7定量模拟出高云对气溶胶辐射特性的影响。结果表明, 消光系数廓线与相对湿度廓线随高度的变化一致性较好, 气溶胶层主要在2 km以下, 低层气溶胶和高云的消光系数和相对湿度较大。白天, 高云的存在使云下气溶胶短波加热率减小。有云和无云时气溶胶加热率的差别在地表处最为明显, 中午前后差别较大, 最大为11:00的0.096K·h-1。夜间, 高云的存在使云下气溶胶长波冷却率减小, 在1000 m以下有云和无云时气溶胶冷却率的差别小, 在 1000 m以上差别大, 最大差别出现在1500 m处(02:00~04:00), 为0.033K·h-1
  • Analyses on Aerosol Optical Depth over Arid and Semi-Arid Region of Loess Plateau Using Remote Sensor Data
  • 胡蝶;张镭;王宏斌
  • 2013, 32 (3): 654-664. DOI: 10.7522/j.issn.1000-0534.2012.00062
  • Abstract (175) PDF (1384KB)(710)
  • The characteristics of diurnal, monthly change of aerosol optical depth (AOD), and monthly change of Angstrom index (α-index) were analyzed using data of Sun Photometer (CE-318) at the Semi-Arid Climate and Environment Observatory of Lanzhou University (SACOL) from August 2006 to October 2008, it is found that the amplitude of the diurnal AOD change in spring is larger than that in other seasons, and it shows the double-peak characteristic. AOD is smaller in September and larger in April and December. α-index reaches its minimum in April, and maximum in July. Correlation coefficients of 550 nm AOD retrieved from sun photometer data and that from Terra and Aqua MODIS data are 0.69/0.62. The errors are analyzed from aspects of surface albedo assumption, aerosol model, and influence of clouds. Additionally, Terra and Aqua MODIS data are used for analyzing spatial and seasonal characteristics of AOD above the arid and semi-arid regions of Loess Plateau. Results show that east region has larger AOD, and local maximums are corresponding to capital cities of those provinces. AOD above the arid and semi-arid regions reaches  maximum in spring and minimum in autumn. The Deep Blue algorithm for Aqua-MODIS is a good supplement for the retrieval of AOD above bright surface of deserts in Northwest China.