1 引言
2 资料来源和方法介绍
表1 青藏高原南部20个基本气象台站站点信息Table 1 Information of 20 basic meteorological stations in the southern Qinghai-Xizang Plateau |
| 站号 | 站名 | 纬度 | 经度 |
|---|---|---|---|
| 55299 | 那曲站 | 31°29′N | 92°04′E |
| 55493 | 当雄站 | 30°29′N | 91°06′E |
| 55569 | 拉孜站 | 29°05′N | 87°36′E |
| 55572 | 南木林站 | 29°41′N | 89°06′E |
| 55593 | 墨竹贡卡站 | 29°51′N | 91°44′E |
| 55597 | 琼结站 | 29°02′N | 91°41′E |
| 55598 | 泽当站 | 29°15′N | 91°46′E |
| 55655 | 聂拉尔站 | 28°11′N | 85°58′E |
| 55664 | 定日站 | 28°38′N | 87°05′E |
| 55680 | 江孜站 | 28°55′N | 89°36′E |
| 56116 | 丁青站 | 31°25′N | 95°36′E |
| 56128 | 类乌齐站 | 31°13′N | 96°36′E |
| 56137 | 昌都站 | 31°09′N | 97°10′E |
| 56223 | 洛隆站 | 30°45′N | 95°50′E |
| 56227 | 波密站 | 29°52′N | 95°46′E |
| 56228 | 八宿站 | 30°03′N | 96°55′E |
| 56312 | 林芝站 | 29°40′N | 94°20′E |
| 56317 | 米林站 | 29°13′N | 94°13′E |
| 56331 | 左贡站 | 29°40′N | 97°50′E |
| 56434 | 察隅站 | 28°39′N | 97°28′E |
3 预测因子及模型
表2 前3个预选因子建模预测结果Table 2 Prediction results of the first three pre-selected factors |
| 项目参数 | 前3个预选因子 | ||
|---|---|---|---|
| 第1个因子 | 第2个因子 | 第3个因子 | |
| 预测因子 | 5月东大西洋遥相关型指数年际增量 | 春季冷空气次数年际增量 | 5月北大西洋-欧洲区极涡强度指数年际增量 |
| 预测模型 | dy=-0.02-0.73x | dy=-0.03+0.79x | dy=-0.07-0.78x |
| 回归方程拟合优度 | 0.55 | 0.45 | 0.43 |
| 模拟年份降水年际增量同号率 | 22/30 | 22/30 | 21/30 |
| 后报年份降水年际增量同号率 | 4/9 | 3/9 | 7/9 |
| 模拟年份降水距平同号率 | 24/30 | 23/30 | 20/30 |
| 后报年份降水距平同号率 | 5/9 | 2/9 | 6/9 |
| 模拟年份降水距平百分率均方根误差 | 18% | 20% | 21% |
| 后报年份降水距平百分率均方根误差 | 15% | 23% | 17% |
表3 第1组预测因子及其与高原南部汛期降水年际增量的相关系数Table 3 Group 1 predictors and the correlation coefficients between them and the interannual increments of precipitation in the southern Qinghai-Xizang Plateau during the flood period |
| 序号 | 预测因子 | 与降水相关系数 |
|---|---|---|
| 1 | 5月东大西洋遥相关型指数年际增量 | -0.74** |
| 2 | 12月西藏高原-1指数年际增量 | -0.55** |
| 3 | 4月亚洲经向环流指数年际增量 | -0.50** |
| 4 | 4月太平洋区极涡强度指数年际增量 | 0.46* |
| 5 | 5月冷空气次数年际增量 | 0.42* |
| 6 | 12月850 hPa西太平洋信风指数年际增量 | -0.39* |
| 7 | 1月NINO B区海表温度距平指数年际增量 | 0.38* |
*代表通过了95%的显著性检验, **代表通过了99%的显著性检验 |
表4 第2组预测因子及其与高原南部汛期降水年际增量的相关系数Table 4 Group 2 predictors and the correlation coefficients between them and the interannual increments of precipitation in the southern Qinghai-Xizang Plateau during the flood period |
| 序号 | 预测因子 | 与降水相关系数 |
|---|---|---|
| 1 | 5月北大西洋-欧洲区极涡强度指数年际增量 | -0.66** |
| 2 | 5月亚洲经向环流指数年际增量 | 0.61** |
| 3 | 12月东亚大槽强度指数年际增量 | 0.52** |
| 4 | 1月北美区极涡面积指数年际增量 | 0.50** |
| 5 | 5月冷空气次数年际增量 | 0.42* |
| 6 | 1月大西洋欧洲区极涡面积指数年际增量 | 0.41* |
| 7 | 2月北半球极涡中心纬向位置指数年际增量 | 0.40* |
| 8 | 12月850 hPa西太平洋信风指数年际增量 | -0.39* |
*代表通过了95%的显著性检验, **代表通过了99%的显著性检验 |
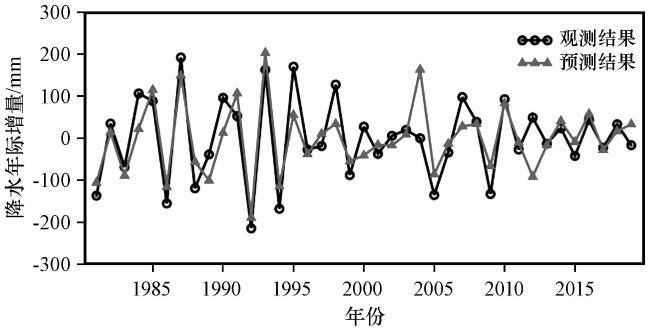
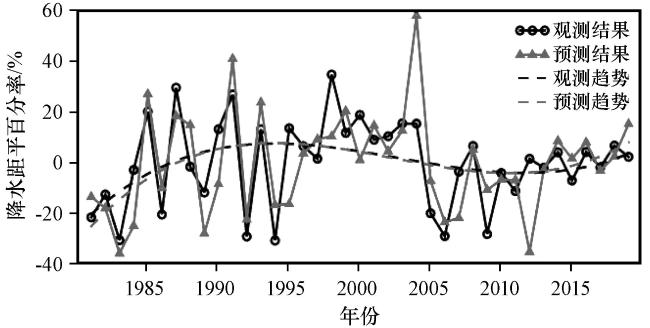
图1 观测和预测的1981 -2019年高原南部汛期降水年际增量Fig.1 Observed and predicted interannual increments of precipitation in the southern Qinghai-Xizang Plateau during the flood period from 1981 to 2019 |
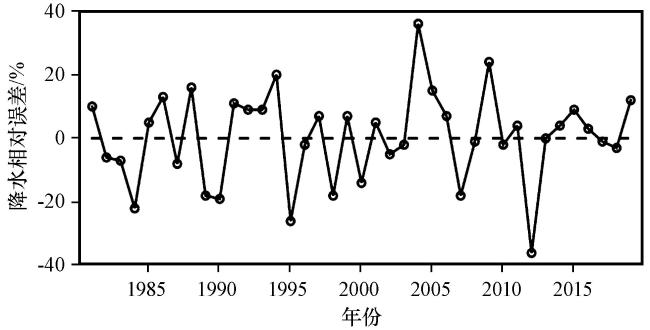
图2 1981 -2019年高原南部汛期降水预测相对误差Fig.2 The relative errors of predicted precipitation in the southern Qinghai-Xizang Plateau during the flood period from 1981 to 2019 |
4 物理机制分析
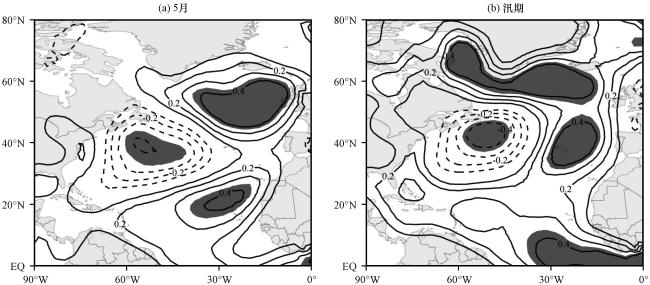
图4 高原南部汛期降水与北大西洋SST年际增量的相关系数(等值线)分布深色阴影区表示通过95%的显著性检验 Fig.4 Distribution of the correlation coefficients (contour) between the interannual increments of precipitation in the southern Qinghai-Xizang Plateau during the flood period and those of SST in North Atlantic Ocean.The dark shaded areas passed 95% significance test |
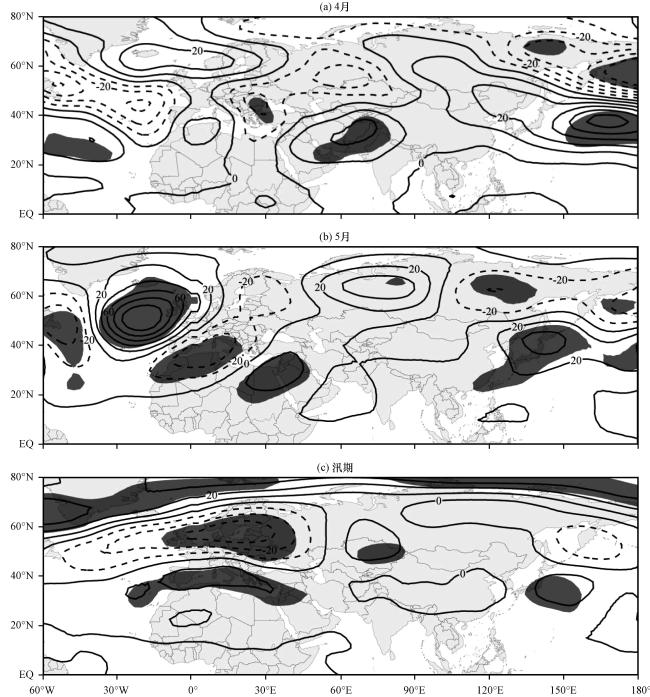
图5 降水偏多年与偏少年500 hPa位势高度差值(等值线, 单位: gpm)深色阴影区表示通过95%的显著性检验 Fig.5 Differences of geopotential height (contour) at 500 hPa between the flood years and the drought years.Unit: gpm.The light shaded areas indicate land.The dark shaded areas passed 95% significance test |