
1 引言
2 资料来源与方法介绍
2.1 资料来源
2.2 资料评估
2.3 方法说明
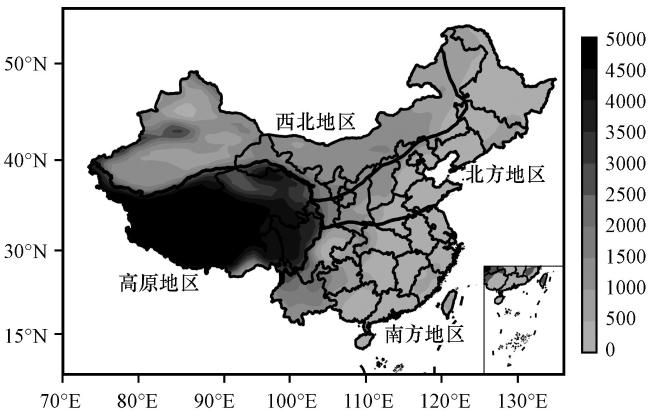
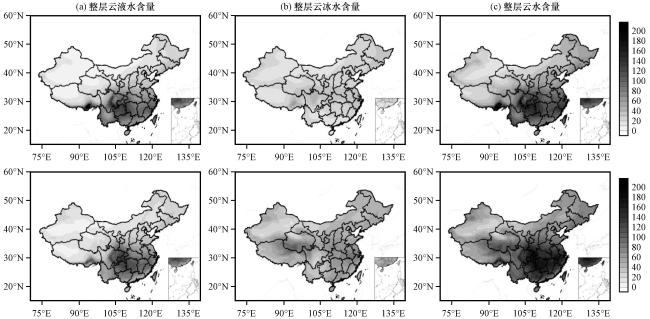
3 中国夏季大气水循环变量及气温时空特征
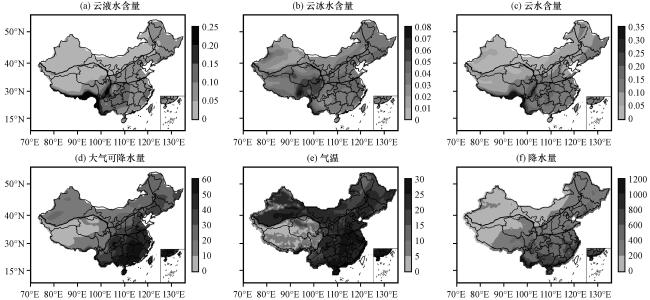
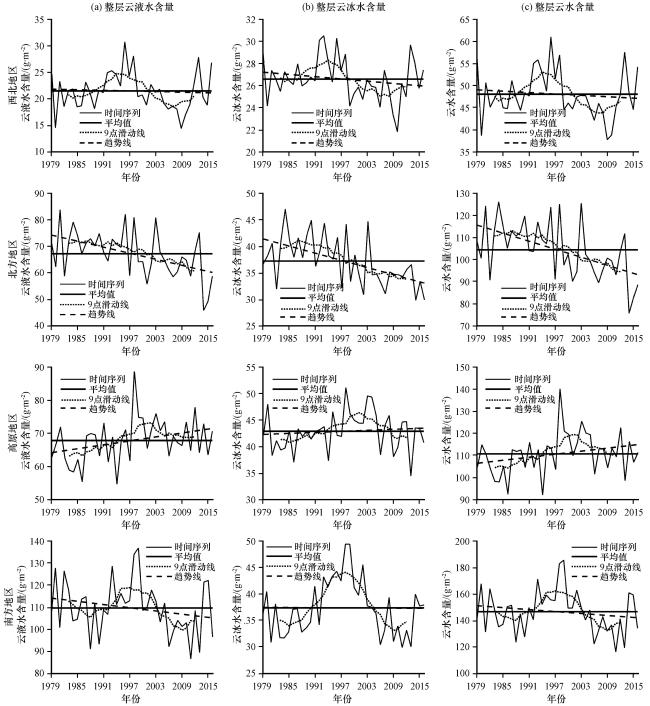
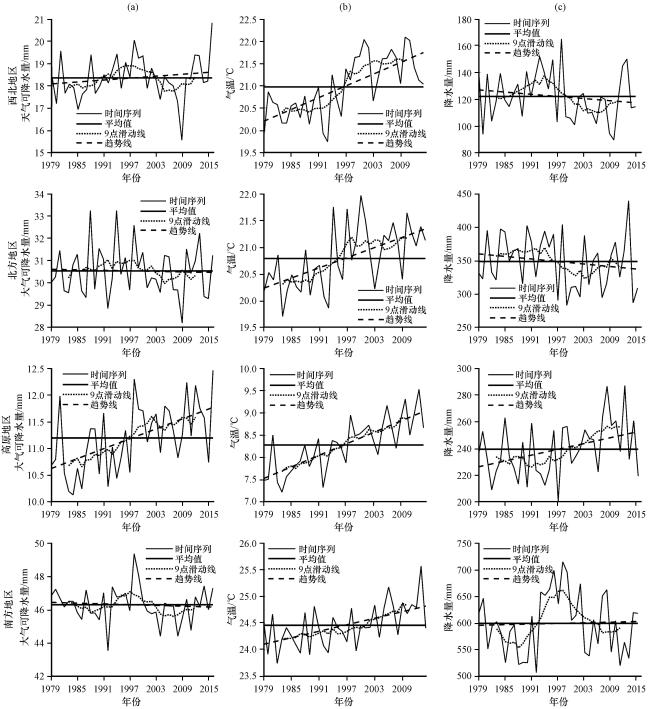
表1 中国各区域夏季各物理量变化趋势Table 1 Trends of physical variables in summer in four sub-regions of China |
| 区域 | 降水量/[mm·(10a)-1] | VCLWC/[g·m-2·(10a)-1] | VCIWC/[g·m-2·(10a)-1] | VCWC/[g·m-2·(10a)-1] | 气温/[℃·(10a)-1] | PW/[mm·(10a)-1] |
|---|---|---|---|---|---|---|
| 西北地区 | -2.7 | -0.2 | -0.3 | -0.5 | 0.4** | 0.1 |
| 北方地区 | -6.3 | -3.8** | -2.2** | -6.0** | 0.3** | -0.04 |
| 高原地区 | 7.3* | 1.9* | 0.3 | 2.3 | 0.4** | 0.3** |
| 南方地区 | 2.0 | -2.4 | -0.04 | -2.4 | 0.2** | -0.08 |
*代表通过α=0.05的显著性检验, **代表通过α=0.01的显著性检验 |
4 夏季云水含量与气温的关系
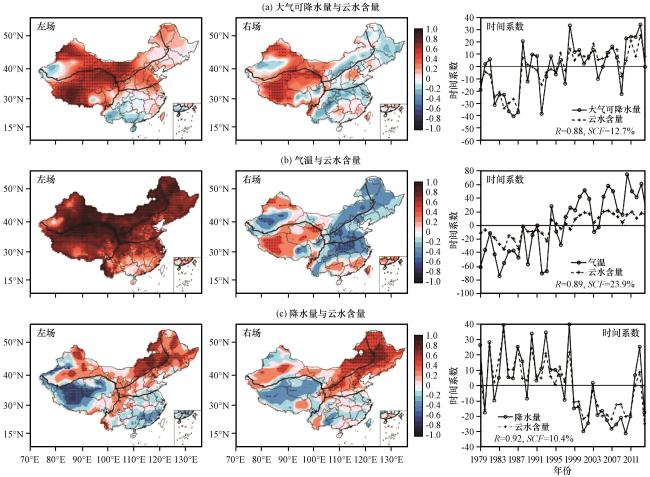
图6 大气可降水量、 气温、 降水量分别与云水含量的SVD分解第一模态异类相关系数左场和右场分布及其时间系数打点区为通过0.01的显著性检验 Fig.6 The first mode in the SVD expansion for the heterogeneous correlations in the left and right fields and their time coefficients of the precipitable water vapor, temperature and precipitation with the vertical integral of cloud water content.The dotted area indicates significance at the level of 0.01 |
表2 各区域降水、 气温、 大气可降水量与云水含量的相关系数Table 2 Correlation coefficients between precipitation, temperature, precipitable water vapor and cloud water content in each region |
| 物理量 | 相关系数 | |||
|---|---|---|---|---|
| 西北地区 | 北方地区 | 高原地区 | 南方地区 | |
| 降水量 | 0.81** | 0.82** | 0.53** | 0.66** |
| 气温 | -0.45** | -0.47** | 0.11 | -0.64** |
| 大气可降水量 | 0.46** | 0.40* | 0.63** | 0.44** |
*代表通过α=0.05的显著性检验, **代表通过α=0.01的显著性检验 |
5 气温变化对夏季云水量年际异常的影响机制
表3 减去九点平滑后以+(-) 0.6倍标准差为准的云水含量和气温异常年份Table 3 Anomal years of cloud water content and temperature after subtracting the nine-point smoothing based on + (-) 0.6 times the standard deviation |
| 云水含量(高原为云液水含量)异常年份 | 气温异常年份 | ||
|---|---|---|---|
| 西北地区 | 高值年 | 1981, 1984, 1987, 1992, 1993, 1996, 1998, 2003, 2004, 2007, 2013 | 1980, 1988, 1991, 1994, 1997, 1999, 2000, 2001, 2002, 2007, 2010, 2011 |
| 低值年 | 1980, 1989, 1995, 1999, 2000, 2001, 2009, 2010 | 1983, 1984, 1989, 1992, 1993, 1996, 2003, 2004, 2009 | |
| 北方地区 | 高值年 | 1981, 1984, 1990, 1993, 1996, 1998, 2003, 2012, 2013 | 1982, 1988, 1994, 1997, 2000, 2001, 2007, 2010 |
| 低值年 | 1980, 1982, 1986, 1991, 1992, 1997, 1999, 2001, 2002, 2006, 2007 | 1983, 1992, 1993, 1996, 1998, 2003, 2004, 2009 | |
| 高原地区 | 高值年 | 1981, 1987, 1988, 1989, 1991, 1998, 2003, 2005, 2010, 2012 | 1981, 1988, 1991, 1994, 1998, 2006, 2010, 2013 |
| 低值年 | 1983, 1984, 1986, 1992, 1994, 1997, 2001, 2006, 2011, 2013 | 1980, 1983, 1984, 1992, 1997, 2003, 2004, 2008, 2011 | |
| 南方地区 | 高值年 | 1980, 1982, 1986, 1987, 1993, 1998, 1999, 2002, 2008 | 1981, 1984, 1988, 1990, 1994, 1998, 2003, 2006, 2013 |
| 低值年 | 1981, 1984, 1988, 1990, 2000, 2001, 2006, 2011, 2013 | 1980, 1982, 1987, 1989, 1992, 1993, 1997, 1999, 2004, 2008 |
加粗年为云水和气温共同异常年 |
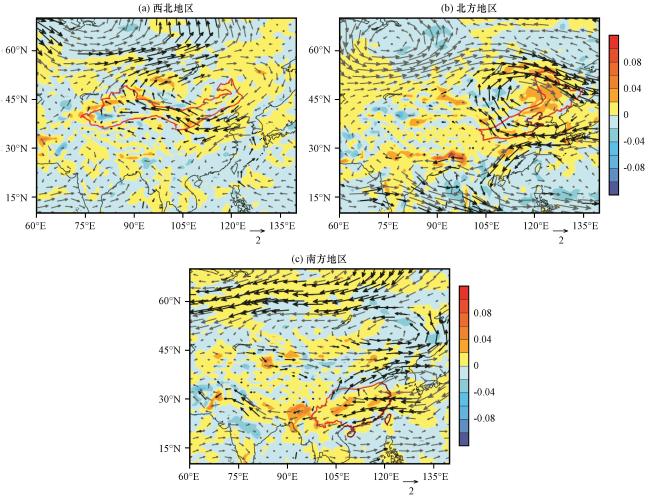
图7 1979 -2014年各地区气温异常高、 低值年700 hPa风场(矢量, 单位: m·s-1)、 垂直速度(彩色区, 负值代表上升运动, 单位: Pa·s-1)合成差值场加粗矢量为通过α=0.05显著性检验, 红色线为区域边界线 Fig.7 Synthetic difference field of wind field (vector, unit: m·s-1) and vertical velocity (color area, negative values represent upward movement, unit: Pa·s-1) at 700 hPa between abnormally high and low temperature years over different sub-regions during 1979 -2014.The black arrows indicate significance at the level of 0.05, the red lines are the boundary lines of the sub-regions |
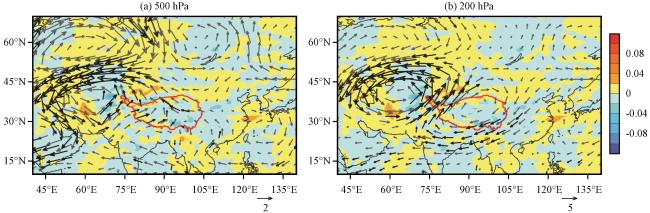
图8 1979 -2014年高原地区气温异常高、 低值年风场(矢量, 单位: m·s-1)、 垂直速度(彩色区, 负值代表上升运动, 单位: Pa·s-1)合成的差值场加粗矢量为通过α=0.05显著性检验, 红色线为区域边界线 Fig.8 Synthetic difference field of wind field(vector, unit: m·s-1) and vertical velocity (color area, negative values represent upward movement, unit: Pa·s-1) between abnormally high and low temperature years over Qinghai-Xizang Plateau during 1979 -2014.The black arrows indicate significance at the level of 0.05, the red line is the boundary line |
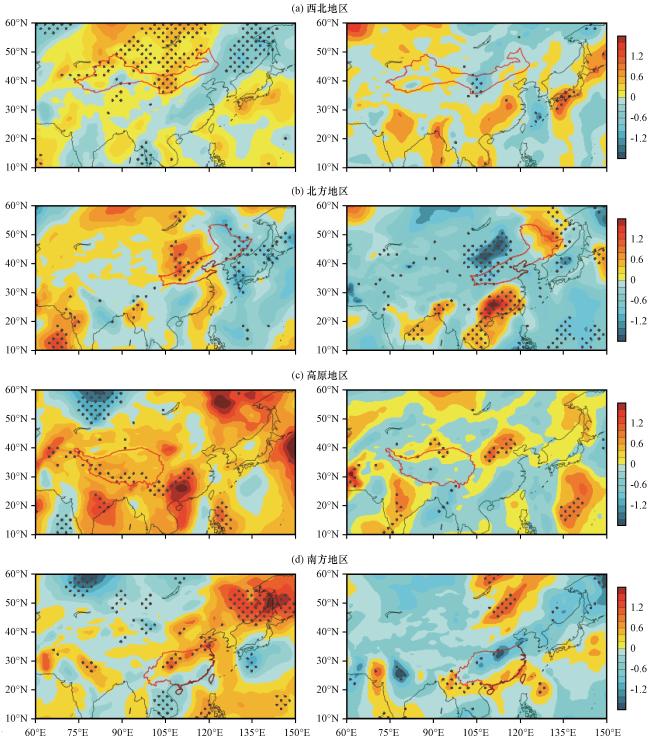
图9 1979 -2014年夏季各地区气温异常高值年(左)、 低值年(右)850 hPa经向风速距平场 (单位: m·s-1)打点区为通过α=0.1显著性检验, 红色线为区域边界线 Fig.9 Composites of 850 hPa meridional wind speed anomaly field in abnormally high temperature years (left) and low temperature years (right) of each sub_region in summer during 1979 -2014.Unit: m·s-1.The stippled area indicates significance at the level of 0.1, the red lines are the boundary lines of the sub-regions |