1 引言
2 降水过程概况
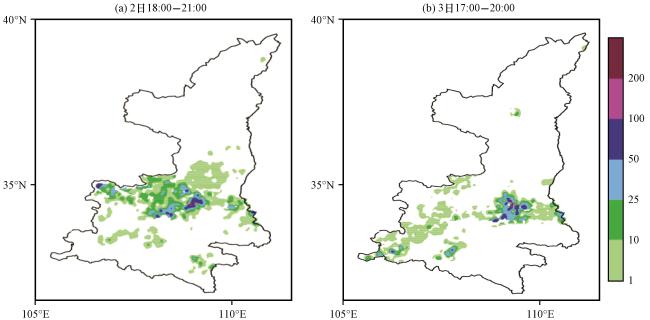
图1 2015年8月2日18:00 -21:00 (a)和3日17:00 -20:00 (b)陕西3 h降水量分布(单位: mm)红色方框为西安临潼观测站位置 Fig.1 Three-hour precipitation distribution in Shaanxi Province from 18:00 to 21:00 on 2 (a) and from 17:00 to 20:00 on 3(b) August 2015.Unit: mm.The red boxes represent the location of Lintong observatory station in Xi'an |
表1 2015年8月2 -3日西安及周边站点小时降水量Table 1 Hourly precipitation at Xi'an and its surrounding stations from 2 to 3 August 2015 |
| 站名 | 小时降水量/mm | |||
|---|---|---|---|---|
| 2日20:00 | 2日21:00 | 3日18:00 | 3日19:00 | |
| 临潼 | 29.5 | 35.1 | 0 | 76.1 |
| 高陵 | 47.2 | 7.9 | 6.6 | 24.4 |
| 西安 | 44.2 | 6.6 | 4.8 | 1.1 |
| 大峪 | 6.0 | 1.0 | 40.3 | 86.3 |
3 大尺度对流背景条件
3.1 环流背景
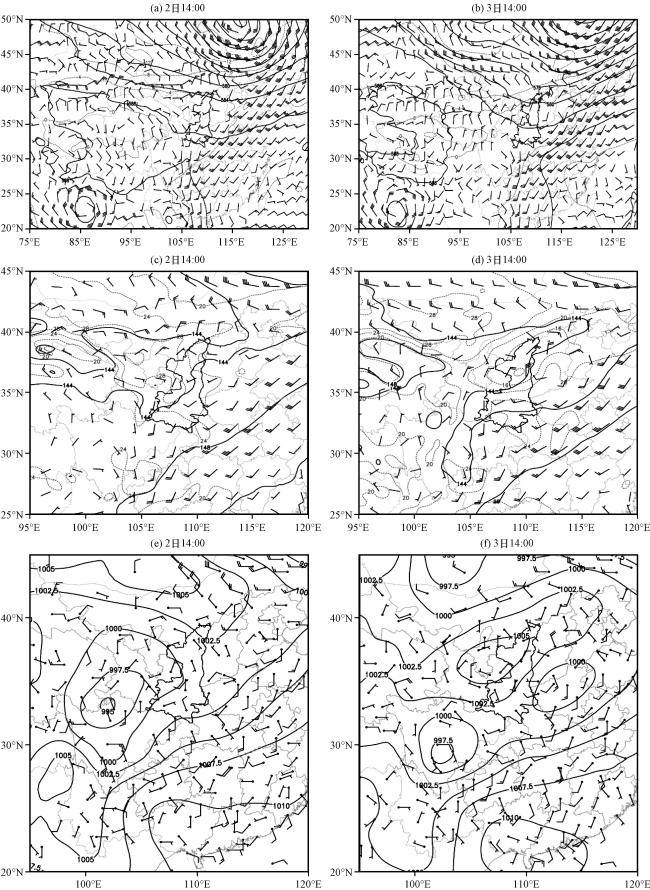
图2 2015年8月2 -3日500 hPa(a, b)、 850 hPa(c, d)位势高度场(实线, 单位: dagpm), 温度场(虚线, 单位: ℃)和风场(风羽, 单位: m·s-1)(a~d), 地面海平面气压场(实线, 单位: hPa)和10 m风场(风羽, 单位: m·s-1)分布(e, f)Fig.2 500 hPa (a, b) and 850 hPa (c, d) geopotential height field (solid line, unit: dagpm), temperature (the dotted line, unit: ℃) and wind (barb, unit: m·s-1) (a, b, c, d), and surface weather situation (e, f) of sea level pressure (solid line, unit: hPa) and 10 m wind (barb, unit: m·s-1) form 2 to 3 August 2015 |
3.2 水汽及动力条件对比分析
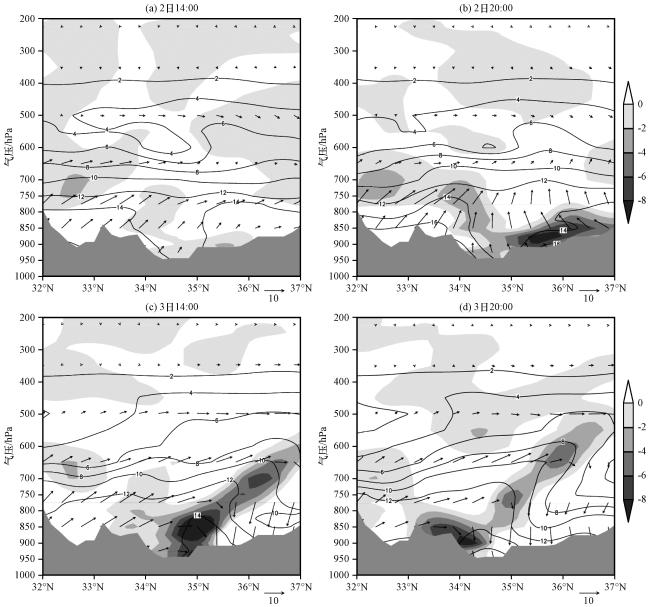
图3 2015年8月2日14:00、 20:00及3日14:00、 20:00沿109°E的水汽垂直分布等值线为比湿(单位: g·kg-1); 矢量为水汽通量(单位: g·s-1·cm-2); 填色为水汽通量散度(单位: g·s-1·hPa-1·cm-2); 灰色阴影为地形 Fig.3 Vertical distribution of water vapor along 109°E at 14:00 and 20:00 on 2 and at 14:00 and 20:00 on 3 August 2015.The solid lines for specific humidity (unit: g·kg-1); vectors represent water vapor flux (unit: g·s-1·cm-2); shaded represent divergence of water vapor flux (unit: g·s-1·hPa-1·cm-2); The gray shadows represent terrain |
3.3 热力及不稳定条件对比分析
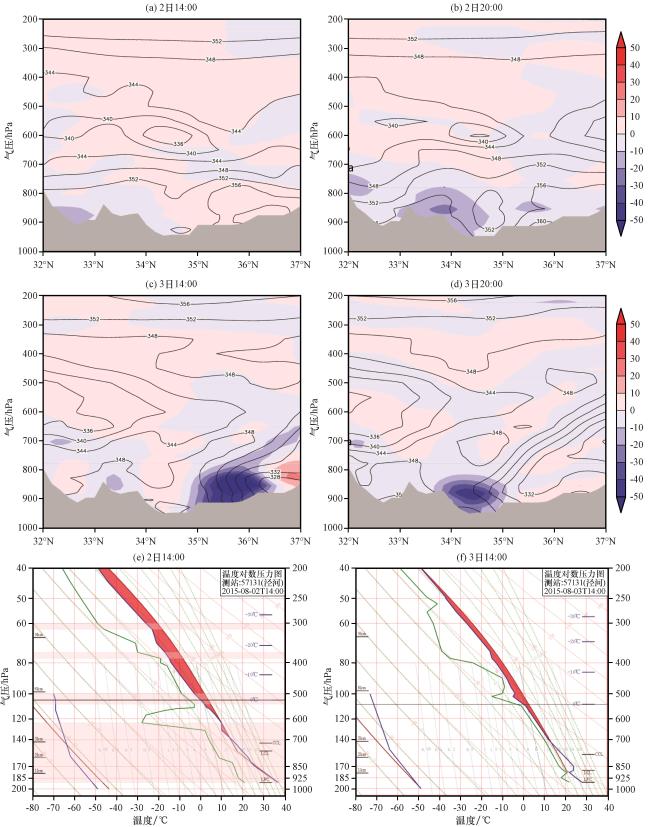
图4 2015年8月2日14:00、 20:00及3日14:00、 20:00沿109°E的假相当位温(实线, 单位: K)、 温度平流(填色, 单位: ×10-5 K·s-1, 灰色阴影为地形)垂直剖面(a, b, c, d)及14:00西安站探空(e, f)Fig.4 Vertical profiles of pseudo-equivalent potential temperature (solid line, unit: K) and temperature advection (the shaded, unit: ×10-5 K·s-1, the gray shadows represent terrain) along 109°E at 14:00 and 20:00 of 2 and 3 (a, b, c, d), and the radiosonde observation at Xi'an station at 14:00 (e, f )of 2 and 3 August 2015 |
4 触发机制的对比分析
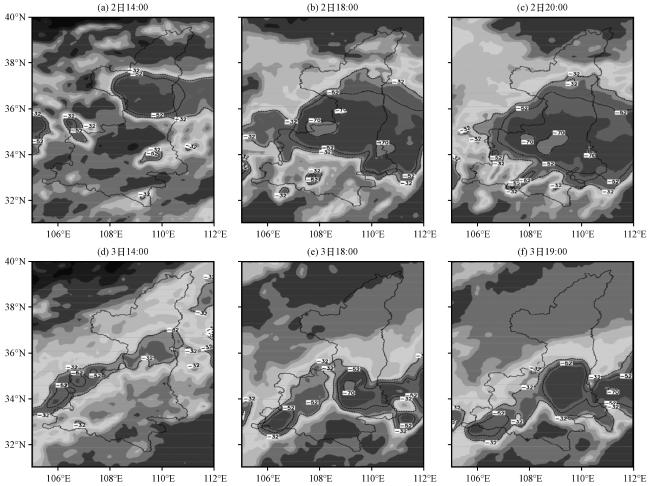
4.1 中尺度雨团演变特征
4.2 暴雨触发条件的对比分析
4.2.1 2日暴雨触发条件分析
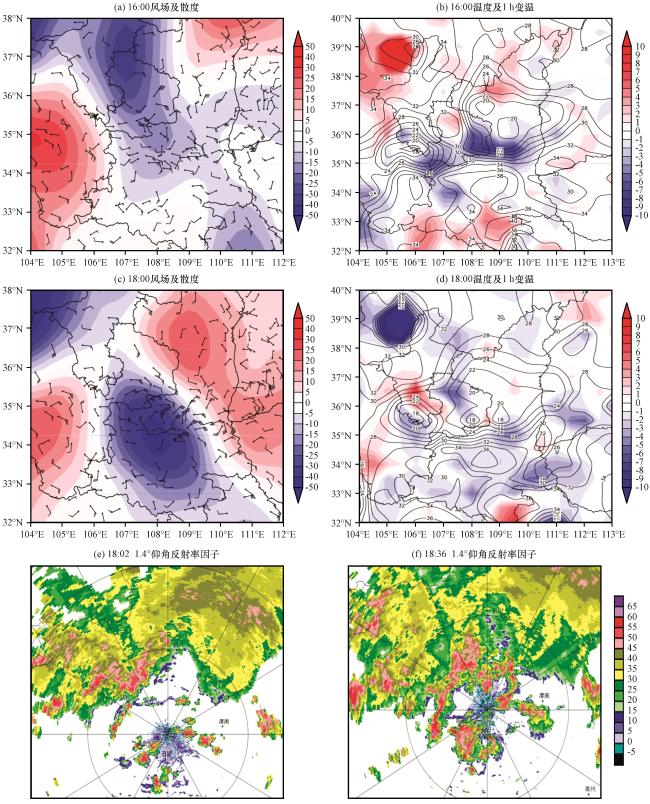
图6 2015年8月2日16:00及18:00 10 m风场(风羽, 单位: m·s-1)、 散度场(彩色区, 单位: ×10-6 s-1)和2 m温度(等值线, 单位: ℃)、 1 h变温场(彩色区, 单位: ℃)以及西安雷达1.4°仰角18:02、 18:36反射率因子(单位: dBZ)Fig.6 10 m wind (vector, unit: m·s-1) and its divergence (color area, unit: ×10-6 s-1), 2 m temperature (solid line, unit: ℃) and one hour temperature change (color area, unit: ℃) at 16:00 and 18:00 and 1.4° basic reflectivity from Xi'an radar (unit: dBZ) at 18:02, 18:36 on 2 August 2015 |
4.2.2 3日暴雨触发条件分析
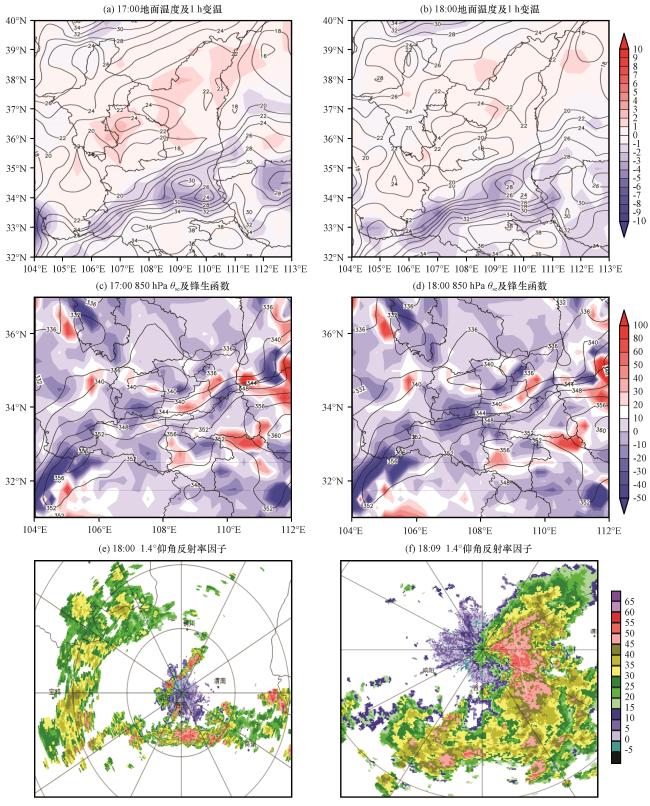
图7 2015年8月3日17:00和18:00 2 m温度(等值线, 单位: ℃)及1 h变温场(彩色区, 单位: ℃)、 850 hPa θ se(等值线, 单位: K)及锋生函数(彩色区, 单位: ×10-10 K·m-1·s-1), 以及西安雷达1.4°仰角18:00、 18:09反射率因子(单位: dBZ)Fig.7 2 m temperature (solid line, unit: ℃) and 1 h temperature change (color area, unit: ℃), 850 hPa θ se (solid line, unit: K), frontogenesis function (color area, unit: ×10-10 K·m-1·s-1) at 17:00 and 18:00 and 1.4° basic reflectivity from Xi'an radar (unit: dBZ) at 18:00, 18:09 on 3 August 2015 |