
1 引言
2 降水实况与物理量场分析
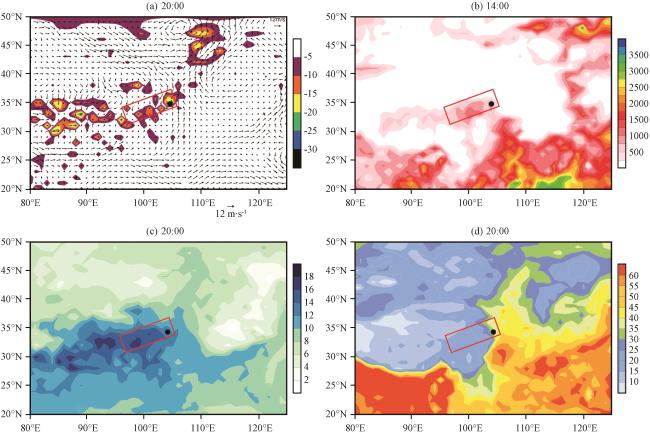
图2 2018年7月1日700 hPa水汽通量散度[a, 彩色区,单位: ×10-5 kg·(s·m2·hPa)-1]、 对流有效位能(b,单位: J·kg-1)、 700 hPa比湿(c,单位: g·kg-1)及整层大气可降水量(d,单位: kg·m-2)分布图(a)中矢量为700 hPa风场(单位: m·s-1) Fig.2 Divergence of water vapor flux at 700 hPa [a, color area, unit: ×10-5 kg·(s·m2·hPa)-1], convection effective potential energy (b, unit: J·kg-1), specific humidity at 700 hPa (c, unit: g·kg-1) and precipitable water vapor (d, unit: kg·m-2) on 1 July 2018.In Fig.2(a), the vector denote wind field (unit: m·s-1) at 700 hPa |
3 GPM观测暴雨云团
3.1 强降水水平结构
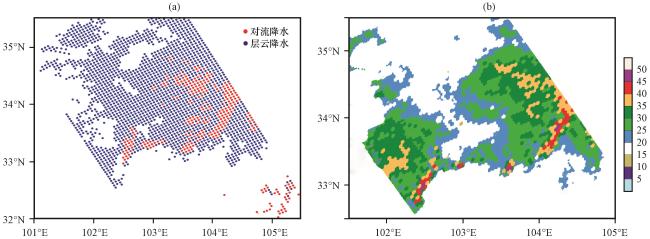
图5 GPM卫星水平观测: 对流降水(红色)和层云降水(蓝色)的样本分布(a)、 KuPR探测4.5 km反射率因子(b,单位: dBz)Fig.5 GPM horizontal observation: Sample distribution (a) of convective precipitation (red) and stratospheric precipitation (blue), reflectivity factor at a height of 4.5 km from KuPR detection (b, unit: dBz) |
表1 GPM 卫星降水样本数、 总降水率和平均降水率Table 1 Precipitation sample number, total precipitation rate and average precipitation rate of GPM satellite |
| 降水类型 | 样本数/个 | 总降水率/(mm·h-1) | 平均降水率/(mm·h-1) |
|---|---|---|---|
| 对流降水 | 438 | 2650.76 | 6.05 |
| 层云降水 | 1906 | 845.34 | 0.44 |
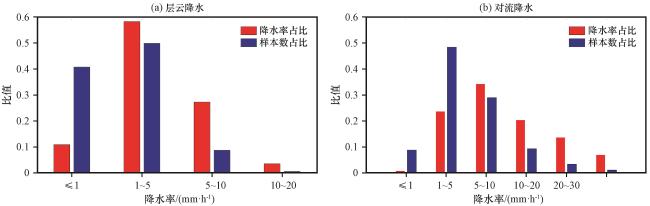
图6 层云降水(a)和对流降水(b)的地面雨强频率分布Fig.6 The near-surface rainfall intensity distribution of stratiform precipitation (a) and convective precipitation (b) |
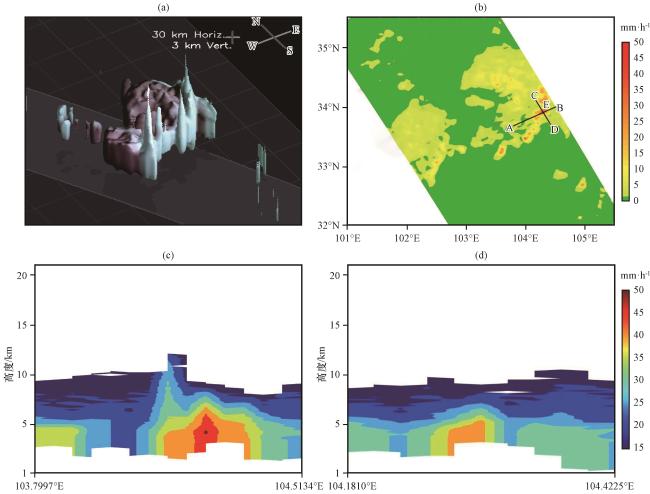
图7 用GPM观测的2 mm·h-1降水率等值面绘制的三维结构示意图(a)、 整层平均降水率(b)、 降水率沿图(b)中AB线段(c)以及沿CD线段(d)的剖面(单位: mm·h-1)Fig.7 Three-dimensional structure drawn with 2 mm·h-1 precipitation rate (a) of GPM vertical observation, average precipitation rate of the whole layer (b), section of precipitation rate along line AB (c) and CD (d).Unit: mm·h-1 |
3.2 强降水垂直结构
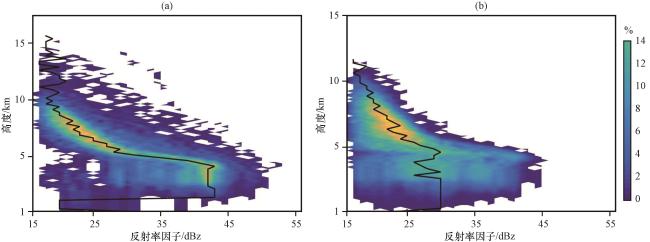
3.3 雷达反射率因子垂直分布
4 FY-4A观测暴雨云团
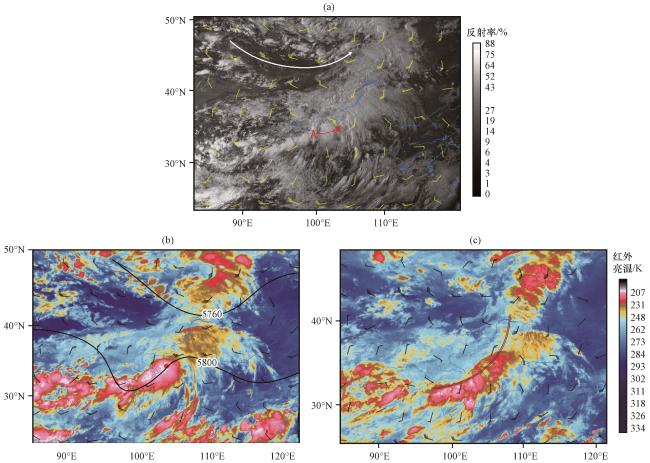
图9 FY-4A卫星云图与Interim数据叠加的2018年7月1日17:00 700 hPa风场(a,风羽, 单位: m·s-1)、 20:00 500 hPa风场(风羽, 单位: m·s-1)及高度场(黑色实线, 单位: gpm)(b)、 7月2日02:00红外云图叠加700 hPa风场(c,风羽, 单位: m·s-1)图(a)中白色箭头代表干侵入,红色箭头代表对流云团A从10:00 -20:00 的移动轨迹;图(c)中棕色双实线代表切变线 Fig.9 The wind field of 700 hPa at 17:00 (a, barb, unit: m·s-1), the wind field (barb, unit: m·s-1) and height field (black solid line, unit: hPa) of 500 hPa at 20:00 (b) on 1 July 2018 and 700 hPa wind field (barb, unit: m·s-1) at 02:00 on 2 July 2018 (c).In Fig.9(a), the white and red arrow line denote dry intrusion and track of cloud cluster A from 10:00 to 20:00, respectively.In Fig.9(c), the double solid brown lines represent the shear lines |
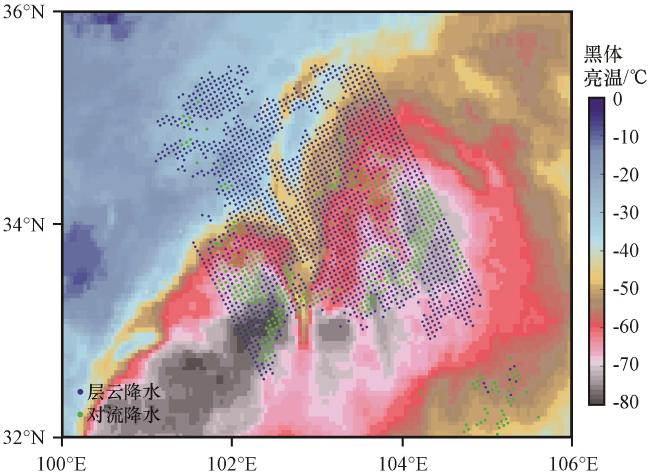
图10 2018年7月1日21:30 FY-4A黑体亮温(彩色区,单位: ℃)叠加GPM-KuPR轨道观测降水样本分布(像素点,蓝色代表层云降水,绿色代表对流云降水)Fig.10 FY-4A infrared cloud map (color area, unit: ℃) superimposed with precipitation sample distribution observed by GPM-KuPR [pixel, stratospheric (blue) and convective (red) precipitation] at 21:30 on 2 July, 2018 |