

1 引言
2 资料来源与方法介绍
2.1 资料来源
2.2 方法介绍
3 陕西省冬季霾日数的年际变化
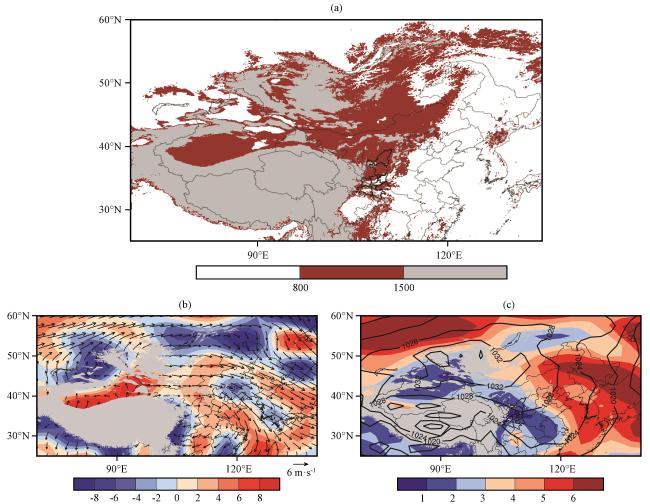
图 1 陕西及周边地形(a, 单位: m), 1980 -2016年冬季平均925 hPa风场(矢量, 单位: m·s-1)和散度场(彩色区, 单位: ×10-6 s-1)(b), 以及海平面气压场(等值线, 单位: hPa)和925 hPa平均风速(彩色区, 单位: m·s-1)(c)分布灰色区域为海拔超过1500 m的区域 Fig.1 Topographic map of Shaanxi and its surrounding areas (a, unit: m), climatological winter mean wind (vector, unit: m·s-1) and divergence (color area, unit: ×10-6 s-1) at 925 hPa (b), composite SLP (contour, unit: hPa) and wind speed (color area, units: m·s-1) at 925 hPa in winter (c) from 1980 to 2016.Grey area indicates the altitude above 1500 m |
4 环流异常特征
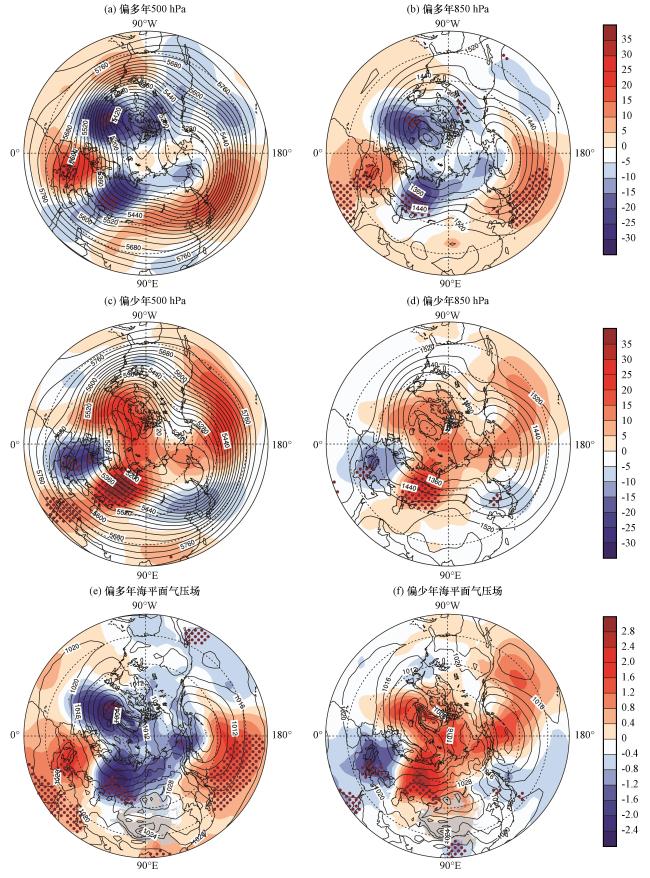
图3 冬季霾日数偏多年(a, b)和偏少年(c, d)高度场 (等值线, 单位: gpm)及其距平合成(彩色区, 单位: gpm), 冬季霾日数偏多年(e)和偏少年(f)海平面气压场(等值线, 单位: hPa)及其距平合成场(彩色区, 单位: hPa)分布打点区表示通过90%的信度检验; 灰色区域为海拔超过1500 m的区域 Fig.3 Distribution of composite geopotential height (contour, unit: gpm) and its anomaly (color area, unit: gpm) distribution of the years for the high (a, b) and the low (c, d) frequencies of haze days, composite SLP (contour, unit: hPa) and its anomaly (color area, unit: hPa) distribution of the years for the high (e) and the low (f) frequencies of haze days in winter.The dots represent statistical significance exceeding the 90% confidence level, grey area indicates the altitude above 1500 m |
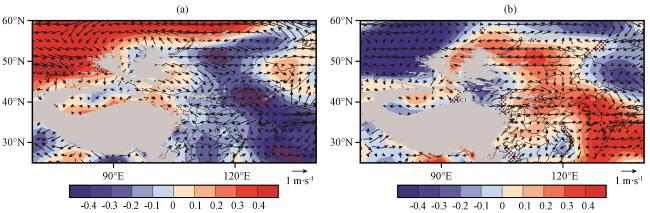
图4 冬季霾日数偏多年(a)和偏少年(b)925 hPa 风场距平(矢量, 单位: m·s-1)和风速距平合成场(彩色区, 单位: m·s-1)打点区表示通过90%的信度检验; 灰色区域为海拔超过1500 m的区域 Fig.4 Distribution of composite wind anomaly (vector, unit: m·s-1) and wind speed anomaly (color area, unit: m·s-1) the years for the high (a) and the low (b) frequencies of haze days on 925 hPa.The dots represent statistical significance exceeding the 90% confidence level, grey area indicates the altitude above 1500 m |
5 欧亚大陆积雪深度异常与霾日数
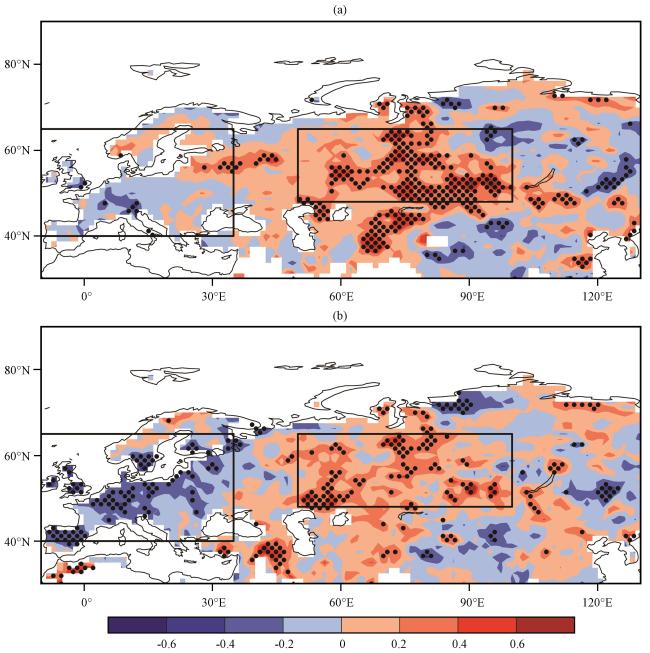
图5 冬季陕西霾日数与前期11月(a)与冬季(b)欧亚大陆积雪深度的相关场黑点区域表示通过90%的信度检验; 矩形框分别表示40°N -65°N, 10°W -35°E和48°N -65°N, 50°E -100°E Fig.5 The correlation coefficient distribution of the November (a) and winter (b) snow depth with the winter haze days.The dots represent statistical significance exceeding the 90% confidence level.The rectangles represent the areas of 40°N -65°N, 10°W -35°E and 48°N -65°N, 50°E -100°E |
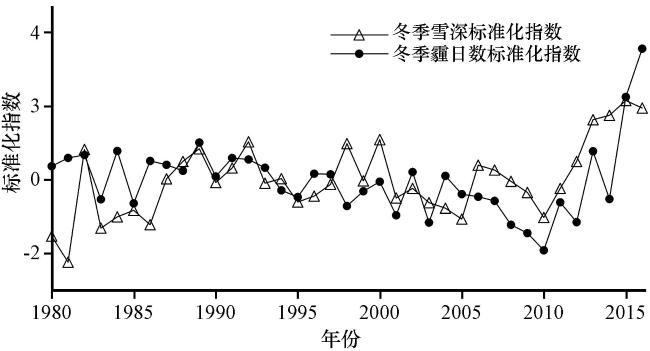
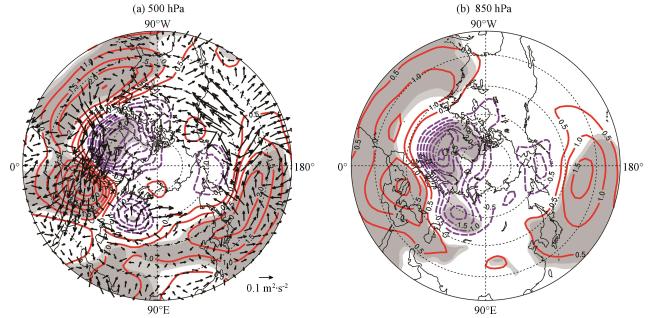
图7 冬季500 hPa(a)和850 hPa(b)位势高度场(等值线, 单位: gpm)对冬季积雪深度指数的回归系数及500 hPa所对应的波作用通量(矢量, 单位: m2·s-2)深浅阴影表示通过95%和90%的信度检验 Fig.7 The regression coefficients of geopotential height (contours, unit: gpm) and horizontal component of the 500 hPa wave-activity flux (vector, unit: m2·s-2) by snow depth index on 500 hPa (a) and 850 hPa (b) in winter.The darker(lighter) shaded represents statistical significance exceeding the 95% (90%) confidence level |
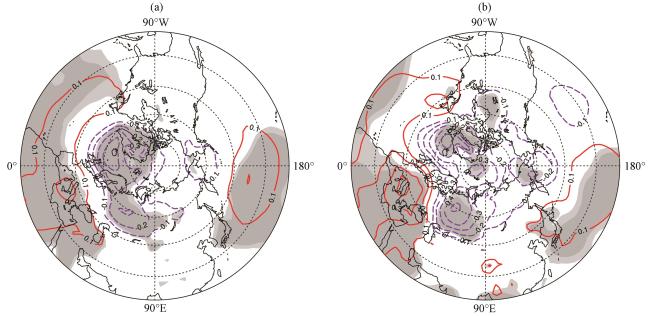
图8 冬季海平面气压(等值线, 单位: hPa)对冬季积雪深度指数(a)及冬季陕西省霾日数时间序列(b)的回归系数深浅阴影表示通过95%和90%的信度检验 Fig.8 The regression coefficients (contour, unit: hPa) of sea level pressure by snow depth of winter (a) and the frequencies of haze days in Shaanxi Province in winter (b).The darker (lighter) shaded represents statistical significance exceeding the 95% (90%) confidence level |
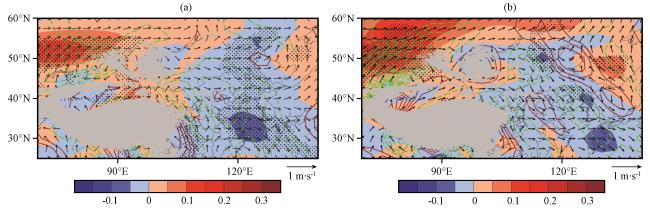


图 9 925 hPa风场(矢量, 单位: m·s-1), 散度场(等值线, 单位: ×10-6 s-1, 等值线间隔为0.04×10⁻⁶ s-1), 风速(彩色区, 单位: m·s-1)对冬季积雪深度指数(a)及陕西省冬季霾日数时间序列(b)的回归系数打点区域表示通过了90%的信度检验; 灰色区域为海拔超过1500 m的区域 Fig.9 The regression coefficients of wind (arrow, unit: m·s-1), divergence (contour, unit: ×10-6 s-1, the contour interval is 0.04×10⁻⁶ s-1), wind speed (color area, unit: m·s-1) on the snow depth index (a) and the frequencies of haze days (b) in winter.The dots represent statistical significance exceeding the 90% confidence level and the grey area indicates the altitude above 1500 m |