
1 引言
随着大气环境治理体系日趋完善和能源结构调整, 污染物的季节构成发生较大变化, 大气中PM2.5和PM10等颗粒物含量得到较为有效的控制, 然而挥发性有机物和氮氧化物等臭氧前体物的排放导致近地面大气臭氧(O3)浓度明显上升(Tie et al, 2009, 2013; Li et al, 2014; 李书博等, 2015; 王红丽, 2015; Zhang et al, 2015; 李苹等, 2019)。已有的观测事实表明, O3浓度的增加对人体健康、 生态环境以及农业生产产生了重要影响, 由此引起O3污染已经变成环境治理亟需面对的重要问题(Bell et al, 2004; Wang et al, 2005; 廖志恒等, 2015; Zhang et al, 2016)。
高浓度O3作为二次污染的特征产物(Fishman et al, 1978), 在人口密集和城市化较快的区域较为突出, 围绕京津冀、 长三角以及珠三角城市群开展的观测研究表明, 随着气候变化和排放加剧, 主要城市群的臭氧浓度和超标率逐年增加(Wang et al, 2006; Zhang et al, 2008; Lu et al, 2010; 邓雪娇等, 2011; Shao et al, 2011; 张芳等, 2016)。针对O3及前体物的时空变化特征及短时间尺度的定性相关分析和模式模拟等方面的研究显示, O3浓度具有较强的季节性变化和空间集聚特征(陆克定等, 2010; 沈劲等, 2017)。由于空气污染物的分布及集聚与地理属性密切相关(Schabenberger et al, 2005), 因此借助空间统计学方法来研究污染物的分布规律成为热点(贺冉冉等, 2017)。同时, 气温、 日照、 相对湿度和风速等大气环境因子与O3及前体物关系密切, 并对季节性变化以及化学过程影响显著(张浩月等, 2014; 廖志恒等, 2015; 黄俊等, 2018; 刘姝岩等, 2018)。针对气象条件对不同时间尺度下污染物变化趋势的影响研究中Kolmogorove Zurbenko(KZ)滤波法得到广泛应用, 通过对大气污染物时间序列进行分解可分析气象因子对不同时间尺度污染物分量的影响, 并在颗粒物、 O3以及氮氧化物的研究中发挥了作用(Rao et al, 1994; Porter et al, 2002; 徐鸣等, 2008; 朱佳等, 2010; 高晋徽等, 2012; 白鹤鸣等, 2015)。
针对不同城市群的研究表明, 由于受下垫面、 前体物排放、 区域传输以及气象环境等因素影响, O3的时空特征以及与当地气象因子的关系表现出明显的区域性差异(李霄阳等, 2018)。汾渭平原作为中西部地区能源供给和城市聚集区, 近年来大气污染问题日趋严重, 已成为继京津冀和长三角之后确定的环境综合治理第三大重点区域。目前该区域大气环境方面的相关研究主要着眼于空气质量、 PM2.5等颗粒物(李雁宇等, 2020 ), 围绕O3的研究还仅局限在部分重点城市(刘松等, 2017), 针对汾渭平原城市群的研究开展较少。本研究基于2014-2019年汾渭平原近地面O3及其前体物的连续观测数据, 总结O3长时间序列及空间分布变化规律, 揭示气象因子在不同时间尺度上的影响特征, 以期为科学应对污染防控策略的制定, 推进区域产业布局调整提供重要科学参考。
2 资料选取和方法介绍
2.1 研究区域及资料选取
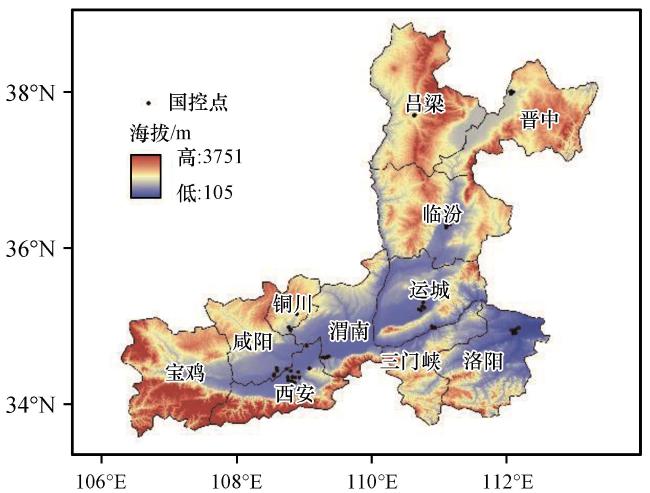
汾渭平原是汾河平原、 渭河平原及其台塬阶地的总称, 呈东北-西南方向分布, 北起山西省代县, 南抵陕西省秦岭山脉, 西至陕西省宝鸡市, 长约760 km, 宽40~100 km, 其主要城市包括陕西省的西安、 咸阳、 渭南、 宝鸡、 铜川, 山西省的吕梁、 晋中、 运城、 临汾, 河南省的洛阳、 三门峡等11个市。行政划分数据来源于中国基础地理信息数据库, 数字高程(DEM)来源于国际农业研究磋商组织官网发布的SRTM90 m分辨率数据。
研究所用的空气质量数据来源于中国环境监测总站(http: //www.cnemc.cn/)2015 -2019年的监测数据, 包括汾渭平原11个城市的逐日空气质量指数AQI(Air Quality Index)值, 以及主要污染物PM2.5、 PM10、 NO2、 O3、 SO2和CO等6项监测指标的逐小时数据。其有效值和城市日均浓度计算方法及评价标准参考《环境空气质量标准》(GB3095-2012)(环境保护部, 2012a)和《环境空气质量指数(AQI)技术规定》(环境保护部, 2012b)。其中O3浓度日均值指日最大8 h平均值, 浓度数据有效值控制为8 h平均不低于6个时次观测数据。
气象数据来源于国家气象信息中心, 包括2015 -2019年11个城市对应的最低气压(单位: hPa)、 最高气压(单位: hPa)、 平均气压(单位: hPa)、 最低气温(单位: ℃)、 最高气温(单位: ℃)、 平均气温(单位: ℃)、 平均风速(单位: m·s-1)、 最大风速(单位: m·s-1)、 最小相对湿度(单位: %)、 平均相对湿度(单位: %)、 日照时数(单位: h)、 降水量(单位: mm)和混合层高度(单位: m)等气象因子2015 -2019年的逐日数据。文中涉及的地图是基于国家测绘地理信息局标准地图服务网站下载的审图号为GS(2016)2885号的中国地图制作, 底图无修改。
2.2 研究方法
针对O3的观测数据, 总结归纳其年际、 季节以及月尺度变化特征, 采用Global Moran's I和Getis-Ord Gi *指数, 揭示汾渭平原O3污染的空间集聚和冷热点区域的时空特征。利用KZ滤波方法将臭氧观测时间序列分解为长期分量、 季节分量及短期分量序列, 其中长期分量主要由污染物排放总量、 气候变化和经济活动等因素引起, 季节分量主要由气象条件的季节变化和污染源决定, 而短期分量主要由天气变化和污染物短期排放波动引起(Rao et al, 1994)。通过分析分离的各组分与原始观测序列的差别揭示臭氧生成的潜在趋势, 并采用皮尔森(Pearson)相关分析揭示不同时间尺度下影响O3浓度的关键气象因子。其中Global Moran's I和Getis-Ord Gi * 、 KZ滤波方法、 皮尔森(Pearson)相关分析具体如下:
2.2.1 空间自相关
空间自相关是检验某一要素的属性值是否显著地与其相邻空间点上的属性值相关联的重要指标(Schabenberger et al, 2005; 贺冉冉等, 2017)。全局自相关用于从区域整体上描述O3浓度空间分布的集聚, 同时运用局部自相关测度来揭示可能的空间变异性, 将相邻要素相关性划分为5类“高-高”聚集、 “高-低”聚集、 “低-低”聚集、 “低-高”聚集和“不显著”, 以确切揭示集聚发生的具体空间位置。其中, 全局自相关用Global Moran's I指数来衡量, 公式如下:
式中: n为研究区域的空间样本个数; 和 表示空间样本单元的相应属性值; 为样本平均值; Wij是空间权重系数矩阵, 表示空间单元的邻近关系。Moran's I介于[-1, 1]之间, 越接近-1, 表明相异属性的空间单元越集中, 反之越接近1表明具有相似属性的空间单元越集中。而若Moran's I值越接近0, 表明空间的单元属性属于无集聚特征的随机分布状态。局部自相关采用Getis-OrdG* i模型通过分析局部区域信息可判断区域内的空间异质性, 来确定O3浓度的冷点与热点区域。公式如下:
式中: 和 是其理论期望和理论方差, 若 显著且为正, 表明位置i周围的值高于均值属空间高值集聚区即“热点”区, 反之为“冷点”区。
2.2.2 KZ滤波方法
KZ滤波是一种时间序列分析的方法, 利用KZ滤波方法分离出对空气质量浓度的气象影响, 可以检查其潜在的趋势, 其优点在于计算方法简单, 具有较好的分离特性、 简单性和处理缺失数据的能力(Zurbenko et al, 1986)。将原始序列X(t)表示为:
式中: e(t)、 S(t)、 W(t)分别表示长期分量、 季节分量和短期分量, 其中长期分量e(t)和季节分量S(t)之和定义为基线分量X baseline(t)。由此可以看出, 季节分量S(t)为基线分量X baseline(t)与长期分量e(t)的差, 短期分量W(t)为原始序列X(t)与基线分量X baseline(t)之差。KZ滤波属于低通滤波, 过滤器算法来自离散函数的高阶导数定义, 其运算定义为连续的m个数值通过移动平均值进行k次迭代, 直到所需频率下的组分被分离为止:
式中: Yi为某一要素经KZ滤波后的时间序列; m为滑动窗口长度; i为序列时间间隔; j为滑动窗口变量; k为Xi在滤波时其两端的滑动窗口长度。KZ ( m , p )即滑动窗口为m且经过p次迭代, 调整窗口长度m和迭代次数p可以控制不同尺度过程的滤波。
研究表明, KZ (15, 5)的有效滤波宽度为33天, 因此可以滤除周期小于33天的数据, 对原始序列应用KZ (15, 5)滤波能够去除时间序列的短期分量W(t)以提取基线分量X baseline(t), 即长期和季节时间尺度下某一要素的变化趋势(Rao et al, 1994; 秦人洁等, 2019; 吴宜航等, 2016)。KZ (365, 3)的有效滤波为632天, 即将周期小于1.7年的波动滤除获得臭氧长期分量e(t)(Rao et al, 1994; Wang et al, 2017)。因此, O3原始序列通过式(5 )~(8 )可以分离出O3的长期分量、 季节分量和短期分量:
2.2.3 Pearson相关分析
皮尔森(Pearson)相关也称皮尔森积矩相关系数, 用来反映两个变量线性的相关程度。相关系数的取值在-1~1, 若相关系数大于0表明两个变量是正相关, 反之为负相关。通常情况下若相关系数介于0.8~1.0表示两个变量极强相关、 0.6~0.8强相关、 0.4~0.6中等程度相关, 0.2~0.4弱相关, 0.0~0.2表示极弱相关或无相关。
3 结果与分析
3.1 臭氧污染的时间变化特征
3.1.1 观测序列变化特征
由GB3095-2012统计2015 -2019年汾渭平原11个城市O3不同污染等级出现站次[图2(a)]可以看出, 超标站次总体呈现逐年波动增加趋势, 2015年轻度以上污染为113个站次, 但到2017年超标达到了766个站次, 到2019年虽然略有减少但超标也达到了591个站次。其中中度以上污染天数2015年仅为4个站次, 2016年增加为29个站次, 到2017年达到了175个站次, 2018年降至42个站次, 2019年又增至61个站次。重度污染以上天数仅在污染较重的2017年和2019年分别出现了22和1个站次。总体上来看, 2015 -2019年全区超标站次增长率为每年114个站次。
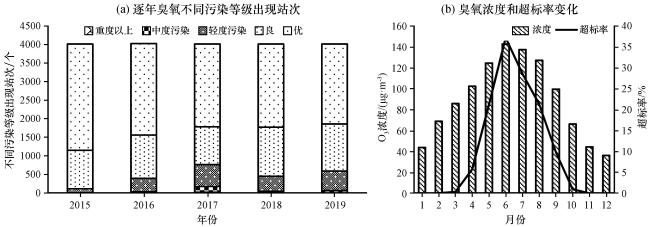
季节和月尺度的变化特征[图2(b)]来看, 汾渭平原11个城市中臭氧作为首要污染物的占比在夏季达到了76%, 春季次之为26%, 秋季则仅占15%, 而冬季基本没有出现单独O3超标的现象。由于秋冬季气温和光照条件不利于臭氧生成, 因此浓度相对较低。而春夏季节受区域性传输及近地面大气环境促使光化学反应增强等因素影响, O3浓度均值较秋冬季明显增加。尽管如此, 从整体变化趋势看秋冬季臭氧的平均浓度也呈现逐年增加趋势。O3浓度高值主要出现4 -9月, 均值超过一级标准100界限值, 超标天数超过10%, 其中5 -8月的污染程度最高, 超标率达到了20%以上, 而最为严重的6月O3超标达到了37%。总体上, 汾渭平原的臭氧污染以轻度为主, 6月最为严重, 轻度及中度以上污染超标率呈现增加趋势。
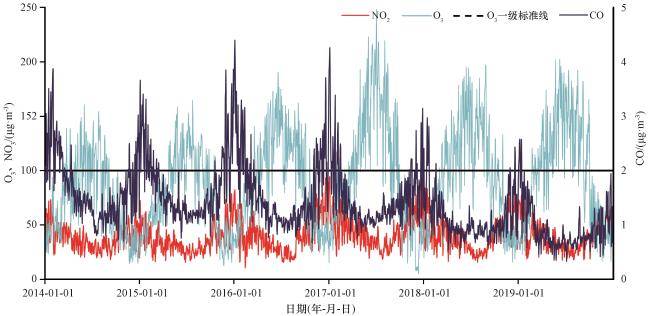
从O3和其前体物的长序列变化趋势(图3)对比来看, CO和NO2的浓度变化与O3相反, 呈现明显的反位相对应趋势, 在冬半年较高而夏半年维持较低浓度。NO2是影响近地面O3生成速率的重要前体物质, 在秋季总体浓度偏高, 而冬季CO的浓度较其他季节偏高明显。同时, 从变化趋势看, 与臭氧浓度逐年增加的趋势不同, NO2的年际变化并不明显, 一般维持在40 μg·m-3左右, 而CO的浓度减少比较明显, 从2015年的1.69 mg·m-3一直降低到2019年的0.93 mg·m-3。
3.1.2 分解序列变化特征
从各分解分量方差对总方差的贡献率分析(表1)可以看出, O3观测序列经分解后的三个分量方差之和对原始序列方差贡献大多在71%~75%。其中季节分量的贡献率最高, 介于38%~43%, 平均达到了40%, 其次为短期分量平均为24%, 而长期分量对原始序列的方差贡献率最小, 为5%~18%。表明污染物浓度原始时间序列的波动中季节和短期分量的影响占到主要作用, 其浓度的时间变化由污染前体物排放和气象条件的季节和短期波动引起, 而长期排放以及气候背景的变化可能不是引起汾渭平原O3浓度波动的主因。同时, 各分量的贡献率在汾渭平原不同城市之间的差异较小, 表明影响O3污染的成因在该区域较为相似。
表1 各分解分量方差对总方差的贡献率Table 1 Contribution to the total variance of each component created by the KZ filter to the original air quality data |
| 主要城市 | 短期分量 | 季节分量 | 长期分量 | 各分量方差之和 |
|---|---|---|---|---|
| 宝鸡 | 29.90% | 38.89% | 6.39% | 75.18% |
| 洛川 | 24.27% | 40.77% | 8.39% | 73.43% |
| 临汾 | 18.49% | 37.77% | 18.67% | 74.93% |
| 三门峡 | 27.15% | 41.48% | 4.92% | 73.55% |
| 铜川 | 29.90% | 38.29% | 5.85% | 74.05% |
| 渭南 | 24.00% | 41.57% | 7.83% | 73.40% |
| 西安 | 24.31% | 42.61% | 7.01% | 73.92% |
| 咸阳 | 26.32% | 39.63% | 8.95% | 74.89% |
| 晋中 | 18.92% | 41.01% | 10.78% | 70.71% |
| 运城 | 20.31% | 38.25% | 12.59% | 71.15% |
| 吕梁 | 18.95% | 38.64% | 13.79% | 71.38% |
| 均值 | 23.87% | 39.90% | 9.56% | 73.33% |
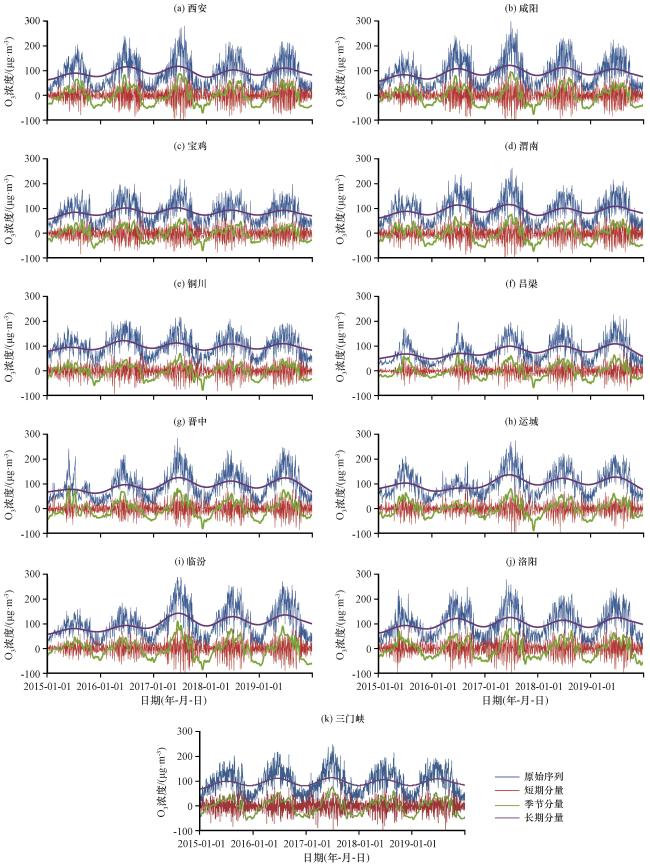
深入分析各分量的长期序列变化(图4)发现, 各城市的短期分量变化存在频繁震荡但周期并不明显, 震荡幅度在春夏季变大秋冬季变小, 由于污染排放量在周期范围33天内短期变化较小, 因此O3浓度的短期频繁波动可能主要由当地的气象条件变化引起, 而春夏季节汾渭平原的气象环境变化较为剧烈, 大气稳定度差, 其震荡幅度也相应变大。季节分量是由于太阳高度角变化引起的污染源和气象条件的季节变化, 表征时间尺度介于短期分量和长期分量之间的O3浓度波动。各城市季节分量的变化波动变化趋势基本一致, 夏季气温高辐射强出现波峰而在冬季均出现波谷, 从变化幅度看, 臭氧污染最重的2017年各城市季节分量变化波动最为剧烈, 与观测的原始序列特征一致, 也表明季节分量是O3浓度变化的主因。长期分量主要由污染物排放总量、 污染物运输、 气候、 政策或经济活动等因素引起, 通过使用KZ (365, 3)滤波器从数据中提取长期分量, 其有效滤波宽度大约为632天, 反映出周期大于1.7年的O3浓度波动, 长期分量的变化呈现波动增加趋势但年际差异较小, O3浓度相对较高的运城、 洛阳和铜川其长期分量均值较高, 但O3污染最重的2017年只有山西和河南的6个城市长期分量高, 关中城市群的长期分量变化并不明显, 因此O3污染的形成在不同区域的成因可能是排放与气象条件的叠加效应引起。
3.2 臭氧空间分布特征
从年均浓度的空间分布看, 处在河南和山西交界区域的运城、 洛阳和三门峡以及关中北部区域的铜川年均浓度相对较高, 而汾渭平原北部的吕梁和关中的宝鸡、 西安和咸阳则相对较低。汾渭平原地处生态环境脆弱区, 南部有秦岭高大地形遮挡, 北部为黄土高原, 人口和主要工业区主要集中在地势平坦的平原地区, 产业和能源结构层次较低, 煤化占比90%以上。运城、 洛阳和三门峡的O3高浓度区与人口分布和地理位置有关, 特别是三门峡和运城之间的平原区以及洛阳盆地的人口密集区污染水平总体较高, 表现出由平原向南北两侧递减趋势。关中北部区域的铜川主要由于第二产业占比较高, 前体物排放较其他区域突出, 而处于汾渭平原城市群边界区域的吕梁和宝鸡等地O3污染水平相对较低。利用空间自相关逐年进行分析(表2)可以看出, 除2015年外其他年份全局自相关Moran's I 和Z 值(表2)均通过了0.05的显著性检验, 说明O3浓度在空间上具有较为明显的集聚特征。由于全局的Morans's I 指数可能掩盖空间自相关特征的空间异质性, 所以通过Getis-OrdG* i模型探测O3集聚模式和位置, 表明高-高聚集主要分布在运城、 临汾、 洛阳和三门峡, 高聚集区处于三省交界地带, 还可能与政策缺乏协同规划有关。低-低集聚主要分布在关中核心城市宝鸡、 西安和咸阳等地, 其余低-高集聚或高-低集聚均未通过显著性检验。另外, 可以看出无论Moran's I指数和Z值都在逐年增大, 表明空间集聚特征越来越明显。
表2 汾渭平原不同年份臭氧空间自相关分析Table 2 O3 spatial autocorrelation analysis of Fenwei Plain in different years |
| 参数 | 2015 | 2016 | 2017 | 2018 | 2019 |
|---|---|---|---|---|---|
| Moran's I | 0.0756 | 0.579 | 0.715 | 0.727 | 0.8124 |
| Z值 | 1.0871 | 6.8169 | 8.0929 | 8.671 | 9.4471 |
| 热点 | 未通过 | 铜川、 洛阳 | 运城、 临汾 | 运城、 临汾 | 运城、 临汾、 洛阳、 三门峡 |
| 冷点 | 未通过 | 运城 | 西安、 宝鸡 | 宝鸡、 西安、 咸阳 | 宝鸡、 西安、 咸阳 |
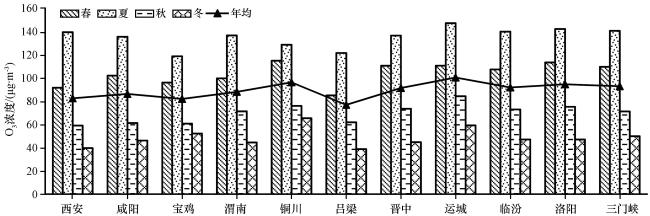
同时, O3浓度的空间分布有较强的季节性(图5), 冬、 春和秋季铜川和运城的平均浓度较高, 而夏季运城和洛阳O3浓度相对较高, 铜川平均浓度偏低。与平均浓度的空间分布不同, 超标率主要决定于O3的浓度极值和高浓度日数分布, 超标率的空间分布在不同季节较为统一, 陕西的5个城市以及山西吕梁年均超标率不到10%, 特别是处在汾渭平原边界区域的宝鸡和吕梁在O3污染最为严重的夏季超标率都不足15%。而洛阳以及山西的临汾和运城年均超标率都达到了14%以上, 夏季超标日数更是超过了35%。
3.3 气象环境对臭氧浓度的影响
通过对O3浓度原始序列及不同分量与各气象要素的相关关系分析表明(表3), 气温(T)、 日照时数(S)、 气压(P)和混合层高度(ABL)与O3浓度的相关性最为突出, 且在不同区域及对不同分量的影响较为一致, 除了与气压呈显著负相关外, 与气温、 日照和混合层高度均呈显著正相关。通过分析可以看出气温在各因子中对O3浓度的影响最为突出, 相关性也最高, 特别是对季节分量和长期分量的影响最为明显, 而日照则对短期分量的影响最为显著。混合层高度增加一方面有利于前体物扩散而抑制臭氧生成, 另一方面由于混合层高度与气温正相关性极高, 而气温升高则有利于光化学反应形成臭氧。降水(R)对长期分量和季节分量的相关系数基本都在0.1以下, 相关性极弱。从对短期分量的影响来看, 降水主要通过减小辐射和增加溶解间接影响O3浓度, 但其总体相关性可能与降水量级以及时长有关。与之对应的是相对湿度, 除对短期分量表现明显的负相关外, 对其他分量的影响在不同区域均不太一致或不明显(未通过0.05的显著性检验)。风速(Ws)对O3浓度及不同分量的相关性较弱且表现明显的区域性差异。
表3 汾渭平原及代表城市臭氧浓度与气象因子的相关系数Table 3 Correlation coefficient of ozone concentration and meteorological factors in Fenwei Plain and representative cities |
| 参数 | 城市 | P | R | T | RH | Ws | S | ABL |
|---|---|---|---|---|---|---|---|---|
| 原始序列 | 洛阳 | -0.692** | -0.057* | 0.761** | -0.041 | -0.096** | 0.465** | 0.470** |
| 西安 | -0.731** | -0.045* | 0.806** | -0.250** | 0.124** | 0.579** | 0.603** | |
| 吕梁 | -0.676** | 0.037 | 0.772** | -0.049 | 0.170** | 0.342** | 0.475** | |
| 汾渭平原 | -0.252** | -0.038** | 0.733** | -0.174** | 0.139** | 0.489** | 0.548** | |
| 长期分量 | 洛阳 | -0.575** | 0.060** | 0.581** | 0.106** | -0.108** | 0.168** | 0.313** |
| 西安 | -0.567** | 0.095** | 0.631** | 0.029 | 0.117** | 0.176** | 0.455** | |
| 吕梁 | -0.476** | 0.154** | 0.563** | 0.080** | 0.042 | 0.096** | 0.330** | |
| 汾渭平原 | -0.208** | 0.076** | 0.509** | 0.005 | 0.186** | 0.164** | 0.380** | |
| 季节分量 | 洛阳 | -0.773** | 0.067** | 0.828** | 0.098** | -0.083** | 0.281** | 0.423** |
| 西安 | -0.799** | 0.087** | 0.851** | -0.114** | 0.188** | 0.384** | 0.571** | |
| 吕梁 | -0.748** | 0.109** | 0.848** | 0.045 | 0.178** | 0.245** | 0.481** | |
| 汾渭平原 | -0.261** | 0.073** | 0.806** | -0.039** | 0.113** | 0.310** | 0.483** | |
| 短期分量 | 洛阳 | -0.065** | -0.239** | 0.130** | -0.274** | -0.023 | 0.483** | 0.222** |
| 西安 | -0.103** | -0.263** | 0.151** | -0.374** | -0.065** | 0.569** | 0.216** | |
| 吕梁 | -0.100** | -0.204** | 0.107** | -0.251** | 0.110** | 0.368** | 0.139** | |
| 汾渭平原 | -0.029** | -0.225** | 0.131** | -0.314** | 0.018* | 0.498** | 0.244** |
**和*分别表示在 0.01和0.05 水平(双侧)上显著相关 |
通过对不同气象影响因子分段范围内的O3平均浓度的分析(表4)可以看出, 气温和日照的影响最为直接, 其中气温在35 ℃以上时O3的平均浓度为气温10 ℃以下时的3倍以上, 而日照时数在10 h以上时其浓度达到了无日照时的2倍以上。而相对湿度对应的O3浓度则较为复杂, 总体上看相对湿度越小浓度越大, 相对湿度在50%~60%时O3浓度最大, 但小于50%时O3浓度却会略有降低。风速主要通过影响大气稳定度对前体物的稀释与输送速率, 风速对二次污染物O3的作用比较复杂, 当风速较小时利于O3及其前体物的光化学生成和积聚, 表现在城市地面风速较小条件下容易产生高O3污染。随着风速不断增大时可能对前体物和O3产生扩散和稀释效应导致浓度下降。另一方面大范围的冷空气过程可能会导致跨区域和长距离输送, 对前体物和O3污染产生影响。同时, 不同级别的降水量对于颗粒物的清除效应差异较大, 分析可以看出不同降水等级对汾渭平原的O3浓度影响差异表现不太明显。
表4 不同气象要素范围内的臭氧平均浓度Table 4 The average concentration of ozone in different meteorological elements |
| T/℃ | O3/(μg·m-3) | S/h | O3/(μg·m-3) | RH/% | O3/(μg·m-3) | R/mm | O3/(μg·m-3) | Ws/(m·s-1) | O3/(μg·m-3) |
|---|---|---|---|---|---|---|---|---|---|
| T≥35 | 173 | S≥10 | 139 | RH>90% | 56 | R≥50 | 96 | Ws≥12 | 86 |
| 30<T<35 | 160 | 8≤S<10 | 97 | 80<RH≤90 | 68 | 50>R≥25 | 88 | 8≤Ws<12 | 96 |
| 25<T≤30 | 150 | 6≤S<8 | 90 | 70<RH≤80 | 86 | 25>R≥10 | 84 | 6≤Ws<8 | 99 |
| 20<T≤25 | 124 | 3<S≤6 | 85 | 60<RH≤70 | 97 | 10>R≥5 | 80 | 4≤Ws<6 | 96 |
| 10<T≤20 | 88 | 0<S<3 | 79 | 50<RH≤60 | 103 | 5>R≥0.1 | 81 | 2<Ws<4 | 82 |
| T≤10 | 52 | S =0 | 60 | RH≤50 | 94 | R =0 | 93 | Ws≤2 | 47 |
4 讨论与结论
4.1 讨论
臭氧作为二次污染物, 其浓度的变化受到前体物排放和大气环境复杂系统的综合影响, 时空特征及影响因子较为复杂。虽然汾渭平原O3及其前体物浓度的总体特征与中国其他城市群有一定的统一性(李霄阳等, 2018; 李苹等, 2019; 严晓瑜等, 2020), 但其时间变化的月尺度特征、 空间集聚特征以及不同时间尺度的影响都表现出区域差异。从O3及其前体物浓度的时间变化特征上看, 由于冬半年气温低、 辐射弱不利光化学反应生成O3而导致前体物积累, 而夏半年正好相反, 特别是夏季光照长、 辐射强、 温度高、 光化学反应异常活跃, 气象条件有利于NOx、 CO和VOCs等前体物转换为二次污染物O3(Wang et al, 2017; 屠厚旺等, 2020), 加之大气不稳定度较冬半年大, 利于污染物传输和扩散, 导致O3浓度持续累积均值较高, 因此出现O3浓度高而前体物浓度较低的反差, 11个城市中O3作为首要污染物的占比在夏季达到了76%。夏季O3日变化明显其均方差在各季节中表现为最大也从另外一方面验证了气象环境的剧烈变化对O3浓度的变化影响显著。而引起O3污染的前体物浓度年际变化特征一方面可能与排放有关, 另外一方面与气象条件是否适宜转化为二次污染物有一定关系。NOx和VOC与O3的形成呈现高度非线性关系, 且与两种前体物的比值有关。研究认为(漏嗣佳等, 2010; 肖娜等, 2020), 中国西部地区主要处于NOx控制区, 除自然界氮循环过程外, NOx与化石燃料占比密切相关, 而汾渭平原能源结构层次总体较低, 加之近年来机动车数量激增, 由此引起的NOx排放可能是导致O3污染居高不下的重要原因。但VOCs的影响仍然不可忽略, 近10年我国生物源挥发性有机物(BVOCs)年排放量下降, 而人为源挥发性有机物(AVOCs)和总排放(TVOCs)则逐年增加(高超等, 2019)。因此在臭氧治理体系中要密切关注交通运输、 溶剂使用和生物质燃烧等过程的VOCs人为源排放。利用空间自相关和Getis-OrdG* i模型结果表明, 汾渭平原O3浓度的空间集聚特征较为显著, 主要高-高聚集分布在运城、 临汾、 洛阳和三门峡, 从地理位置上看高聚集区位于汾渭平原中东部地带, 该区域人口和城市集聚度相对较高, 氮氧化物等前体物基础排放增加, 另外气象环境条件较汾渭平原其他区域更利于臭氧的生成和集聚。
已有研究大多只对O3浓度的原始序列进行分析可能会掩盖随着时间推移的污染物浓度的长期趋势变化, 一方面O3浓度与长期排放和气候背景有关, 另外一方面可能与短期或季节尺度的气象环境因子密切相关, 因此本文利用KZ滤波方法对观测的原始序列进行了分解, 以评估该区域臭氧浓度的不同尺度变化以便揭示其成因。可以看到, 汾渭平原臭氧浓度变化中季节和短期分量的影响占到主导作用, 其浓度的时间变化由污染前体物排放和气象条件的季节和短期波动引起, 而污染物排放总量、 气候变化和经济活动等因素的变化可能不是引起汾渭平原O3浓度波动的主因, 这种表现在各城市间较为一致。同时, O3浓度较高的区域其长期分量均值相对较高说明其前体物的基础排放维持较高水平, 而其他区域的年际变化虽有所波动但总体差异较小, 从另外一方面说明气象环境的影响凸显了叠加效应。
气象因子对O3浓度的影响相关研究有比较一致的结论, 从气象环境对汾渭平原不同典型区及不同分量的O3浓度相关分析看, 气温、 日照、 气压的相关性最显著且影响较为一致, 特别是气温和日照的相关性极高。究其原因, 辐射直接影响O3浓度的光化学反应和扩散传输过程, 而气温和日照则能直接反映出太阳辐射的变化, 气温升高光化学反应速率加快, 同时生物排放及前体物浓度集聚导致高浓度O3的形成, O3浓度的季节性变化与气温和日照的季节变化相适应。O3浓度的年际变化随着治理体系逐渐完善虽然在2018年有降低趋势, 但2019年又有所反弹, 主要原因可能与年际的气象环境变化有关。而与水汽有关的降水和相对湿度对O3的影响则较为复杂, 一方面水汽不仅在大气能量转换中发挥重要作用(王玫等, 2019), 同时与O3反应产生的自由基是大气光化学的重要触发机制, 高湿条件下光化学反应中消耗O3的反应过程占主导, 从而降低了近地面O3浓度。另一方面水汽增加易吸收太阳辐射减缓近地面光化学反应发生速率, 同时湿度增加利于O3沉降表现出明显的“清除”效应。本文仅基于已有的观测资料从统计学角度对O3浓度的时空特征及其与气象环境的关系进行了分析, 为开展防控工作提供了一些科学的参考。但在实际业务服务中还需要进一步结合天气系统分类, 综合应用卫星和雷达等多源资料, 揭示不同地区O3的成因及来源, 量化臭氧生成及前体物扩散天气过程中的预报因子等方面做更为深入的研究。
4.2 结论
(1) 时间尺度上, 近5年汾渭平原O3污染以轻度为主, 超标率呈逐年增加趋势且均有明显的季节性特征, 夏季最高春季次之, 而冬季没有出现单独O3超标现象。其中5 -8月的超标率达到了20%以上, 最为严重的6月达到37%以上。前体物与O3浓度表现出反位相变化, 其中CO逐年减少而NO2年际差异不大。
(2) 空间尺度上, O3浓度的集聚特征明显且逐年增强, 高聚集主要分布在运城、 临汾、 洛阳和三门峡, 低-低集聚主要分布在关中核心城市宝鸡、 西安和咸阳等地。
(3) O3浓度的时间变化主要由污染前体物排放和气象条件的季节及短期波动引起, 其中季节分量的贡献率达到了40%, 短期分量为24%, 而长期分量贡献率仅为5%~18%。O3浓度除了与气压呈显著负相关外, 与气温、 日照和混合层高度均呈显著正相关且在不同区域及不同分量的影响较为一致。相较而言, 相对湿度越低O3浓度越高, 但降水和风速对不同区域及不同分量的影响表现的不太一致。