
1 引言
2 暴雨实况
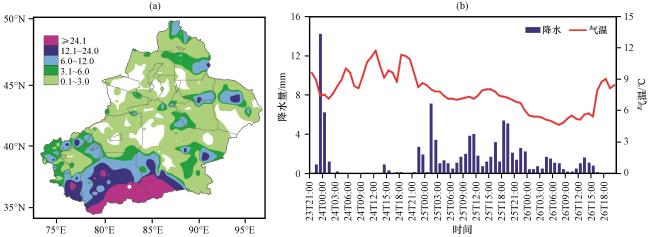
图1 2019年6月23日20:00至26日20:00新疆累计降雨(a, 单位: mm)和最大暴雨中心(a中白色圆点)逐小时降水和气温(b)变化Fig.1 The cumulative rainfall (a, unit: mm) hourly precipitation and temperature (b) change at Talekanlik Station in Ruokeya Township, Minfeng County in Xinjiang from 20:00 on June 23 to 20:00 on 26 June 2019 |
表1 2019年6月23日20:00至26日20:00昆仑山北坡3个暴雨代表点降水概况Table 1 Overview of precipitation at three representative points of heavy rain on the northern slope of Kunlun Mountain from 20:00 on 23 to 20:00 on 26 June 2019 |
| 最强暴雨代表站 | 累计雨量 /mm | 最强降雨日 | 最大小时降雨 | ≥0.1 mm 降雨 小时数/h | 小时雨强 ≥5 mm 小时数/h | ||||
|---|---|---|---|---|---|---|---|---|---|
| 日雨量 /mm | 日期 | 最大小时雨强 /(mm·h-1) | 出现时间 | ||||||
| 和田地区 | 策勒县 | 奴尔乡努尔河战斗渠渠首 | 80.3 | 61.3 | 25日 | 7.9 | 25日06:00 | 42 | 5 |
| 民丰县 | 若克雅乡塔勒坎勒克 | 97.6 | 54.1 | 25日 | 14.2 | 23日23:00 | 53 | 4 | |
| 巴州 | 且末县 | 阿羌乡依山干河 | 54.6 | 43.6 | 26日 | 16.0 | 25日00:00 | 36 | 1 |
3 环流形势及天气系统
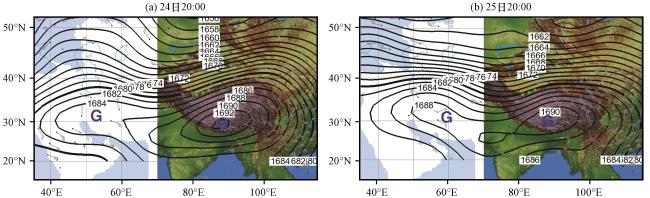
3.1 暴雨发生在100 hPa南亚高压双体型转青藏高压单体型后
3.2 500 hPa“两高夹一低”形势下多个天气系统共存与作用
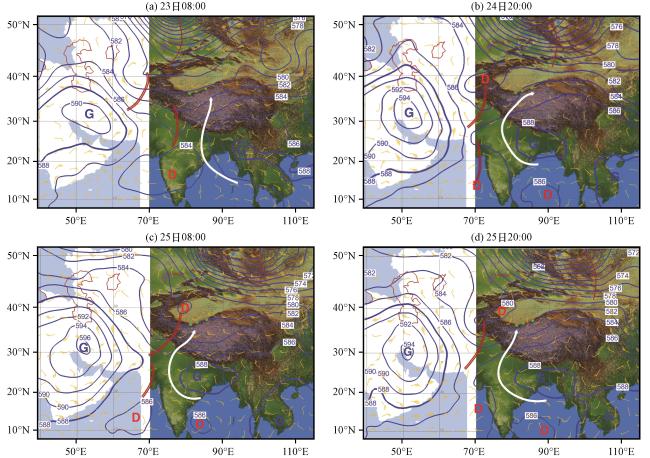
图3 2019年6月23 -26日500 hPa环流形势图(等值线, 单位: dagpm)棕色双实线为切变线, 白色带箭头实线为偏南气流, “D”和 “G”表示位势高度“低中心”和“高中心”, “●”为暴雨点 Fig.3 The 500 hPa circulation situation (contour, unit: dagpm) from 23 to 26 June 2019.Brown double solid line is the shear line, white solid line with arrow is the southerly airflow, “D” and “G” indicate the geopotential height “Low center” and “High center”, “●” is rainstorm spot |
表2 2020年6月23 -25日500 hPa西太副高和伊朗高压特征量值表Table 2 Characteristic values of 500 hPa West Pacific Subtropical High and Iranian High on June 23 -25, 2020 |
| 特征量 | 位置和强度 | 23日08:00 | 24日20:00 | 25日08:00 | 25日20:00 | |
|---|---|---|---|---|---|---|
| 西太副高 | 588 dagpm线闭合高压 | 西边界 | 92°E | 81°E | 78°E | 69°E |
| 中心位置 | 95°E、 22°N | 86°E、 22°N | 82°E、 24°N | 88°E、 23°N | ||
| 586 dagpm线 | 西边界 | 86°E | 79°E | 69°E | ||
| 伊朗高压 | 中心 | 强度/dagpm | 590 | 594 | 596 | 594 |
| 位置 | 53°E、 31°N | 52°E、 31°N | 52°E、 30°N | 51°E、 30°N | ||
| 588 dagpm线 | 东边界 | 63°E | 63°E | 68°E | 62°E |
4 偏西和偏南气流先后将水汽输送至昆仑山北坡并辐合
4.1 偏西和偏南路径的水汽输送
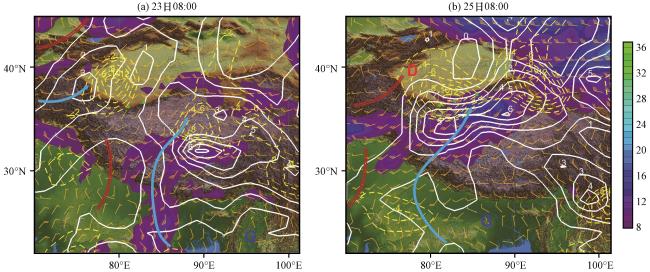
图4 500 hPa水汽通量(白实线, 单位: g·cm-1·hPa-1·s-1)、 水汽通量散度(黄虚线, 单位: g·cm-2·hPa-1·s-1)叠加风场(风矢量+填充, 单位: m·s-1)绿“●”为暴雨点 Fig.4 Superimposed 500 hPa water vapor flux (white solid line, unit: g·cm-1·hPa-1·s-1), water vapor flux divergence (yellow dotted line, unit: g·cm-2·hPa-1·s-1) and wind field (wind vector + filling, unit: m·s-1).Green “●” means rainstorm spot |
4.2 暴雨区高层和低层的水汽输送和辐合垂直结构
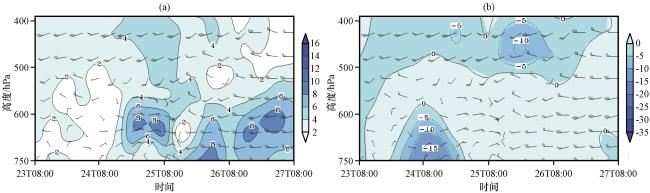
图5 2019年6月23日08:00至27日08:00沿(36.96°N、 82.84°E)的水汽通量[a, 单位: g·(cm·hPa·s)-1]和水汽通量散度[b, 单位: ×10-6·g·(cm2·hPa·s)-1]时间-高度垂直剖面Fig.5 Time-height vertical profile of water vapor flux [a, unit: g·(cm·hPa·s)-1] and divergence water vapor flux[b, unit: 10-6·g·(cm2·hPa·s)-1] along the edge (36.96°N, 82.84°E) from 08:00 on 23 to 08:00 on 27 June 2019 |
4.2.1 高空450 hPa附近为偏南路径的水汽输送和辐合
4.2.2 低层600 hPa以下有东风路径的水汽输送但无明显辐合
5 低层东风“冷垫”作用
5.1 使高层偏南风沿“冷垫”爬升而产生动力抬升
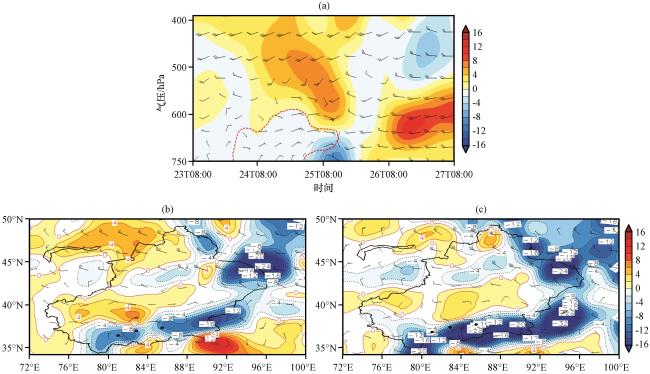
图6 2019年6月23日08:00至27日08:00温度平流(彩色区, 单位: ×10-5 ℃·s-1)叠加风场(风羽, 单位: m·s-1)时间-高度剖面(a)、700 hPa上6月25日14:00(b)和20:00(c)温度平流(彩色区, 单位: ×10-5 ℃·s-1)叠加风场(风羽, 单位: m·s-1)平面分布黑“●”为暴雨点 Fig.6 Time-height profile of temperature advection (color area, unit: ×10-5 ℃·s-1)) superimposed wind field (barb, unit: m·s-1) from 08:00 on 23 to 08:00 on 27 June 2019 (a), andthe plane distribution of 700 hPa temperature advection (color area, unit: ×10-5 ℃·s-1) superimposed wind field (barb, unit: m·s-1) at 14:00 (b) and 20:00 (c) on June 25 2019. The black "●" means rainstorm spots |
5.2 东风“冷垫”增厚加强和增湿使垂直方向冷暖交绥加剧
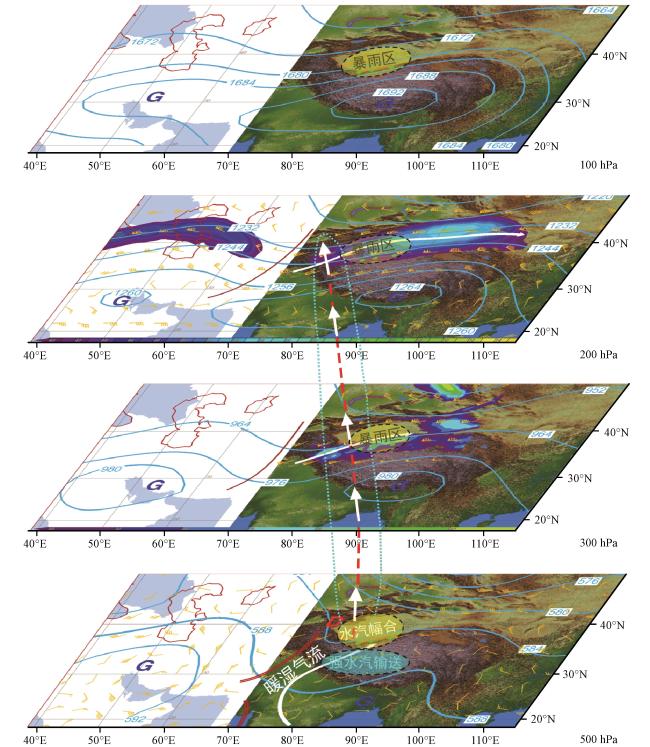
6 环流形势及天气系统的空间配置
图7 2019年6月24日20:00昆仑山北坡暴雨天气学概念模型蓝色实线为位势高度, 棕色双实线为切变线, 棕色单实线为槽线, 白色带箭头实线为偏南气流, “D”和“G”表示位势高度“低中心”和“高中心”, 填充区为≥40 m·s-1急流区, 绿“●”为暴雨点 Fig.7 Spatial configuration structure of multiple weather systems in the heavy rain on the northern slope of Kunlun Mountain at 20:00 on 24 June 2019.The blue solid line is the geopotential height, the brown double solid line is the shear line, the brown single solid line is the trough line, and the white solid line with arrow is the southerly airflow, “D”and “G” indicate the geopotential height “low center” and “high center”, the filling area is ≥40 m·s-1 jet stream area, The green “●” is rainstorm spot |