

1 引 言
2 过程概况
2.1 台风概况
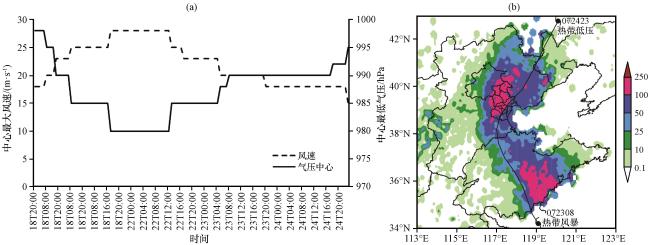
图1 2018年7月18日20:00至24日23:00台风安比中心气压和风速的时间变化(a)以及23日08:00至24日14:00累积降雨量空间分布(彩色区, 单位: mm)与台风移动路径(黑色实线)(b)Fig.1 Time change of air pressure and wind speed at the center of typhoon Ampil from 20:00 on 18 to 23:00 on 24 (a) and distribution of cumulative rainfall (color area, unit: mm) and movement path of typhoon (black solid line ) from 08:00 on 23 to 14:00 on 24 July 2018 (b) |
2.2 雨情实况
3 环流背景
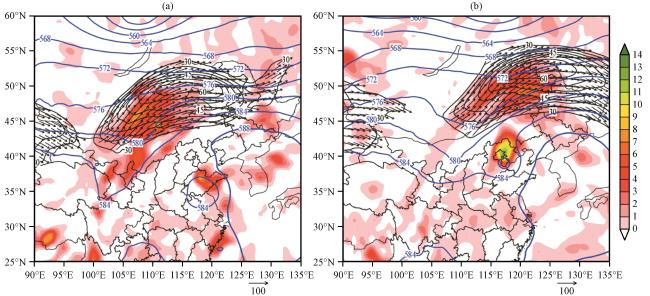
图2 2018年7月23日14:00 (a)和24日08:00 (b)的500 hPa高度场(蓝色等值线, 单位: dagpm)、 200 hPa急流(矢量, 风速≥30 m·s-1, 单位: m·s-1)和散度场(彩色区, 单位: ×10-5 s-1)Fig.2 Potential height at 500 hPa (blue contour, unit: dagpm) and jet core (vector, wind speed≥30 m·s-1, unit: m·s-1) and divergence field (color area, unit: ×10-5 s-1) at 200 hPa at 14:00 on 23 (a) and at 08:00 on 24 (b) July 2018 |
4 中尺度雨团和云团特征
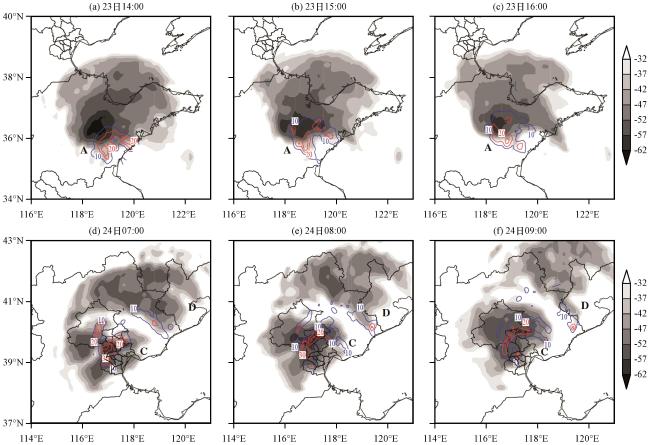
图4 2018年7月23日14:00 -16:00和24日07:00 -09:00的FY-2F的云顶亮温(阴影, 单位: ℃)和未来1 h降雨(蓝色和红色等值线, 单位: mm)空间分布字母A、 B、 C、 D代表对流云团 Fig.4 Spatial distribution of TBB of FY-2F (the shaded, unit: ℃) and rainfall in the next hour (blue and red contours, unit: mm) from 19:00 to 21:00 on 23 and from 07:00 to 09:00 on 24 July 2018.Letters A, B, C, D in the figure represent convective clouds |
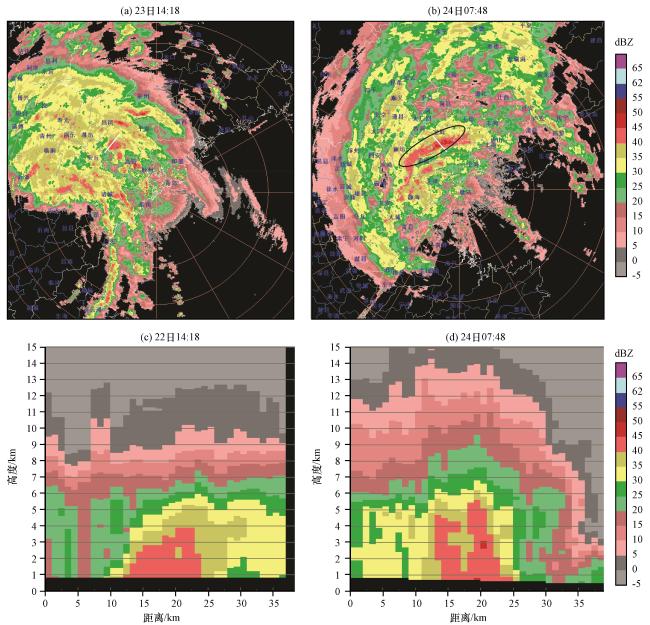
图5 2018年7月23日14:18青岛雷达组合反射率及其剖面(a, c)和24日07:48塘沽雷达组合反射率及其剖面(b, d) (单位: dBZ)Fig.5 Radar composite reflectance and its vertical profile of Qingdao Station at 14:18 on 23 (a, c) and Radar composite reflectance and its vertical profile of Tanggu Station at 07:48 on 24 (b, d) July 2018.Unit: dBZ |
5 台风暴雨落区分布的差异性分析
5.1 动力学机制
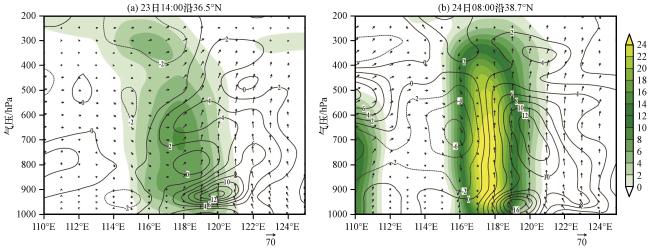
图6 2018年7月23日14:00和24日08:00沿台风中心(36.5°N和38.7°N)的温度平流(等值线, 单位: ×10-5 K·s-1)、 正涡度(彩色区, 单位: ×10-5 s-1)和风场(矢量, 单位: m·s-1)Fig.6 The temperature advection (contours, unit: ×10-5 K·s-1) and positive vorticity (color area, unit: ×10-5 s-1) and wind field (vector, unit: m·s-1) along the center of the typhoon (36.5°N and 38.7°N) at 14:00 on 23 and at 08:00 on 24 July 2018 |
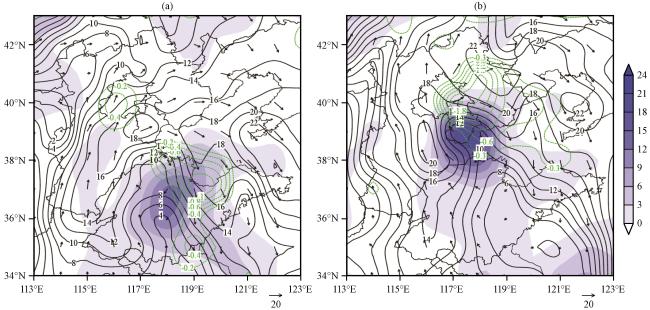
图7 2018年7月23日14:00(a)和24日08:00(b)200~850 hPa之间的垂直风切变(黑色等值线和风矢量, 单位: m·s-1)、 700 hPa涡度(彩色区, 单位: ×10-5 s-1)和垂直速度(绿色虚线, 单位: Pa·s-1)Fig.7 Vertical wind shear between 200~850 hPa (black isoline and wind vector, unit: m·s-1), 700 hPa vorticity (colar area, unit: ×10-5 s-1) and vertical velocity (green dotted line,unit:Pa·s-1) at 14:00 on 23 (a) and at 08:00 on 24 (b) July 2018 |
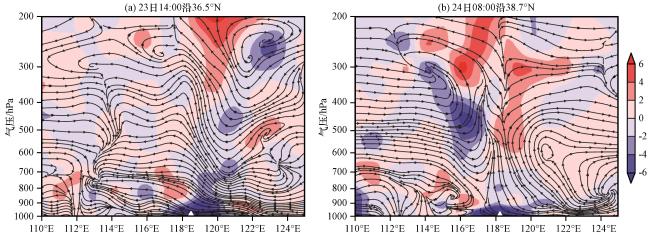
图8 2018年7月23日14:00和24日08:00沿台风中心(36.5°N、 38.7°N)的散度(彩色区, 单位: ×10-5 s-1)与u-w风场(流线, u, 单位: m·s-1, w×10, 单位: Pa·s-1)Fig.8 Zonal-height profile of divergence (color area, unit: ×10-5 s-1) and u-w (stream line, u, unit: m·s-1, w×10, unit: Pa·s-1) along the center of the typhoon (36.5°N, 38.7°N) at 14:00 on 23 (a) and at 08:00 on 24 (b) July 2018 |
5.2 对流环境条件分析
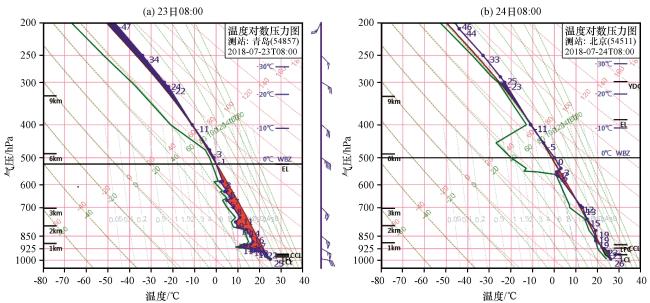
图9 2018年7月23日08:00青岛站(a)和24日08:00北京站(b)的探空曲线Fig.9 T-lgP diagram of Qingdao station at 08:00 on 23 (a) and T-lgP diagram of Beijing station at 08:00 on 24 (b) July 2018 |
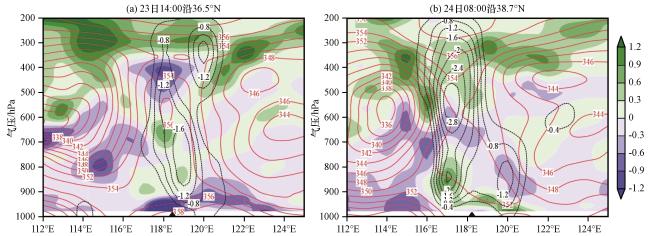
图10 2018年7月23日14:00(a)和24日08:00(b)沿台风中心(36.5°N、 38.7°N)假相当位温(红色等值线, 单位: K)、 垂直速度(黑色虚线, 单位: Pa·s-1)和湿位涡(阴影, 单位: ×10-6 m2·K·kg-1·s-1)的纬向-高度剖面Fig.10 Latitudinal-altitude profiles of pseudo-equivalent temperature (red contour, unit: K) and vertical velocity (black dotted line, unit: hPa·s-1) and moist potential vorticity (shadow, unit: ×10-6 m2·K·kg-1·s-1) along the center of typhoon (36.5°N、 38.7°N) at 14:00 on 23 (a) and 08:00 on 24 (b) July 2018 |
5.3 水汽输送条件
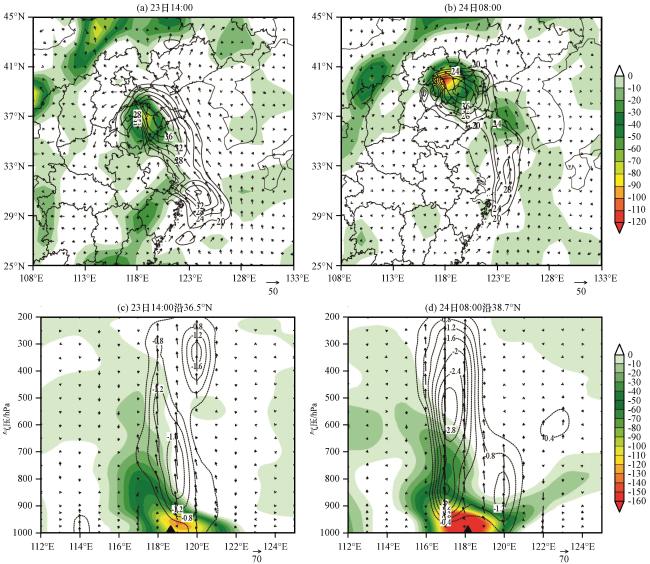
图11 2018年7月23日14:00和24日08:00 925 hPa水汽通量(等值线, 单位: g·s-1·hPa-1·cm-1)、 水汽通量散度(彩色区, 单位: ×10-8 g·s-2·cm-1·hPa-1)和风矢量(单位: m·s-1)(a, b)与沿台风中心(36.5°N、 38.7°N)的水汽通量散度(彩色区, 单位: ×10-8 g·s-1·cm-2·hPa-1)、 垂直上升速度(等值线, 单位: Pa·s-1)和u-w风场(矢量, u, 单位: m·s-1, w×100, 单位: Pa·s-1)(c, d)的纬向-高度剖面Fig.11 Water vapor flux (contour, unit: pa·s-1), water vapor flux divergence (color area, unit: ×10-8 g·s-2·cm-1·hPa-1) and wind vector (unit: m·s-1) on 925 hPa (a, b) and the zonal-height profile of water vapor flux divergence (color area, unit: ×10-8 g·s-2·cm-2·hPa-1), vertical ascent speed (contour, unit: pa·s-1) and u-w (arrow, u, unit: m·s-1, w× 100, unit: Pa·s-1) along the typhoon center (36.5°N, 38.7°N) (c, d) at 14:00 on 23 and at 08:00 on 24 July 2018 |
5.4 地形的作用
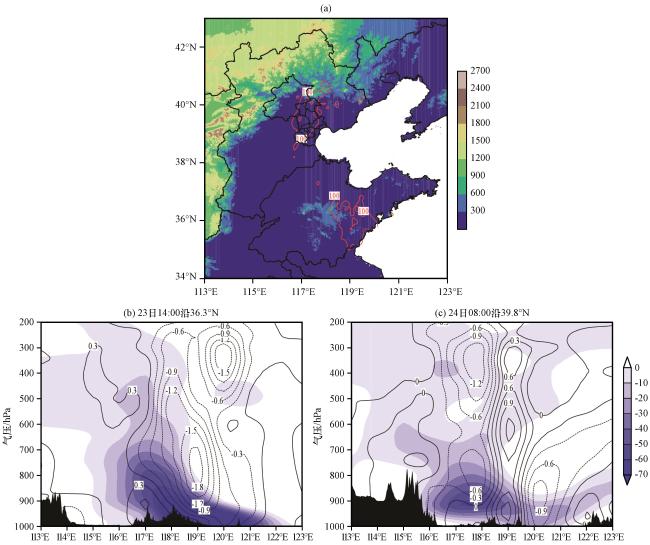


图12 2018年7月23日08:00至24日14:00大暴雨落区分布(a, 单位: mm)与23日14:00和24日08:00沿36.3°N和39.8°N的水汽通量散度(彩色区, 单位: ×10-8 g·s-1·cm-2·hPa-1)和垂直速度(等值线, 单位: ×10-2 hPa·s-1)垂直剖面(b, c)(a)中红色等值线为100 mm等值线, 彩色区为海拔(单位: m); (b)~(c)中黑色阴影是地形 Fig.12 Distribution of heavy rainstorms from 08:00 on 23 to 14:00 on 24 July 2018 (a, unit: mm), the vertical cross section of the water vapor flux divergence (color area, unit: ×10-8 g·s-1·cm-2·hPa-1) and vertical velocity ( contour, unit: ×10-2 hPa·s-1) along 36.3°N and 39.8°N at 14:00 on 23 and at 08:00 on 24, July 2018 (b, c).The red contour in Fig12.(a) is the contour of precipitation of 100 mm, and the color area is the altitude (unit: m); the black shadow in Fig12.(b)~(c) is the terrain |