
1 引言
2 资料选取与方法介绍
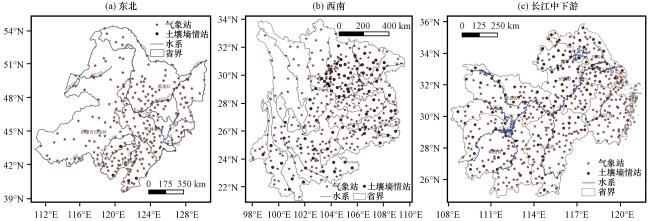
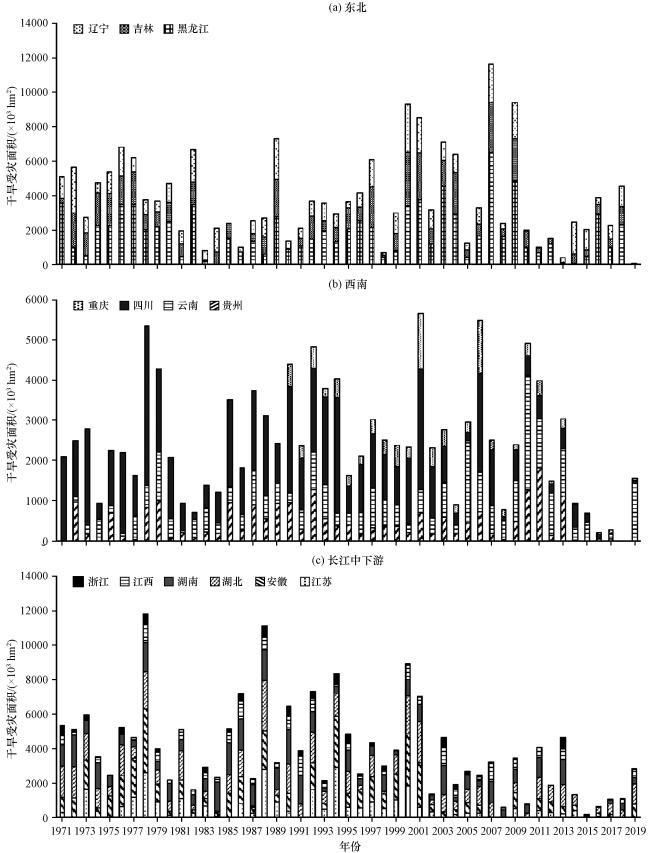
表1 各干旱指数对应的干旱等级划分表Table 1 Drought classification corresponding to each drought index |
| 等级 | 类型 | SPI | SPEI | MI | MCI |
|---|---|---|---|---|---|
| 1 | 无旱 | -0.5 SPI | -0.5 SPEI | -0.40 MI | -0.5 MCI |
| 2 | 轻旱 | -1.0 SPI -0.5 | -1.0 SPEI -0.5 | -0.65 MI -0.40 | -1.0 MCI -0.5 |
| 3 | 中旱 | -1.5 SPI -1.0 | -1.5 SPEI -1.0 | -0.80 MI -0.65 | -1.5 MCI -1.0 |
| 4 | 重旱 | -2.0 SPI -1.5 | -2.0 SPEI -1.5 | -0.95 MI -0.80 | -2.0 MCI -1.5 |
| 5 | 特旱 | SPI -2.0 | SPEI -2.0 | MI -0.95 | MCI -2.0 |
3 对干旱时空特征的诊断
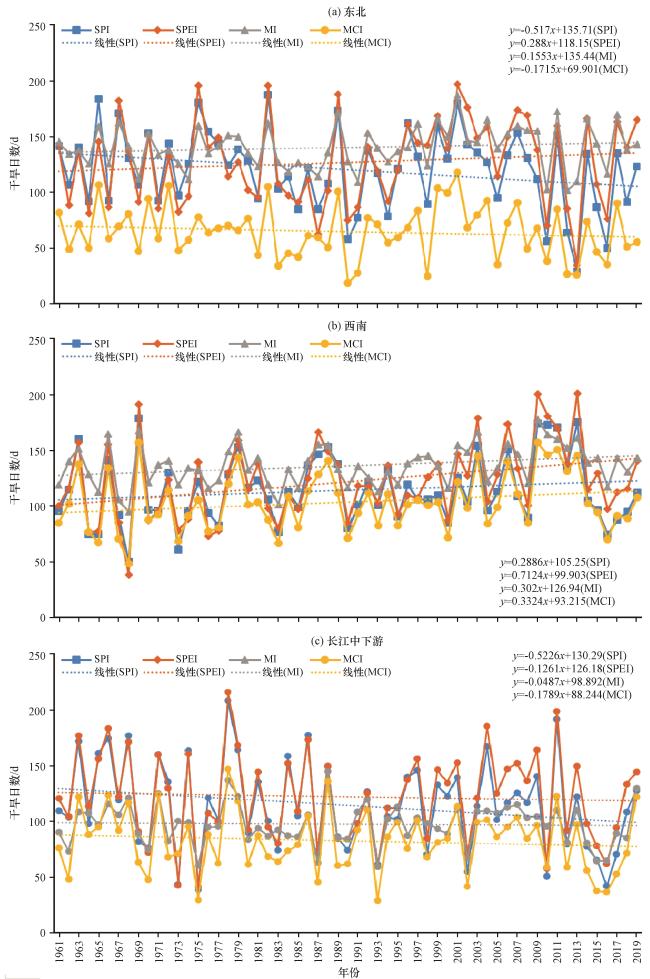
3.1 干旱日数年际变化
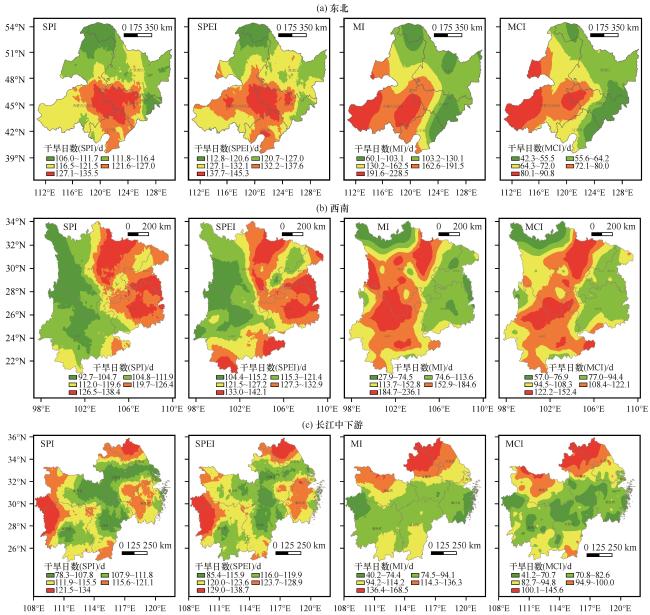
3.2 干旱日数空间分布
4 对干旱过程的诊断
4.1 典型干旱过程逐日诊断
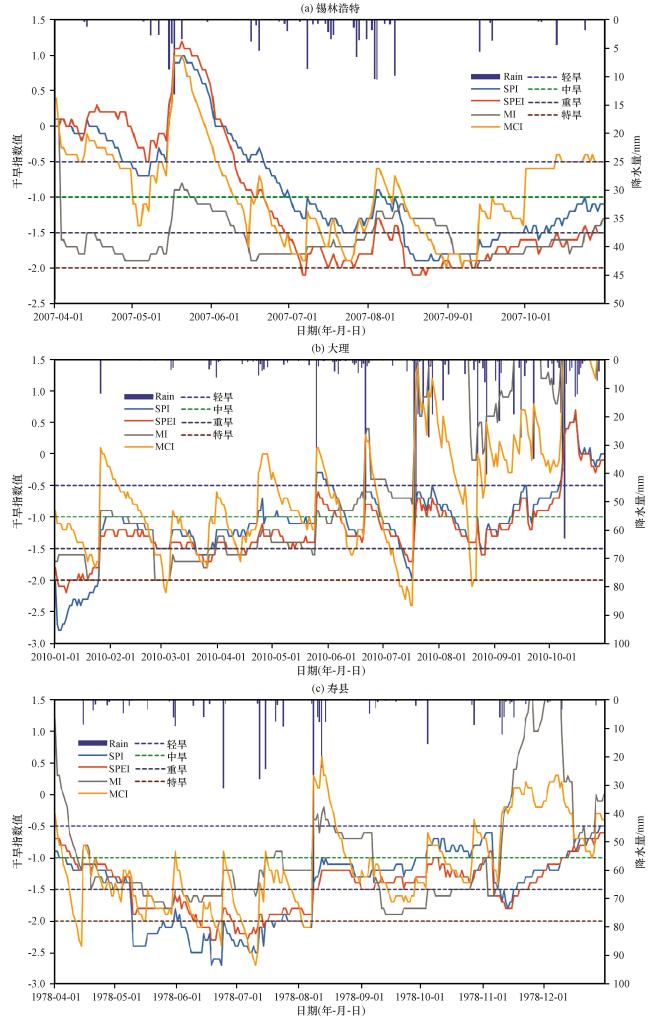
图5 基于SPI、 SPEI、 MI、 MCI指数的中国东北(锡林浩特)、 西南(大理)和长江中下游(寿县)地区代表站典型干旱过程诊断Fig.5 Diagnosis of typical drought processes of representative stations based on the indexes of SPI, SPEI, MI and MCI in the northeast (Xilinhot), southwest (Dali) and middle-lower reaches of Yangtze River (Shouxian) of China |
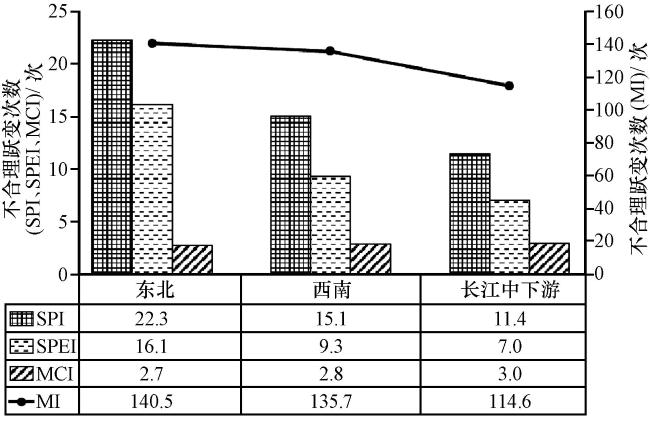
4.2 干旱不合理跃变分析
5 与土壤墒情及干旱灾情相关性
5.1 与土壤墒情相关性
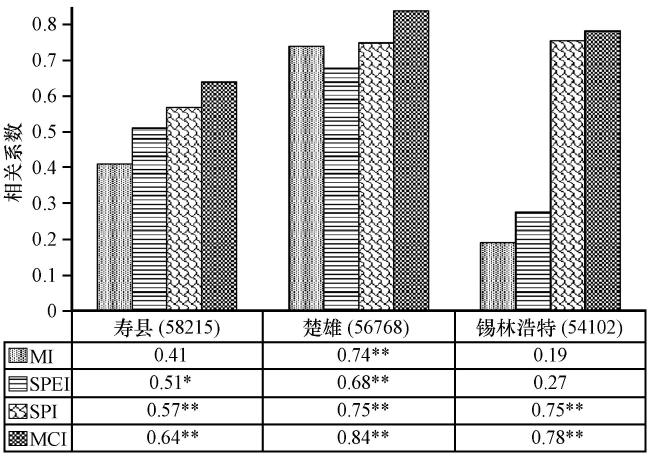
图7 中国东北、 西南和长江中下游地区代表站典型干旱过程SPI、 SPEI、 MI、 MCI指数值与土壤墒情相关性*为通过95%信度检验, **为通过99%信度检验 Fig.7 Correlations between value of the indexes of SPI, SPEI, MI and MCI and soil moisture of typical drought processes of representative stations in the northeast, southwest and middle-lower reaches of Yangtze River of China.* have passed the confident level of 95%, **have passed the confident level of 99% |
5.2 与干旱灾情相关性
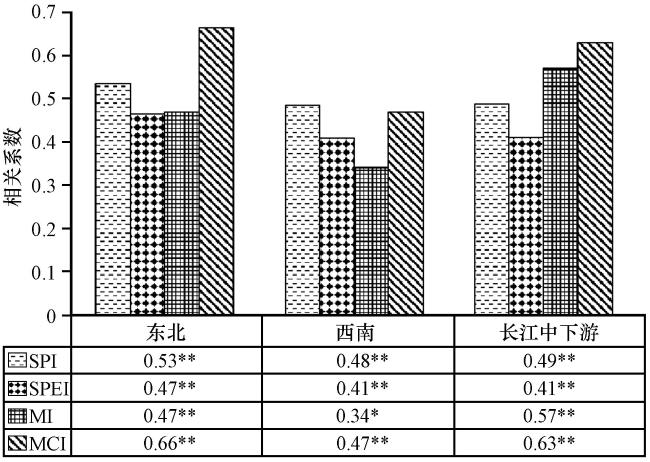
图8 基于SPI、 SPEI、 MI、 MCI指数的中国东北、 西南和长江中下游地区年干旱日数与干旱受灾面积相关性*为通过95%信度检验, **为通过99%信度检验 Fig.8 Correlations between drought-affected area and annual drought days based on the indexes of SPI, SPEI, MI and MCI in the northeast, southwest and middle-lower reaches of Yangtze River of China.* have passed the confident level of 95%, **have passed the confident level of 99% |