

1 引言
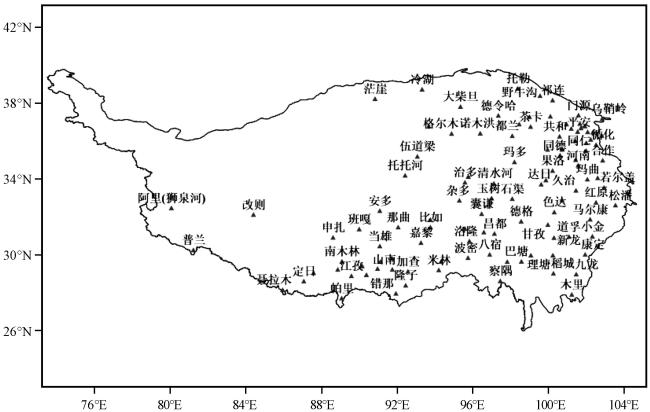
2 资料选取与方法介绍
2.1 资料选取
2.2 雨季划分方法
表1 四个代表站雨季开始、 结束候划分结果对比Table 1 Split result comparison about rainy season beginning and offset in four stations |
| 标准 | 甘肃合作 | 四川康定 | 青海玛多 | 西藏当雄 | |||||
|---|---|---|---|---|---|---|---|---|---|
| 降水阈值 | 出现侯 | 降水阈值 | 出现侯 | 降水阈值 | 出现侯 | 降水阈值 | 出现侯 | ||
| 雨季开始期 | 最优分割 | 13.6 | 28 | 20.3 | 25 | 6.2 | 28 | 11.6 | 30 |
| 72候平均 | 7.6 | 22 | 11.6 | 23 | 4.5 | 29 | 6.6 | 27 | |
| 36候平均 | 13.1 | 30 | 19.5 | 29 | 7.9 | 34 | 12.3 | 30 | |
| 突变侯 | 10.7 | 26 | 16.0 | 23 | 4.8 | 27 | 9.8 | 31 | |
| 检验t值 | -8.17 | -9.656 | -7.83 | -8.58 | |||||
| 雨季终止期 | 最优分割 | 9.5 | 58 | 8.4 | 55 | 6.7 | 53 | 9.5 | 53 |
| 72侯平均 | 7.6 | 57 | 11.6 | 54 | 4.5 | 51 | 6.6 | 51 | |
| 36侯平均 | 13.1 | 52 | 19.5 | 56 | 7.9 | 54 | 12.3 | 54 | |
| 突变侯 | 9.0 | 56 | 7.2 | 57 | 3.9 | 55 | 9.8 | 54 | |
| 检验t值 | 10.39 | 10.69 | 9.43 | 9.11 | |||||
3 高原雨季起讫期时空变化特征
3.1 雨季起讫期变化特征
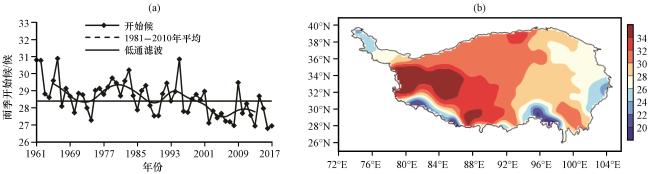
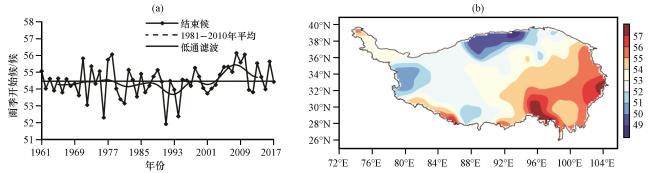
3.2 影响高原雨季开始的环流系统
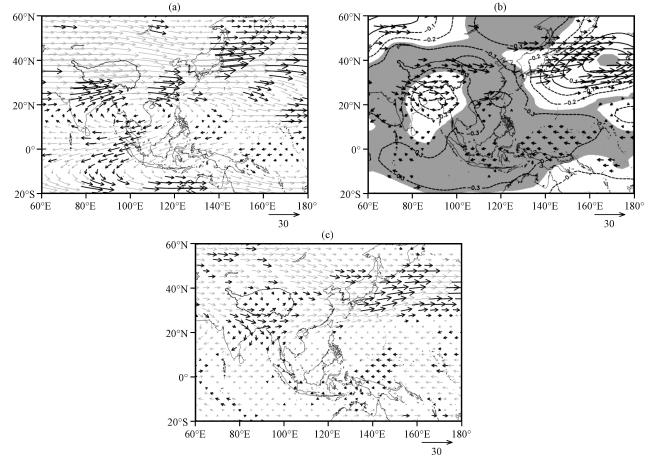
图4 1961 -2017年雨季开始候与5月200 hPa风场(a, 矢量, 单位: m·s-1)、 500 hPa风场(矢量, 单位: m·s-1)及高度场(等值线, 单位: gpm)(b)、 600 hPa风场(c, 单位: m·s-1)相关分布加粗风场为通过95%显著性检验的风场; 填色区域为通过95%显著性检验的高度场 Fig.4 The correlation between the onset of the rainy season from 1961 to 2017 with the May 200 hPa wind field (a, vector, unit: m·s-1), the 500 hPa wind field (vector, unit: m·s-1) and the height field (contour, unit: gpm) (b), and the 600 hPa wind field (c, vector, unit: m·s-1).The roughened wind field passes the 95% significance test; the shaded area is the height field passes the 95% significance test |
3.3 高原雨季起讫前后环流特征
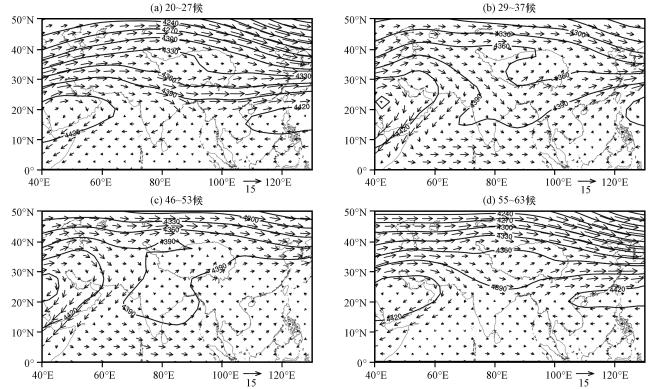
图5 1981 -2010年高原雨季开始前(a)、 后(b), 结束前(c)、 后(d) 600 hPa气候平均高度场(等值线, 单位: gpm)和风场(矢量, 单位: m·s-1)Fig.5 600 hPa climatic average height field (contour line, unit: gpm) and wind field (vector, unit: m·s-1) before (a) and after (b) the beginning and ending of the plateau rainy season, before (c) and after (d) the ending of the plateau rainy season from 1981 to 2010 |
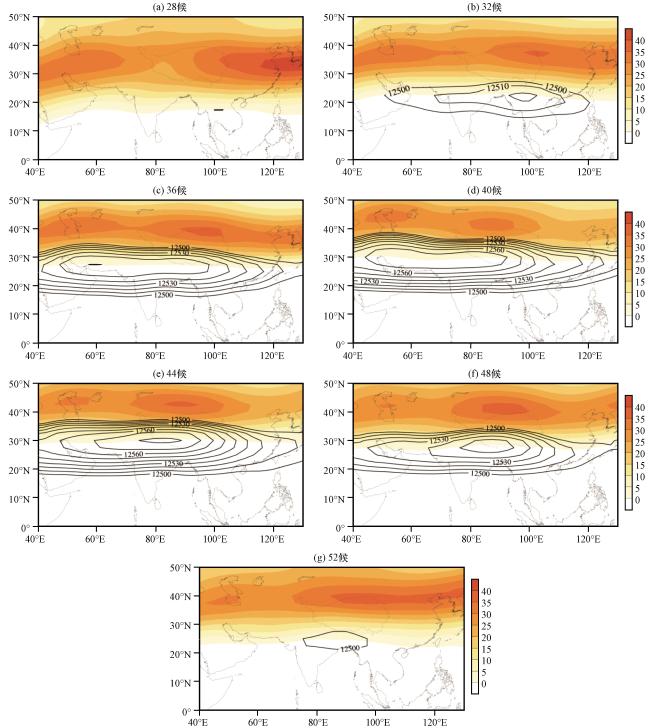
3.4 南亚高压的影响
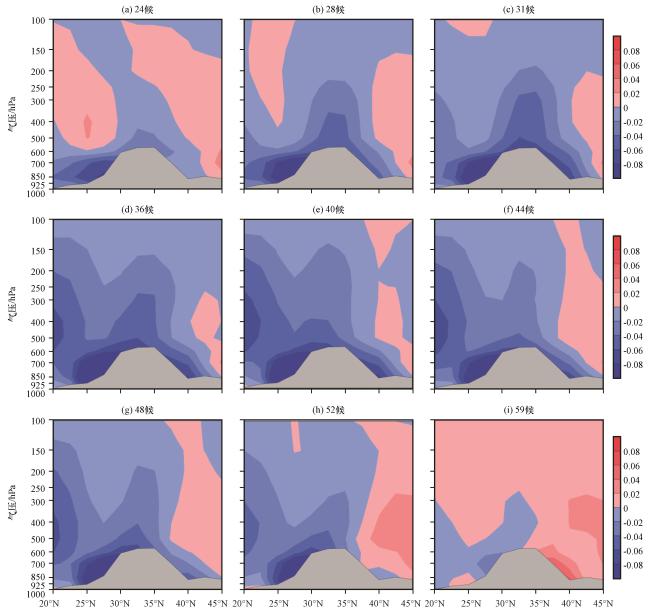
3.5 垂直运动特征
3.6 雨季开始/结束早晚年的环流异常特征
表2 历史上雨季开始/结束偏早和偏晚时对应年份及所在候Table 2 Rainy start/offset earlier or later time per year in history |
| 开始偏早 | 开始偏晚 | 结束偏早 | 结束偏晚 | |||||||
|---|---|---|---|---|---|---|---|---|---|---|
| 年份 | 候 | 年份 | 候 | 年份 | 候 | 年份 | 候 | |||
| 1974 | 27.3 | 1961 | 30.8 | 1972 | 531 | 1971 | 55.8 | |||
| 2002 | 27.1 | 1962 | 30.8 | 1976 | 52.3 | 1977 | 55.7 | |||
| 2004 | 27.4 | 1966 | 30.9 | 1980 | 53.4 | 1978 | 56.0 | |||
| 2006 | 27.2 | 1979 | 29.7 | 1981 | 53.1 | 2008 | 56.1 | |||
| 2007 | 27.2 | 1983 | 30.2 | 1991 | 51.9 | 2009 | 55.6 | |||
| 2008 | 27.0 | 1995 | 30.8 | 1994 | 52.4 | 2010 | 56.0 | |||
| 2013 | 26.9 | - | - | - | - | 2013 | 55.5 | |||
| 2016 | 26.8 | - | - | - | - | 2016 | 55.6 | |||
| 2017 | 26.9 | - | - | - | - | - | - | |||
-表示无数据 |
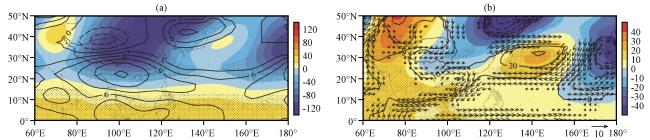
图8 高原雨季来临偏早/偏晚时200 hPa纬向风(等值线, 单位: m·s-1)、 高度场(彩色区, 单位: gpm)(a)和600 hPa风场(矢量, 单位: m·s-1)、 高度场(等值线, 单位: gpm)、 500 hPa高度场(彩色区, 单位: gpm)(b)的差值检验场填色图打点部分通过95%显著性检验; 等值线及风场只显示通过95%显著性检验值 Fig.8 The differences of plateau rainy season onset earlier and later year on 200 hPa zonal wind (lines, unit: m·s-1) and geopotential height (color area, unit: gpm)(a) and 600 hPa wind (vector, unit: m·s-1), geopotential height (contour, unit: gpm) and 500 hPa geopotential height (color area, unit: gpm) (b).Shaded with dot represent above the 95% significance test; lines and vector only show above the 95% significance test values |
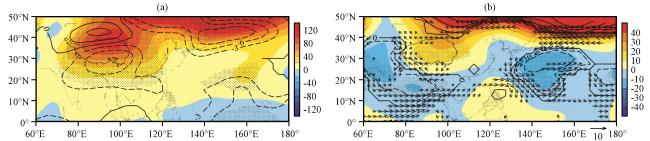


图9 高原雨季结束偏早/偏晚时200 hPa纬向风(等值线, 单位: m·s-1)、 高度场(彩色区, 单位: gpm)(a)和600 hPa风场(矢量, 单位: m·s-1)、 高度场(等值线, 单位: gpm)、 500 hPa高度场(彩色区, 单位: gpm)(b)的差值检验场填色图打点部分通过95%显著性检验; 等值线及风场只显示通过95%显著性检验值 Fig.9 The differences of plateau rainy season offset earlier and later year on 200 hPa zonal wind (lines, unit: m·s-1) and geopotential height (color area, unit: gpm) (a) and 600 hPa wind (vector, unit: m·s-1), geopotential height (contour, unit: gpm) and 500 hPa geopotential height (color area, unit: gpm) (b).Shaded with dot represent above the 95% significance test; lines and vector only show above the 95% significance test values |